
Turn Waste Golden Tide into Treasure: Bio-Adsorbent Synthesis for CO2 Capture with K2FeO4 as Catalytic Oxidative Activator

1
College of Chemical Engineering, Zhejiang University of Technology, Hangzhou 310014, China
2
College of Environment, Zhejiang University of Technology, Hangzhou 310014, China
3
College of Biological, Chemical Science and Engineering, Jiaxing University, Jiaxing 314001, China
*
Author to whom correspondence should be addressed.
Molecules 2024, 29(6), 1345; https://doi.org/10.3390/molecules29061345
Submission received: 20 February 2024
/
Revised: 14 March 2024
/
Accepted: 15 March 2024
/
Published: 18 March 2024
(This article belongs to the Special Issue Renewable Energy, Fuels and Chemicals from Biomass)
Abstract
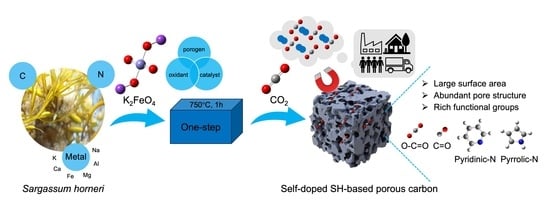
:Converting Sargassum horneri (SH)—a harmful marine stranding that can cause golden tide—to highly porous bio-adsorbent material (via one-step catalytic oxidative pyrolysis with K2FeO4) can be a strategically useful method for obtaining low-cost materials suitable for CO2 capture. In this manuscript, the behavior of different mass ratios of K2FeO4/SH precursor acting on the surface physicochemical properties of carbon materials are reported. The results suggest that specific surface area and total pore volume first increased to the mass ratio of K2FeO4/carbon precursor, then decreased. Among the samples prepared, the highest specific surface area was obtained with a K2FeO4/SH precursor ratio of 1:4 (25%-ASHC), and the CO2 adsorption performance was significantly increased and faster compared with the original biochar. The fitted values of the three kinetic models showed that the double exponential model provided the best description of carbon adsorption, indicating both physical and chemical adsorption; 25%-ASHC also exhibited excellent cyclic stability. The improved CO2 adsorption performance observed after K2FeO4 activation is mainly due to the increase in material porosity, specific surface area, and the enrichment of nitrogen and oxygen functional groups.
1. Introduction
In recent years, the golden tide dominated by Sargassum has become a kind of emerging marine ecological hazard occurring frequently around the world. The ecological phenomenon whereby the floating brown genus Sargassum changes the color of seawater as a result of rapid growth or high concentration enrichment is known as a “golden tide” [1]. Since 2002, large-scale golden tide invasions have occurred along the Brazilian coast of the South Atlantic Ocean, the Caribbean coast, the west coast of Africa, the waters of the tropical island nations of the South Pacific Ocean, and the North Pacific coast, with devastating impacts on the local tourism economy, fishery resources, and the marine environment [2,3,4,5,6]. The state of Texas in the United States spends at least $2.9 million each year cleaning up Sargassum on beaches. In China, since 2012, large-scale floating and gathering of Sargassum has also occurred off the mouth of the Yangtze River, Shandong Province (to the east of Rizhao), and the coasts of Dalian and Jiangsu Provinces, gradually developing into a golden tide that has struck the country’s coastal cities [7,8,9,10,11]. Especially in Jiangsu’s seaweed culture area, due to the emergence of golden tide, the breeding rafts seriously collapsed and resulted in Nantong and Yancheng experiencing direct economic losses of up to more than $70 million. In 2017, a wide-scale golden tide of Sargassum occurred east of the Yellow Sea, triggering the rare phenomenon of “three tides”—golden tide, green tide, and red tide, and the distribution area of golden tide even exceeded the area of green tide during the same period. This indicates that the golden tide has become the second large-scale seaweed disaster in China’s offshore after the green tide. This kind of disaster will cover a large area of the sea and seriously affect the growth of other algaes. On the other hand, the aggregation and decomposition of Sargassum will generate toxic and hazardous substances, which will easily cause pollution of the water environment, aggravate eutrophication and hypoxia in the water body, and have the potential of triggering the red tide of certain microalgae. In serious cases, it may also affect the marine planktonic ecosystem, making demersal neritic fish and Crustacea the most affected groups [9,12]. In addition, the massive accumulation and stranding of algae in the shallows and along the shoreline during the decline period not only hinders vessel navigation and endangers the shallow water aquaculture industry and coastal ecosystems, but also jeopardizes the safety of marine ecosystems and triggers the growth of Vibrio vulnificus and other related problems, which in turn threaten human health. Some modelling studies have speculated that in the future, the phenomenon of golden tides similar to the one in 2017 in China’s offshore is also likely to recur, or even become more serious, along with global warming and the intensification of nutrient inputs with riched nitrogen and phosphorus from offshore aquaculture [9,13]. Therefore, it is necessary to explore research on strategies to increase the added value of Sargassum in order to reduce its detrimental impacts.
The composition of Sargassum mainly consists of polysaccharides such as lignin, cellulose, hemicellulose, and alginate. In recent years, the use of its biological properties to prepare various biomass-based materials has been reported, with applications in various fields such as medicine [14], energy storage [15], and adsorption [16,17]. Especially in the field of adsorption, Sargassum has been favored by scholars for its complex cell wall structure, abundant phycobiliprotein, fucoidan, sulphated seaweed polysaccharides and high concentration of carboxyl groups, and other biological properties that are conducive to rapid adsorption [18]. Gonzalez Fernandez et al. [19] suggested that the shape of Sargassum, the ideal surface charge density, and the presence of abundant hydroxyl as well as –COOH groups are essential for the effective enhancement of heavy metal adsorption performance. Jafarian et al. [20] developed a sustainable and cost-effective Sargassum-based cationic dye adsorbent, indicating that Sargassum has a fibrous structure, and its matrix contains a variety of polysaccharides and a high concentration of active elements (Na, Mg, N, S, P, etc.), which are suitable for adsorption. Along with the increase in greenhouse effect, there are also studies on the application of Sargassum to CO2 adsorption, mainly focusing on the alkali metal activation process, especially KOH, which has gained attention due to its ability to obtain a large specific surface area. Ding et al. [21] prepared algal-based activated carbon by KOH modification, taking advantage of the carbon-, oxygen- and sulphur-enriched Sargassum, and the results showed that the high specific surface area and the oxygen- and sulphur-containing functional groups were the main factors to improve its adsorption performance. Our previous work also found that using nitrogen- and potassium-enriched Sargassum as the precursor to prepare carbonaceous adsorbent can reduce the dosage of KOH with good CO2 adsorption performance [22]. However, it is well known that the disadvantages of using KOH as an activator are also quite obvious, such as higher temperature, higher energy consumption, more serious destruction of the biomass self-template, and the corrosive problem of the equipment is difficult to solve with larger dosage. Therefore, looking for a greener activator is an urgent problem to be solved at present.
As an efficient green biocide, potassium ferrate (K2FeO4) is commonly used in the purification of drinking water [23]. It is significantly more environmentally friendly than alkali metal activators such as KOH, and the lower K content of K2FeO4 protects the biomass from the self-template effect and prevents over-etching [24]. Consequently, K2FeO4 has shown distinct advantages in the development of other biomass-based carbon-based materials since 2017. It is widely used for the removal of metal ions, organics, and dyes from wastewater [25,26,27] as it not only has the pore-forming ability of the potassium-based component, but also has the catalytic function of graphitization of the iron-based component, which can synergistically regulate the pore structure and enhance the degree of graphitization of the carbon material [28]. However, most of the existing studies ignored that K2FeO4 has a stronger oxidizing ability than potassium permanganate (KMnO4), which can be used for oxidative modification of biomass-based carbon materials to increase the number and type of surface functional groups in order to improve the adsorption capacity. Meanwhile, the presence of Fe can not only play a catalytic role in lowering the reaction temperature and reducing the reaction time, but also improve the stability of the carbon material through the metal modification of iron. Inspired by our previous work, the addition of Fe did significantly accelerate the activation of K and reduced the KOH loading and reaction temperature. The carbon materials synthesized from Fe(NO3)3/KOH as co-activator had higher specific surface area and better CO2 uptake capacity than those activated only by KOH [29,30]. Therefore, K2FeO4 will be an effective activator for CO2 bio-adsorbent preparation. Nevertheless, there are few studies on the synthesis of biomass-based carbon materials using K2FeO4 for CO2 capture.
In this study, the catalytic, activating, and oxidizing properties of K2FeO4 were fully utilized. Combining the sustainable and low-cost advantages of abundant Sargassum horneri (SH, a kind of Sargassum) reserves, fast growth rate, easy cultivation, and harvesting, the one-step pyrolysis and oxidation activation with K2FeO4 was used to produce self-doped SH-based carbon materials (ASHC). Compared with the traditional two-step process of carbonization followed by activation, one-step pyrolysis has the advantages of less time and energy consumption, which reduce the production cost. This paper focus on the different mass ratios of K2FeO4/SH precursor to the physical and chemical properties of carbonaceous material, and three adsorption kinetic models were fitted and analyzed under different adsorption temperatures. Cyclic adsorption–desorption behavior was evaluated to assess the feasibility of the carbonaceous materials for long-term applications. Turning seaweed into treasure and applying it in carbon dioxide capture provides a pathway for simultaneously solving two global problems—the golden tide and the greenhouse effect. This study can also provide an important reference for achieving green, large-scale, and low-cost production of biomass porous carbon solid adsorbent materials.
2. Results and Discussion
2.1. Characterization of Adsorbents
2.1.1. BET Analysis
To illustrate the contribution of K2FeO4 to formation of pore structure, BET analysis was performed on samples with loading increase. As shown in Figure 1, the adsorption–desorption isotherms of the five activated carbon materials exhibited typical type I isotherms in accordance with the IUPAC standard. There was a clear adsorption inflection point at low relative pressure (P/P0 < 0.4), suggesting that the adsorbent has a rich microporous structure [31]. All isotherms exhibited H4-type hysteresis cycles in the region of high relative pressure (P/P0 > 0.4), the presence of which signaled that the micropores were also accompanied by mesopores and macropores. In addition, the pore size distribution curves indicate that the obtained ASHCs have a large number of ultra-micropores (<0.7 nm), which will play the critical role in CO2 adsorption at low pressures [32]. All ASHCs have a narrow microporous pore size distribution centered on about 0.7 nm. However, different amounts of activators cause different activation effects on all the samples, resulting in a big difference in micropore volume and also a big difference in total pore volume and specific surface area, which may lead to different CO2 adsorption of different samples. As shown in Table 1, we can see that all the activator-added adsorbents showed a significant increase compared to the pristine biochar adsorbent. Specific surface area, total pore volume, and microporous volume increased and then decreased with the addition of an activator, showing a maximum at 25wt% addition; 5%-ASHC had the smallest average diameter of micropores, but its lower total micropore volume possibly make it poor at carbon dioxide adsorption. On the other hand, 50%- and 100%-ASHC may have partially collapsed char wall structure because of the over-activation by K2FeO4 [33,34]. Overall, 25%-ASHC exhibited the largest specific surface area (1245 m2·g−1), pore volume (0.8827 cm3·g−1), and micropore volume (0.5682 cm3·g−1), as well as the highest percentage of micropore volume (0.6437 cm3·g−1)—almost 40 times, 20 times, and 25 times that of 0%-SHC. This is because appropriate K2FeO4 activation can significantly increase the BET surface area and total pore volume of SH, which will contribute to promoting CO2 adsorption. As Gong et al. first summarized in 2017 [28], K2FeO4 was used as both the activating agent (K) and catalyst (Fe species) to regulate pore structure and catalytic graphitization of SH, according to Equation (1).
The mechanism mainly demonstrated the pore formation as KOH activation with Equations (2)–(5) in Wang and Kaskel’s report [35]. KOH starts by reacting at 400–600 °C to form the intermediate products K2O and K2CO3 (Equations (2) and (3)). When the temperature is higher than 700 °C, K2CO3 partially decomposes into K2O and CO2 (Equation (4)). Meanwhile, the produced CO2, K2O, and K2CO3 further reacted with carbon to form CO and potassium metal (Equations (5)–(7)). The free potassium metal penetrates into the carbon lattice, causing the lattice to swell, which is then rapidly detached from the carbon organism, forming a pore structure [36].
The catalytic effect of K2FeO4 is mainly reflected in Equations (8)–(11). Fe(OH)3 is firstly converted to Fe2O3 at 400 °C (Equation (8)), which are all α-Fe2O3 at first; later, α-Fe2O3 is partially converted to γ-Fe2O3 above 500 °C (Equation (9)) and is further converted to Fe3O4 (Equation (10)). The reducing components further interact with Fe3O4 to form Fe (Equation (11)) [37]. The presence of iron oxide crystals was also detected in the subsequent XRD. As an efficient catalyst, Fe played an especially important role in decreasing the reaction temperature, accelerating the activation process, and catalyzing graphitization of SH. Moreover, it will not produce any contaminants during the preparation compared with other metals [38].
2.1.2. SEM and TEM Analysis
The SEM image of 25%-ASHC was shown in Figure 2. We reported [30] the structural morphology of pristine SH, which mainly consists of axial tubular fibers with a dense structure; 25%-ASHC formed a dense honeycomb structure on the surface; this is because the dense structure of pristine SH was destroyed after activation; the etching of component K resulted in a large number of pores formed. By contrast, as shown in Figure S1a,b, 15%-ASHC had holes with smaller diameters on the surface, but they were fewer in number and more dispersed, leaving the holes disconnected from each other, while the surface roughness of the 50%-ASHC sample is reduced, which may be the result of excessive activation. These obtained results are consistent with BET analysis consequence. High-resolution transmission electron microscopy (TEM) was used to observe in more detail about 25%-ASHC as shown in Figure 2b. It can be observed that the 25%-ASHC has obvious characteristics of carbon material with flaky edges, along with a microporous structure, which is crucial for the CO2 adsorption performance of activated carbon as the kinetic diameter of CO2 is 0.33 nm; studies have shown that the adsorption rate of CO2 mainly depends on the volume of narrow micropores with pore size less than 0.8 nm [39,40]. Here, the micropore diameter of 25%-ASHC is 0.72 nm from BET analysis, consistent with TEM results.
2.1.3. FTIR Analysis
The FTIR spectra of SHC and ASHCs are shown in Figure 3. A very broad peak appears at 3100~3640 cm−1 in all samples, which may be attributed to the O-H and N-H stretching vibration of carboxyl and amine groups, respectively. The strongest peak at 1631 cm−1 corresponds to carbonyl C=O stretching vibration of surface functional groups [27]. The peaks at 1121 cm−1 correspond to the stretching vibration of the C-O bond. These oxygen-containing functional groups are likely to be ketol or lactone groups due to the oxidation of K2FeO4, which are usually alkaline and beneficial for carbon dioxide adsorption. This was verified by subsequent XPS detection. Additionally, the weak adsorption peak at 617 cm−1 and 2829 cm−1 corresponds to a saturated C-H stretching vibration adsorption peak, while 775 cm−1 and 3450 cm−1 corresponds to the out-of-plane bending vibration of the N-H bond. The peaks at 1121 cm−1 correspond to the stretching vibration of the C-N bond. The presence of nitrogen-containing functional groups also supports the idea that SH are rich in protein, which will play a self-doping role during pyrolysis to enhance the CO2 adsorption [41]. Additionally, the peak observed at 2357 cm−1 may be due to the adsorption of CO2 by the sample during storage. As can be seen in Figure 3, there is no CO2 adsorption peak on the surface of the original carbon and 5%-ASHC, but there is the rest of the activated carbon, which indicates that the activation of an appropriate amount of potassium ferrate can indeed improve its adsorption capacity for carbon dioxide.
2.1.4. XPS Analysis
Three peaks of 25%-ASHC at 285, 400, and 532 eV were observed and attributed to carbon (C 1 s), nitrogen (N 1 s), and oxygen (O 1 s), respectively, as shown in Figure S2. Figure 4 shows fitting of C 1 s, O 1 s, and N 1 s spectra. In the C 1 s XPS spectra (Figure 4a), five peaks at 284.8, 286.1, 287.3, 288.6, and 290.0 eV can be relative to C-C/C=C, C-N, C-O, O=C-O, and π-π*, respectively. This shows that this is a typical carbon material structure. In the N 1 s XPS spectra (Figure 4b), four peaks at 398.6, 400.3, 401.5, and 403.1 eV were attributed to pyridinic-N, pyrrolic-N, graphitic-N, and oxidized-N, respectively. These nitrogen-containing components mainly come from self-doping of SH and form specific alkaline functional groups under the action of K2FeO4. It has been reported that pyridinic-N is found in 6-membered ring structures and that pyrrolic-N is found in 5-membered ring structures [42]. Pyridinic-N contributes one electron to the aromatic π-system, and pyrrolic-N contributes two p-electrons to the π-system. Therefore, they have a Lewis basic character and are beneficial for the capture of CO2 (Lewis acid) [43]. In the O 1 s XPS spectra (Figure 4c), four peaks at 530.5, 531.9, 533.5, and 535.5 eV were attributed to C=O, C-O-C/O=C-O, C-OH, and H2O-O2, which exist in the form of carbonyl or ketone groups (C=O), carbonyl oxygen of esters, anhydrides, amides, and oxygen atoms of phenol and alcohol or ether groups (C-O-C/O=C-O), oxygen of carboxylic groups (C-OH), and oxygen in water, respectively. As shown in Table 2, C=O and C-O-C/O=C-O account for 6.74% and 58.95% in 25%-ASHC. According to the literature [44], they have basicity, which is more conducive to the adsorption of the acid gas CO2.
2.1.5. XRD Analysis
The X-ray diffraction pattern of 25%-ASHC is shown in Figure 5. Sharp diffraction peaks can be observed, indicating the presence of large crystallite size for iron species (e.g., α-Fe2O3 (JCPDS No. 33-0664), γ-Fe2O3 (JCPDS No. 39-1346), Fe3O4 (JCPDS No. 19-0629)) [44]. Both Fe3O4 and γ-Fe2O3 have the very same cubic spinel crystal structure and similar d-spacing values, thus making it difficult to distinguish from each other by XRD patterns. The characteristic peaks with degrees of 17.26°, 26.39°, 35.07°, 50.62°, and 57.11° correspond to the (111), (220), (311), (422), and (511) plane of Fe3O4 and/or γ-Fe2O3, respectively. This is very different from the carbon materials we previously obtained via KOH activation. The peak with the degree of 24.60° corresponds to the (012) plane of α-Fe2O3, which may conceal the (002) plane diffraction peak of carbon material. The characteristic peaks with degrees of 39.36° and 43.42°correspond to the (100) and (101) plane of graphite, respectively, indicating that the activated carbon materials have a certain tendency to graphitize, which is conducive to improving the stability of carbon materials that is due to the catalytic graphitization of Fe-based components. We can also see the trend of graphitization in further RAM characterization.
2.1.6. RAM Analysis
The Raman spectra of 25%-ASHC is shown in Figure 6. The D band near 1345 cm−1 belongs to the A1g mode, corresponding to defective sites or disordered sp2 hybridized carbon atoms of graphite, which is usually used to reflect the degree of defects or crystallinity of the carbon material. The G band near 1630 cm−1 belongs to the E2g mode, which corresponds to the vibrating atoms in the phonon mode plane of the sp2-bonded carbon, reflecting the degree of graphitization of the carbon material. The intensity ratio of the D band to the G band, ID/IG = 1.36, indicates that 25%-ASHC has a certain trend of graphitization. However, compared with other activated carbons with higher degrees of graphitization (ID/IG < 1), it may also have an amorphous structure of disorganization due to the abundance of oxygen-containing functional groups (e.g., carboxyl groups) on the surface that are destructive to the graphite structure [45,46].
2.2. CO2 Adsorption Capacity
2.2.1. CO2 Uptake Capacity with Different Temperatures
The CO2 adsorption capacities of 0%-SHC and 25%-ASHC at 30, 45, 60 °C, and 1 bar are shown in Table 3, which are derived from the maximum adsorption amount at the end of adsorption in Figure 7. As we can see, 25%-ASHC showed higher CO2 adsorption capacities of 2.67 mmol·g−1, 2.17 mmol·g−1, and 1.70 mmol·g−1, which were all higher than 0%-SHC under the same conditions. This result indicated that the CO2 adsorption capacity of activated carbon can be significantly enhanced by the addition of activators with maximum CO2 adsorption capacities when the incorporation of K2FeO4 was 25wt%, which was primarily attributed to its highest specific surface area and biggest microporous volume. Though SH and all ASHCs have almost the same functional groups on the surface, further CO2 adsorption was limited by their lower porosity and smaller micropore volume as a consequence of too little or too much dosage of K2FeO4. This also indicates that the activation process greatly enhanced the CO2 physical adsorption. Additionally, the adsorption capacity of the samples was found to decrease with increasing temperature, as shown in Table 3. This is because both the surface energy and molecular diffusion of CO2 on the sample surface increased, making CO2 molecules easier to desorb while the temperature increased.
A comparison of the textural properties and adsorption performance with biomass-activated carbon prepared by other methods is shown in Table 4. It can be seen that the ASHC had a considerable CO2 adsorption capacity over other carbon materials. It shows that the synthesis of activated carbon by one-step method using K2FeO4 as a catalytic oxidative activator and SH as a precursor is an efficient method for the preparation of activated carbon.
2.2.2. Adsorption Kinetics with Different Temperatures
The CO2 adsorption curves of 25%-ASHC at 30, 45, and 60 °C are shown in Figure 7. The CO2 adsorption reached 50% of the equilibrium capacity within 1 min and 80% of the adsorption equilibrium within 6 min after the start of the CO2 gas flow, indicating a rapid rate of CO2 adsorption. Three kinetic models, namely pseudo-first-order model, pseudo-second-order model, and double exponential model, were used to further investigate the adsorption kinetics. The accuracy of these kinetic models in predicting the adsorption capacity was also assessed based on R2 (linear regression coefficient). As shown in Figure 7, the double exponential model had the best fitness for CO2 adsorption capacity of 25%-ASHC at 30 °C, 45 °C, and 60 °C due to its highest value of R2 (>99%), while other methods had values less than 95%; the relevant kinetic parameters are listed in Table 5. Thus, the double exponential kinetic model provided the best description over the entire adsorption process. It suggests that physical adsorption and chemical adsorption occur simultaneously [55]. This is also consistent with the previous BET, FTIR, and XPS test results; the pore structure and the abundant functional groups on its surface both contribute to the high carbon dioxide adsorption performance. According to the fitting results shown in Table 5, A1 was bigger than A2, which means that physical adsorption is stronger than chemical adsorption. At the same time, A1 decreased signifcantly and A2 only decreased by a small amount when the temperature increased. This is because at the first adsorption site, physical adsorption decreases significantly with an increase in temperature, while the physical adsorption is based on the Langmuir adsorption model. The lower the temperature, the greater the adsorption capacity, which is due to the Langmuir adsorption constant increasing with a decrease in temperature. Meanwhile, at the second adsorption site, chemical adsorption is not very dependent on temperature; its strength does not change much with an increase in temperature.
2.2.3. Adsorbent Regeneration
Five consecutive adsorption-resolution cycle curves of 25%-ASHC are shown in Figure 8. A slight increase in the maximum adsorption capacity was noticed in the fourth cycle, which can be explained by the redistribution of the products and regeneration during the cycle, which allowed the unreacted chemical sites to react in contact with the CO2 [56]. This phenomenon is stochastic in nature. In general, the adsorption capacity remained above 92% after five cycles, demonstrating that the adsorbent not only has good adsorption performance, but also has good regeneration performance and strong cyclic stability. Consequently, the prepared ASHCs have the potential to be reused several times in the CO2 capture process. Additionally, the regeneration could be achieved by temperature desorption at 130 °C for 10 min, making the process feasible and economical.
3. Materials and Methods
3.1. Materials
SH was collected from Wenzhou coastal area in Zhejiang Province, PR China. After series pretreatment procedures, including washing, drying, crushing and sieving, SH particles with a mean diameter of 40 mesh were provided for porous carbon preparation.
Potassium ferrate (K2FeO4, CAS 39469-86-8, AR, 99%) was purchased from Shanghai Macklin Biochemical Co. Ltd. (Shanghai, China). Hydrochloric acid (HCl, CAS 7641-01-0, 36.0 wt%) was purchased from Sinopharm Ltd. (Hangzhou, China). Nitrogen (N2 CAS 7727-37-9, 99.9%) and CO2 (CAS 124-38-999, 99%) gases were purchased from Hangzhou Special Gas Co., Ltd. (Hangzhou, China).
3.2. Preparation of Samples
Potassium ferrate and dried SH were mixed by continuously stirring in 10 mL water with different mass ratios and were impregnated for 1 h. The resulting mixture was dried at 105 °C for 12 h and then transferred to a crucible, followed by pyrolysis in a horizontal stainless tube furnace under 750 °C with a heating rate of 10 °C·min−1 for 1h. After cooling down, the product was carefully washed with water and then filtered until pH = 8. The generated carbon was again washed with dilute HCl (1 M, 20 mL, stirring with rotor for 3 h) to eliminate K species and other metal irons, and then it was ultrasonically washed with distilled water for 30 min before thorough washing with vacuum filtered until achieving a neutral pH level. Finally, the obtained samples were dried at 105 °C overnight. The resultant samples were denoted as m-ASHC, where m is the mass ratio of K2FeO4 to SH (they are 5%, 15%, 25%, 50%, and 100%, respectively); samples without added K2FeO4 but with pyrolysis under 750 °C were defined as 0%-SHC.
3.3. Characterization of Samples
The specific surface area and pore volume were determined using a fully automatic surface area analyzer (3H-2000PS1, BSD, Beijing, China), in which the specific surface area was evaluated with the BET method and determined in the partial pressure (P/P0) range 0.04–0.32, and total pore volume (Vtotal) was determined from the amount of nitrogen adsorbed at a relative pressure of 0.99. The micropore volumes (Vmicro) were calculated by t-plot analysis, and the pore size distributions were obtained according to the Brunauer–Emmet–Teller theory by using the NonLocal Density Functional Theory (NLDFT) method for accurate micropore filling mechanisms.
The morphologies and microstructures of the samples were characterized using the following facilities: a scanning electron microscope (SEM; Vega3, Tescan, Dortmund, Germany) operating at 5.0 kV and 15.0 kV; a transmission electron microscope (TEM; Tecnai G2 F30 S-Twin, Philips-FEI, Hillsboro, OR, USA) with an acceleration voltage of 300 kV; a Nicolet 6700 FTIR spectrometer averaging 24 scans in the 4000–400 cm−1 spectral range at 4 cm−1 resolution and a KBr pellet used as a reference sample; an X-ray photoelectron spectroscope (XPS; Thermo Scientific K-Alpha, Waltham, MA, USA) whose binding energies were standardized by the C 1 s peak at 284.8 eV; an X-ray diffraction spectrometer (X’Pert Pro, PANalytical, Almelo, The Netherlands) with Cu Kα radiation (λ = 1.5404 Å) over a 10–80° 2θ range and a position-sensitive detector with 0.05° step size at a scan rate of 1 °·min−1; a laser scanning confocal micro-Raman spectrometer (LabRAM HR, HORIBA, Palaiseau, France) with a laser excitation wavelength of 488 nm, scanning in an extended range of 0–4000 cm−1.
3.4. CO2 Adsorption Measurements
The CO2 adsorption performance of the carbon samples was measured using a thermogravimetric analyzer (TGA 209 F3 Tarsus, NETZSCH, Selb, Germany). Initially, about 10 mg of each sample was placed in an alumina crucible loaded in a TGA furnace. Prior to each adsorption experiment, the carbon sample was heated up to 130 °C (10 °C·min−1) and kept for 30 min to remove moisture under N2 flow (30 mL·min−1). Then, the carbon sample was cooled to a desired adsorption temperature, i.e., 30 °C, 45 °C, and 60 °C, then the CO2 adsorption studies were performed for 100 min with CO2 flow rate of 50 mL·min−1. Moreover, adsorbent regeneration was carried out by heating the sample to 130 °C for 30 min at 10 °C·min−1 under N2 flow (30 mL·min−1). To check the adsorbent stability, the adsorption–desorption procedure was repeated five times for 60 min/time at 30 °C with other conditions remaining the same.
3.5. CO2 Adsorption Kinetic Analysis
Three typical kinetic models, namely pseudo-first-order model, pseudo-second-order model, and double exponential model were studied in this research. The regression coefficient (R2) was verified according to the fitting degree of each theoretical model and the actual data. The highest regression coefficient indicates the most appropriate theoretical model, which can demonstrate the adsorption kinetic mechanism. The three models describe different adsorption mechanisms, respectively.
The pseudo-first order model is based on the assumption that the rate of adsorption is proportional to the primary of the number of possible adsorption sites, primarily used to describe the physical adsorption process. The equation can be expressed as follows:
where qe and qt denote the amount adsorbed at equilibrium and at a specific time t (mmol·g−1), respectively; t is the adsorption time (min), and k1 is the pseudo-primary adsorption rate constant (min−1). By applying the boundary conditions of qt = 0 at t = 0 and qt = qe at t = ∞, the integral form of the equation can be expressed as follows:
The pseudo-second-order model is based on the assumption that the rate of adsorption is proportional to the square of the number of possible adsorption sites, mainly used to describe the chemisorption processes. The equation can be expressed as follows:
where qe and qt denote the amount adsorbed at equilibrium and at a specific time t (mmol·g−1), respectively; t is the adsorption time (min), and k2 is the pseudo-secondary adsorption rate constant (g/(mmol·min)). By applying the boundary conditions of qt = 0 at t = 0 and qt = qe at t = ∞, the integral form of the equation can be expressed as follows:
The double exponential model is primarily used to describe adsorption processes where both physical and chemical adsorption coexist. The equation can be expressed as follows:
where qe and qt denote the amount adsorbed at equilibrium and at a specific time t (mmol·g−1), respectively; t is the adsorption time (min), and k3, k4 are the kinetic rate constants for physical adsorption and chemical adsorption of the CO2 (min−1), respectively; A1, A2 are similar to the amount of CO2 adsorbed at equilibrium after physical adsorption and chemical adsorption, respectively. This model is considered in this study because of its feasibility in explaining the adsorption kinetics for an adsorbent that possesses two different adsorption sites. This model also offers an advantage of explaining kinetic mechanisms which involve two steps, namely a rapid phase controlled by physical adsorption and a slow phase controlled by chemical adsorption. The major merit of this model is that it takes into account surface heterogeneity in a similar way to the Langmuir dual site.
4. Conclusions
In this study, porous carbon with high adsorption properties was prepared by one-step pyrolysis using SH as precursor and K2FeO4 as activator under 750 °C. The porous carbon could be obtained with a highest specific surface area of 1245 m2·g−1 and a highest CO2 adsorption capacity of 2.67 mmol·g−1 at 30 °C and 1 bar, with excellent cycling stability and easy regeneration when the mass ratio of K2FeO4 and SH was 25 wt%. Compared to our previous carbon dioxide adsorbent prepared by KOH activation, its performance in adsorption and regeneration were both enhanced with a faster rate, although the specific surface area was diminished. Meanwhile, this work replaced abundant KOH with less K2FeO4, making the reaction more efficient and economical. The contribution of the “trinity” activation of K2FeO4 can be divided into three aspects: (1) activator: synergizing with the metal ions contained in SH, such as K, Ca, Na, etc., to promote the formation of pore structure; (2) oxidant: using the strong oxidative property of Fe(VI), the porous carbon surface forms oxygen-containing functional groups, which improves the adsorption performance of CO2; (3) catalyst: playing the role of catalytic acceleration so that the reaction can be carried out rapidly at lower temperatures to reduce the preparation time and energy consumption, which is conducive to the large-scale production of products. In general, using K2FeO4 oxidative pyrolysis SH proved to be an efficient way to prepare adsorbent for CO2 capture. This simple and cost-effective carbon synthesis route is beneficial to the large-scale preparation of CO2 adsorbent in dealing with the problem of the greenhouse effect. It can also turn waste golden tide into treasure in order to promote the development of the ecological restoration industry for macroalgae.
Supplementary Materials
The following supporting information can be downloaded at: https://www.mdpi.com/article/10.3390/molecules29061345/s1, Figure S1: SEM image of (a) 15%-ASHC; (b) 50%-ASHC; Figure S2. XPS spectrum of 25%-ASHC.
Author Contributions
Conceptualization, N.A. and H.Y.; methodology, G.Z. and H.Y.; validation, H.Y. and G.Z.; formal analysis, C.J., H.Y. and G.Z.; resources, N.A.; data curation, C.J. and H.Y.; writing—original draft preparation, C.J. and H.Y.; supervision, N.A.; project administration, N.A. All authors have read and agreed to the published version of the manuscript.
Funding
This work was supported by the National Natural Science Foundation of China (grant no. 21628601).
Data Availability Statement
The data used to support the findings of this study are included within the article.
Conflicts of Interest
The authors declare no conflicts of interest.
References
- Smetacek, V.; Zingone, A. Green and Golden Seaweed Tides on the Rise. Nature 2013, 504, 84–88. [Google Scholar] [CrossRef] [PubMed]
- Rodríguez-Martínez, R.E.; Medina-Valmaseda, A.E.; Blanchon, P.; Monroy-Velázquez, L.V.; Almazán-Becerril, A.; Delgado-Pech, B.; Vásquez-Yeomans, L.; Francisco, V.; García-Rivas, M.C. Faunal Mortality Associated with Massive Beaching and Decomposition of Pelagic Sargassum. Mar. Pollut. Bull. 2019, 146, 201–205. [Google Scholar] [CrossRef] [PubMed]
- Wang, M.; Hu, C.; Barnes, B.B.; Mitchum, G.; Lapointe, B.; Montoya, J.P. The Great Atlantic Sargassum Belt. Science 2019, 365, 83–87. [Google Scholar] [CrossRef] [PubMed]
- Hwang, E.K.; Lee, S.; Ha, D.; Park, C. Sargassum Golden Tides in the Shinan-Gun and Jeju Island, Korea. Korean J. Fish. Aquat. Sci. 2016, 49, 689–693. [Google Scholar] [CrossRef]
- Lapointe, B.; Burkholder, J.; Van Alstyne, K. Harmful Macroalgal Blooms in a Changing World: Causes, Impacts, and Management. In Harmful Algal Blooms: A Compendium Desk Reference; Wiley: Hoboken, NJ, USA, 2018; pp. 515–560. ISBN 978-1-118-99465-8. [Google Scholar]
- Resiere, D.; Kallel, H.; Florentin, J.; Banydeen, R.; Compton, K.; Gueye, P.; Mehdaoui, H.; Neviere, R. Sargassum Seaweed in the Caribbean: A Major Public Health Problem Still Unsolved. J. Glob. Health 2023, 13, 03017. [Google Scholar] [CrossRef] [PubMed]
- Xing, Q.; Guo, R.; Wu, L.; An, D.; Cong, M.; Qin, S.; Li, X. High-Resolution Satellite Observations of a New Hazard of Golden Tides Caused by Floating Sargassum in Winter in the Yellow Sea. IEEE Geosci. Remote Sens. Lett. 2017, 14, 1815–1819. [Google Scholar] [CrossRef]
- Su, L.; Shan, T.; Pang, S.; Jing, L. Analyses of the Genetic Structure of Sargassum Horneri in the Yellow Sea: Implications of the Temporal and Spatial Relations among Floating and Benthic Populations. J. Appl. Phycol. 2018, 30, 1417–1424. [Google Scholar] [CrossRef]
- Qi, L.; Hu, C.; Wang, M.; Shang, S.; Wilson, C. Floating Algae Blooms in the East China Sea. Geophys. Res. Lett. 2017, 44, 11,501–11,509. [Google Scholar] [CrossRef]
- Liu, F.; Liu, X.; Wang, Y.; Jin, Z.; Moejes, F.; Sun, S. Insights on the Sargassum Horneri Golden Tides in the Yellow Sea Inferred from Morphological and Molecular Data. Limnol. Oceanogr. 2018, 63, 1762–1773. [Google Scholar] [CrossRef]
- Qi, L.; Hu, C.; Barnes, B.; Lapointe, B.; Chen, Y.; Xie, Y.; Wang, M. Climate and Anthropogenic Controls of Seaweed Expansions in the East China Sea and Yellow Sea. Geophys. Res. Lett. 2022, 49, e2022GL098185. [Google Scholar] [CrossRef]
- Fidai, Y.A.; Machado, C.B.; Almela, V.D.; Oxenford, H.A.; Jayson-Quashigah, P.-N.; Tonon, T.; Dash, J. Innovative Spectral Characterisation of Beached Pelagic Sargassum towards Remote Estimation of Biochemical and Phenotypic Properties. Sci. Total Environ. 2024, 914, 169789. [Google Scholar] [CrossRef]
- Mincer, T.J.; Bos, R.P.; Zettler, E.R.; Zhao, S.; Asbun, A.A.; Orsi, W.D.; Guzzetta, V.S.; Amaral-Zettler, L.A. Sargasso Sea Vibrio Bacteria: Underexplored Potential Pathovars in a Perturbed Habitat. Water Res. 2023, 242, 120033. [Google Scholar] [CrossRef]
- Fang, R.-E.; Wei, Y.-J.; Fang, S.-Y.; Huang, C.-H. Effects of Sargassum-Derived Oligosaccharides, Polysaccharides and Residues on Ameliorating Enteritis and Dysbiosis in a Murine Model of Food Allergy. J. Funct. Foods 2023, 110, 105844. [Google Scholar] [CrossRef]
- Kar, T.; González-Escobar, C.; Ramos-Hernández, J.J.; Casales-Díaz, M.; Flores-Rodríguez, M.F.; Pérez, R.; Kesarla, M.K. A Comprehensive Analysis of Sargassum Natans-Derived Inorganic Carbon Composite for Electrochemical Charge Storage. J. Energy Storage 2024, 82, 110600. [Google Scholar] [CrossRef]
- Rekha, A.; Srinivasan, L.; Pavithra, S.; Gomathi, T.; Sudha, P.N.; Lavanya, G.; Arumugam, N.; Vidhya, A. Biosorption Efficacy Studies of Sargassum Wightii and Its Biochar on the Removal of Chromium from Aqueous Solution. J. Taiwan Inst. Chem. Eng. 2023, 105241. [Google Scholar] [CrossRef]
- Saldarriaga-Hernández, S.; Hernández-Vargas, G.; Iqbal, H.; Barceló, D.; Parra, R. Bioremediation Potential of Sargassum Sp. Biomass to Tackle Pollution in Coastal Ecosystems: Circular Economy Approach. Sci. Total Environ. 2020, 715, 136978. [Google Scholar] [CrossRef]
- Santos, S.; Ungureanu, G.; Volf, I.; Boaventura, R.; Botelho, C. Macroalgae Biomass as Sorbent for Metal Ions. In Biomass as Renewable Raw Material to Obtain Bioproducts of High-Tech Value; Elsevier: Amsterdam, The Netherlands, 2018; pp. 69–112. ISBN 978-0-444-63774-1. [Google Scholar]
- González Fernández, L.A.; Navarro Frómeta, A.E.; Carranza Álvarez, C.; Flores Ramírez, R.; Díaz Flores, P.E.; Castillo Ramos, V.; Sánchez Polo, M.; Carrasco Marín, F.; Medellín Castillo, N.A. Valorization of Sargassum Biomass as Potential Material for the Remediation of Heavy-Metals-Contaminated Waters. Int. J. Environ. Res. Public Health 2023, 20, 2559. [Google Scholar] [CrossRef] [PubMed]
- Jafarian, S.; Bolouk, A.M.L.; Norouzian, R.; Taghavi, S.; Mousavi, F.; Kianpour, E.; Signoretto, M. Sargassum Macro-Algae-Derived Activated Bio-Char as a Sustainable and Cost-Effective Adsorbent for Cationic Dyes: A Joint Experimental and DFT Study. Colloids Surf. A Physicochem. Eng. Asp. 2023, 678, 132397. [Google Scholar] [CrossRef]
- Ding, S.; Liu, Y. Adsorption of CO2 from Flue Gas by Novel Seaweed-Based KOH-Activated Porous Biochars. Fuel 2020, 260, 116382. [Google Scholar] [CrossRef]
- Ying, H.; Zeng, G.; He, Y.; Hou, Y.; Ai, N. Enhanced Assembling of N-and-K-Riched Macroalgae as Carbon Adsorbent for CO2 Capture with Ni(NO3)2/KOH as Co-Catalysts. Molecules 2023, 28, 6242. [Google Scholar] [CrossRef] [PubMed]
- Sharma, V.K. Potassium Ferrate(VI): An Environmentally Friendly Oxidant. Adv. Environ. Res. 2002, 6, 143–156. [Google Scholar] [CrossRef]
- Dong, D.; Xiao, Y.; Xing, J. Facile Wet Mechanochemistry Coupled K2FeO4 Activation to Prepare Functional Coal-Derived Hierarchical Porous Carbon for Supercapacitors. J. Clean. Prod. 2023, 428, 139474. [Google Scholar] [CrossRef]
- Cheng, A.; Wang, X.; Liu, X.; He, C. Wet-Process-Modified Blue-Green Algae Biochar by K2FeO4 for the Efficient Adsorption of Cr(VI) from Water. Processes 2023, 11, 1489. [Google Scholar] [CrossRef]
- Pei, T.; Shi, F.; Liu, C.; Lu, Y.; Lin, X.; Hou, D.; Yang, S.; Li, J.; Zheng, Z.; Zheng, Y. Bamboo-Derived Nitrogen-Doping Magnetic Porous Hydrochar Coactivated by K2FeO4 and CaCO3 for Phenol Removal: Governing Factors and Mechanisms. Environ. Pollut. 2023, 331, 121871. [Google Scholar] [CrossRef] [PubMed]
- He, Y.; Ni, L.; Gao, Q.; Ren, H.; Su, M.; Hou, Y.; Liu, Z. Activated Carbon with Ultrahigh Specific Surface Derived from Bamboo Shoot Shell through K2FeO4 Oxidative Pyrolysis for Adsorption of Methylene Blue. Molecules 2023, 28, 3410. [Google Scholar] [CrossRef]
- Gong, Y.; Li, D.; Luo, C.; Fu, Q.; Pan, C. Highly Porous Graphitic Biomass Carbon as Advanced Electrode Materials for Supercapacitors. Green Chem. 2017, 19, 4132–4140. [Google Scholar] [CrossRef]
- Ai, N.; Lou, S.; Lou, F.; Xu, C.; Wang, Q.; Zeng, G. Facile Synthesis of Macroalgae-Derived Graphene Adsorbents for Efficient CO2 Capture. Process Saf. Environ. Prot. 2021, 148, 1048–1059. [Google Scholar] [CrossRef]
- Zeng, G.; Lou, S.; Lou, F.; Du, M.; Luo, H.; Ai, N. Insights into Forming Behavior and CO2 Adsorption Properties of Graphene from Sargassum Horneri by Fe(NO3)3/KOH Activation. J. Chem. Technol. Biotechnol. 2022, 97, 2844–2851. [Google Scholar] [CrossRef]
- Thommes, M.; Kaneko, K.; Neimark, A.V.; Olivier, J.P.; Rodriguez-Reinoso, F.; Rouquerol, J.; Sing, K.S.W. Physisorption of Gases, with Special Reference to the Evaluation of Surface Area and Pore Size Distribution (IUPAC Technical Report). Pure Appl. Chem. 2015, 87, 1051–1069. [Google Scholar] [CrossRef]
- de Souza, L.K.C.; Wickramaratne, N.P.; Ello, A.S.; Costa, M.J.F.; da Costa, C.E.F.; Jaroniec, M. Enhancement of CO2 Adsorption on Phenolic Resin-Based Mesoporous Carbons by KOH Activation. Carbon 2013, 65, 334–340. [Google Scholar] [CrossRef]
- Zhao, L.; Fan, L.-Z.; Zhou, M.-Q.; Guan, H.; Qiao, S.; Antonietti, M.; Titirici, M.-M. Nitrogen-Containing Hydrothermal Carbons with Superior Performance in Supercapacitors. Adv. Mater. 2010, 22, 5202–5206. [Google Scholar] [CrossRef]
- Shi, S.; Liu, Y. Nitrogen-Doped Activated Carbons Derived from Microalgae Pyrolysis by-Products by Microwave/KOH Activation for CO2 Adsorption. Fuel 2021, 306, 121762. [Google Scholar] [CrossRef]
- Wang, J.; Kaskel, S. KOH Activation of Carbon-Based Materials for Energy Storage. J. Mater. Chem. 2012, 22, 23710–23725. [Google Scholar] [CrossRef]
- Romanos, J.; Beckner, M.; Rash, T.; Firlej, L.; Kuchta, B.; Yu, P.; Suppes, G.; Wexler, C.; Pfeifer, P. Nanospace Engineering of KOH Activated Carbon. Nanotechnology 2011, 23, 015401. [Google Scholar] [CrossRef] [PubMed]
- Liu, W.-J.; Tian, K.; He, Y.-R.; Jiang, H.; Yu, H.-Q. High-Yield Harvest of Nanofibers/Mesoporous Carbon Composite by Pyrolysis of Waste Biomass and Its Application for High Durability Electrochemical Energy Storage. Environ. Sci. Technol. 2014, 48, 13951–13959. [Google Scholar] [CrossRef] [PubMed]
- Da, Y.; Xu, M.; Ma, J.; Gao, P.; Zhang, X.; Yang, G.; Wu, J.; Song, C.; Long, L.; Chen, C. Remediation of Cadmium Contaminated Soil Using K2FeO4 Modified Vinasse Biochar. Ecotoxicol. Environ. Saf. 2023, 262, 115171. [Google Scholar] [CrossRef]
- Yuan, H.; Chen, J.; Li, D.; Chen, H.; Chen, Y. 5 Ultramicropore-Rich Renewable Porous Carbon from Biomass Tar with Excellent Adsorption Capacity and Selectivity for CO2 Capture. Chem. Eng. J. 2019, 373, 171–178. [Google Scholar] [CrossRef]
- Hong, S.-M.; Yoon, H.J.; Choi, Y.; Cho, Y.-Z.; Mun, S.; Pol, V.G.; Lee, K.B. Solving Two Environmental Problems Simultaneously: Scalable Production of Carbon Microsheets from Structured Packing Peanuts with Tailored Microporosity for Efficient CO2 Capture. Chem. Eng. J. 2020, 379, 122219. [Google Scholar] [CrossRef]
- Li, J.; Zhu, Y.; Wang, C.; Wei, W.; Liu, Z.; Tian, Y.; Zong, P.; Qiao, Y.; Qin, S. Golden Seaweed Tides from Beach Inundations as a Valuable Sustainable Fuel Resource: Fast Pyrolysis Characteristics, Product Distribution and Pathway Study on Sargassum Horneri Based on Model Compounds. Algal Res. 2020, 48, 101888. [Google Scholar] [CrossRef]
- Tiwari, D.; Goel, C.; Bhunia, H.; Bajpai, P.K. Melamine-Formaldehyde Derived Porous Carbons for Adsorption of CO2 Capture. J. Environ. Manag. 2017, 197, 415–427. [Google Scholar] [CrossRef]
- Tiwari, D.; Bhunia, H.; Bajpai, P.K. Adsorption of CO2 on KOH Activated, N-Enriched Carbon Derived from Urea Formaldehyde Resin: Kinetics, Isotherm and Thermodynamic Studies. Appl. Surf. Sci. 2018, 439, 760–771. [Google Scholar] [CrossRef]
- Lahuri, A.H. Comparative Studies on Adsorption Isotherm and Kinetic for CO2 Capture Using Iron Oxide Impregnated Activated Carbon. Catal. Today 2023, 418, 114111. [Google Scholar] [CrossRef]
- Chen, J.; Zhang, Y.; Zhang, M.; Yao, B.; Li, Y.; Huang, L.; Li, C.; Shi, G. Water-Enhanced Oxidation of Graphite to Graphene Oxide with Controlled Species of Oxygenated Groups. Chem. Sci. 2016, 7, 1874–1881. [Google Scholar] [CrossRef]
- Kumar, S.; Baruah, B.; Kumar, A. Tunable Degree of Oxidation through Variation of H2O2 Concentration and Its Effect on Structural, Optical and Supercapacitive Properties of Graphene Oxide Powders Synthesized Using Improved Method. Mater. Today Commun. 2017, 13, 26–35. [Google Scholar] [CrossRef]
- Phadungbut, P.; Koo-amornpattana, W.; Bumroongsri, P.; Ratchahat, S.; Kunthakudee, N.; Jonglertjunya, W.; Chalermsinsuwan, B.; Hunsom, M. Adsorptive Purification of CO2/H2 Gas Mixtures of Spent Disposable Wooden Chopstick-Derived Activated Carbon: Optimal Synthesis Condition. Sep. Purif. Technol. 2022, 291, 120948. [Google Scholar] [CrossRef]
- Liu, X.; Sun, C.; Liu, H.; Tan, W.H.; Wang, W.; Snape, C. Developing Hierarchically Ultra-Micro/Mesoporous Biocarbons for Highly Selective Carbon Dioxide Adsorption. Chem. Eng. J. 2019, 361, 199–208. [Google Scholar] [CrossRef]
- Singh, M.G.; Lakhi, K.S.; Park, D.-H.; Srivastava, P.; Naidu, R.; Vinu, A. Facile One-Pot Synthesis of Activated Porous Biocarbons with a High Nitrogen Content for CO2 Capture. ChemNanoMat 2018, 4, 281–290. [Google Scholar] [CrossRef]
- Alazmi, A.; Nicolae, S.A.; Modugno, P.; Hasanov, B.E.; Titirici, M.M.; Costa, P.M.F.J. Activated Carbon from Palm Date Seeds for CO2 Capture. Int. J. Environ. Res. Public Health 2021, 18, 12142. [Google Scholar] [CrossRef] [PubMed]
- Lahijani, P.; Mohammadi, M.; Mohamed, A.R. Metal Incorporated Biochar as a Potential Adsorbent for High Capacity CO2 Capture at Ambient Condition. J. CO2 Util. 2018, 26, 281–293. [Google Scholar] [CrossRef]
- Vargas, D.P.; Giraldo, L.; Silvestre-Albero, J.; Moreno-Piraján, J.C. CO2 Adsorption on Binderless Activated Carbon Monoliths. Adsorption 2011, 17, 497–504. [Google Scholar] [CrossRef]
- Boonpoke, A.; Chiarakorn, S.; Laosiripojana, N.; Towprayoon, S.; Chidthaisong, A. Synthesis of Activated Carbon and MCM-41 from Bagasse and Rice Husk and Their Carbon Dioxide Adsorption Capacity. J. Sustain. Energy Environ. 2011, 2, 77–81. [Google Scholar]
- Isahak, W.N.R.W.; Hasan, S.Z.; Ramli, Z.A.C.; Ba-Abbad, M.M.; Yarmo, M.A. Enhanced Physical and Chemical Adsorption of Carbon Dioxide Using Bimetallic Copper–Magnesium Oxide/Carbon Nanocomposite. Res. Chem. Intermed. 2018, 44, 829–841. [Google Scholar] [CrossRef]
- Loganathan, S.; Tikmani, M.; Mishra, A.; Ghoshal, A. Amine Tethered Pore-Expanded MCM-41 for CO2 Capture: Experimental, Isotherm and Kinetic Modeling Studies. Chem. Eng. J. 2016, 303, 89–99. [Google Scholar] [CrossRef]
- Wang, Z.; Sun, C.; Xu, Q.; Zou, X.; Cheng, H.; Lu, X. In Situ XRD, Raman Characterization, and Kinetic Study of CO2 Capture by Alkali Carbonate-Doped Na4SiO4. Separations 2022, 9, 428. [Google Scholar] [CrossRef]
Figure 1.
(a) N2 adsorption–desorption isotherms of samples; (b) corresponding pore size distribution of samples.
Figure 1.
(a) N2 adsorption–desorption isotherms of samples; (b) corresponding pore size distribution of samples.

Figure 2.
(a) SEM image of 25%−ASHC; (b) TEM image of 25%−ASHC.

Figure 3.
FTIR spectra of SHC and ASHCs.

Figure 4.
XPS patterns of 25%-ASHC (a).C1s spectrum; (b) N1s spectrum; (c) O1s spectrum.

Figure 5.
XRD pattern of 25%−ASHC.

Figure 6.
Raman spectra of 25%−ASHC.

Figure 7.
Experimental- and model-predicted values of CO2 adsorption of 25%−ASHC at (a) 30 °C; (b) 45 °C; (c) 60 °C.
Figure 7.
Experimental- and model-predicted values of CO2 adsorption of 25%−ASHC at (a) 30 °C; (b) 45 °C; (c) 60 °C.

Figure 8.
CO2 adsorption−desorption cycle curves of 25%−ASHC.


Table 1.
Textural properties of samples.
| Adsorbents | Surface Area | Pore Volume | Average Pore Diameter (nm) | Microporous Average Pore Diameter (nm) | ||
|---|---|---|---|---|---|---|
| SBET (m2·g−1) | Vtotal (cm3·g−1) | Vmicro (cm3·g−1) | Vmicro /Vtolal | |||
| 0%-SHC | 30.3827 | 0.0446 | 0.0133 | 0.2982 | 5.8718 | 1.2198 |
| 5%-ASHC | 297.1456 | 0.2046 | 0.1049 | 0.5127 | 2.7542 | 0.6864 |
| 15%-ASHC | 417.9733 | 0.3352 | 0.1539 | 0.4591 | 3.2079 | 0.6570 |
| 25%-ASHC | 1245.0812 | 0.8827 | 0.5682 | 0.6437 | 2.8358 | 0.7266 |
| 50%-ASHC | 730.5373 | 0.6926 | 0.3284 | 0.4742 | 3.7923 | 0.7994 |
| 100%-ASHC | 586.6224 | 0.4702 | 0.2379 | 0.5060 | 3.2062 | 0.7480 |
Table 2.
Peak area ratios of O 1 s.
| Sample | C=O | C-O-C/O=C-O | C-OH | H2O-O2 |
|---|---|---|---|---|
| 25%-ASHC | 6.74 | 58.98 | 28.51 | 5.77 |
Table 3.
CO2 adsorption capacity of samples at different adsorption temperatures.
| Samples | CO2 Adsorption Capacity (mmol·g−1) | ||
|---|---|---|---|
| 30 °C | 45 °C | 60 °C | |
| 0%-SHC | 0.94 | 0.78 | 0.63 |
| 25%-ASHC | 2.67 | 2.17 | 1.70 |
Table 4.
Comparison of textural properties and CO2 adsorption performance.
| Feedstock | Activation | SBET (m2·g−1) | Vtotal (cm3·g−1) | Vmicro (cm3·g−1) | CO2 Uptakes (mmol·g−1) | Ref. | |
|---|---|---|---|---|---|---|---|
| 25 °C/1 bar | 30 °C/1 bar | ||||||
| Wooden chopstick | KOH | N/A | N/A | N/A | 2.63 | N/A | [47] |
| Dried rice husk | KOH/PEI | 1190 | 0.777 | 0.422 | 1.90 | N/A | [48] |
| Arundo donax | KOH/ZnCl2 | 982 | 0.62 | N/A | 2.20 | N/A | [49] |
| Palm date seeds | H3PO4 | 1439 | 0.60 | N/A | 4.40 | N/A | [50] |
| Walnut shell | Mg(NO3)2 | 292 | 0.157 | 0.118 | 1.86 | N/A | [51] |
| Coconut | H3PO4 | 1322 | 0.61 | 0.49 | N/A | 3.7 | [52] |
| Rice husk | ZnCl2/HCl | 927 | 0.56 | N/A | N/A | 1.3 | [53] |
| Nypha fruticans | Mg(NO3)2/Cu(NO3)2 | 727.7 | 0.50 | 0.26 | N/A | 1.91 | [54] |
| Sargassum horneri | K2FeO4 | 1245 | 0.8827 | 0.5682 | N/A | 2.67 | This work |
Table 5.
The kinetic parameters of CO2 adsorption of 25%-ASHC.
| Kinetic Models | Parameters | Adsorption Temperatures | ||
|---|---|---|---|---|
| 30 °C | 45 °C | 60 °C | ||
| Pseudo-first-order | qm,exp (mmol·g−1) | 2.67 | 2.17 | 1.70 |
| qe,cal (mmol·g−1) | 2.51 | 2.04 | 1.58 | |
| k1 (min−1) | 0.3549 | 0.3668 | 0.4229 | |
| R2 | 0.8499 | 0.8029 | 0.8190 | |
| E% | 2.87 | 2.66 | 1.90 | |
| Pseudo-second-order | qe,cal (mmol·g−1) | 2.63 | 2.14 | 1.65 |
| k2 (g/(mg·min)) | 0.2092 | 0.2577 | 0.3860 | |
| R2 | 0.9453 | 0.9283 | 0.9287 | |
| E% | 2.63 | 5.68 | 1.57 | |
| qe,cal (mmol·g−1) | 2.78 | 2.25 | 1.80 | |
| Double Exponential | A1 | 2.1343 | 1.6579 | 1.3535 |
| k3 | 0.6026 | 0.7312 | 0.7211 | |
| A2 | 0.6903 | 0.6208 | 0.4737 | |
| k4 | 0.0197 | 0.0227 | 0.0157 | |
| R2 | 0.9913 | 0.9905 | 0.9920 | |
| E% | 1.60 | 3.58 | 4.47 | |
Disclaimer/Publisher’s Note: The statements, opinions and data contained in all publications are solely those of the individual author(s) and contributor(s) and not of MDPI and/or the editor(s). MDPI and/or the editor(s) disclaim responsibility for any injury to people or property resulting from any ideas, methods, instructions or products referred to in the content. |
© 2024 by the authors. Licensee MDPI, Basel, Switzerland. This article is an open access article distributed under the terms and conditions of the Creative Commons Attribution (CC BY) license (https://creativecommons.org/licenses/by/4.0/).
Share and Cite
MDPI and ACS Style
Ying, H.; Jia, C.; Zeng, G.; Ai, N. Turn Waste Golden Tide into Treasure: Bio-Adsorbent Synthesis for CO2 Capture with K2FeO4 as Catalytic Oxidative Activator. Molecules 2024, 29, 1345. https://doi.org/10.3390/molecules29061345
AMA Style
Ying H, Jia C, Zeng G, Ai N. Turn Waste Golden Tide into Treasure: Bio-Adsorbent Synthesis for CO2 Capture with K2FeO4 as Catalytic Oxidative Activator. Molecules. 2024; 29(6):1345. https://doi.org/10.3390/molecules29061345
Chicago/Turabian StyleYing, Huijuan, Chenglin Jia, Ganning Zeng, and Ning Ai. 2024. "Turn Waste Golden Tide into Treasure: Bio-Adsorbent Synthesis for CO2 Capture with K2FeO4 as Catalytic Oxidative Activator" Molecules 29, no. 6: 1345. https://doi.org/10.3390/molecules29061345