Article

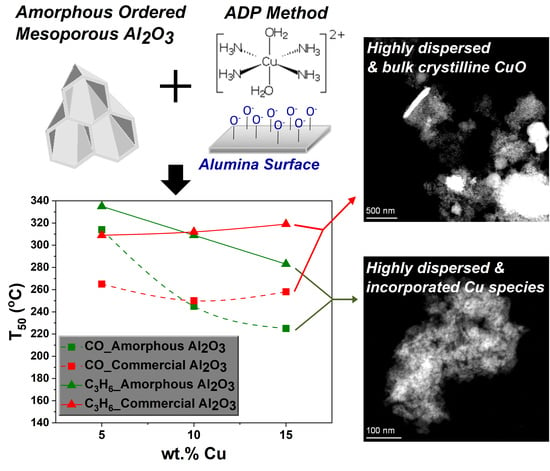
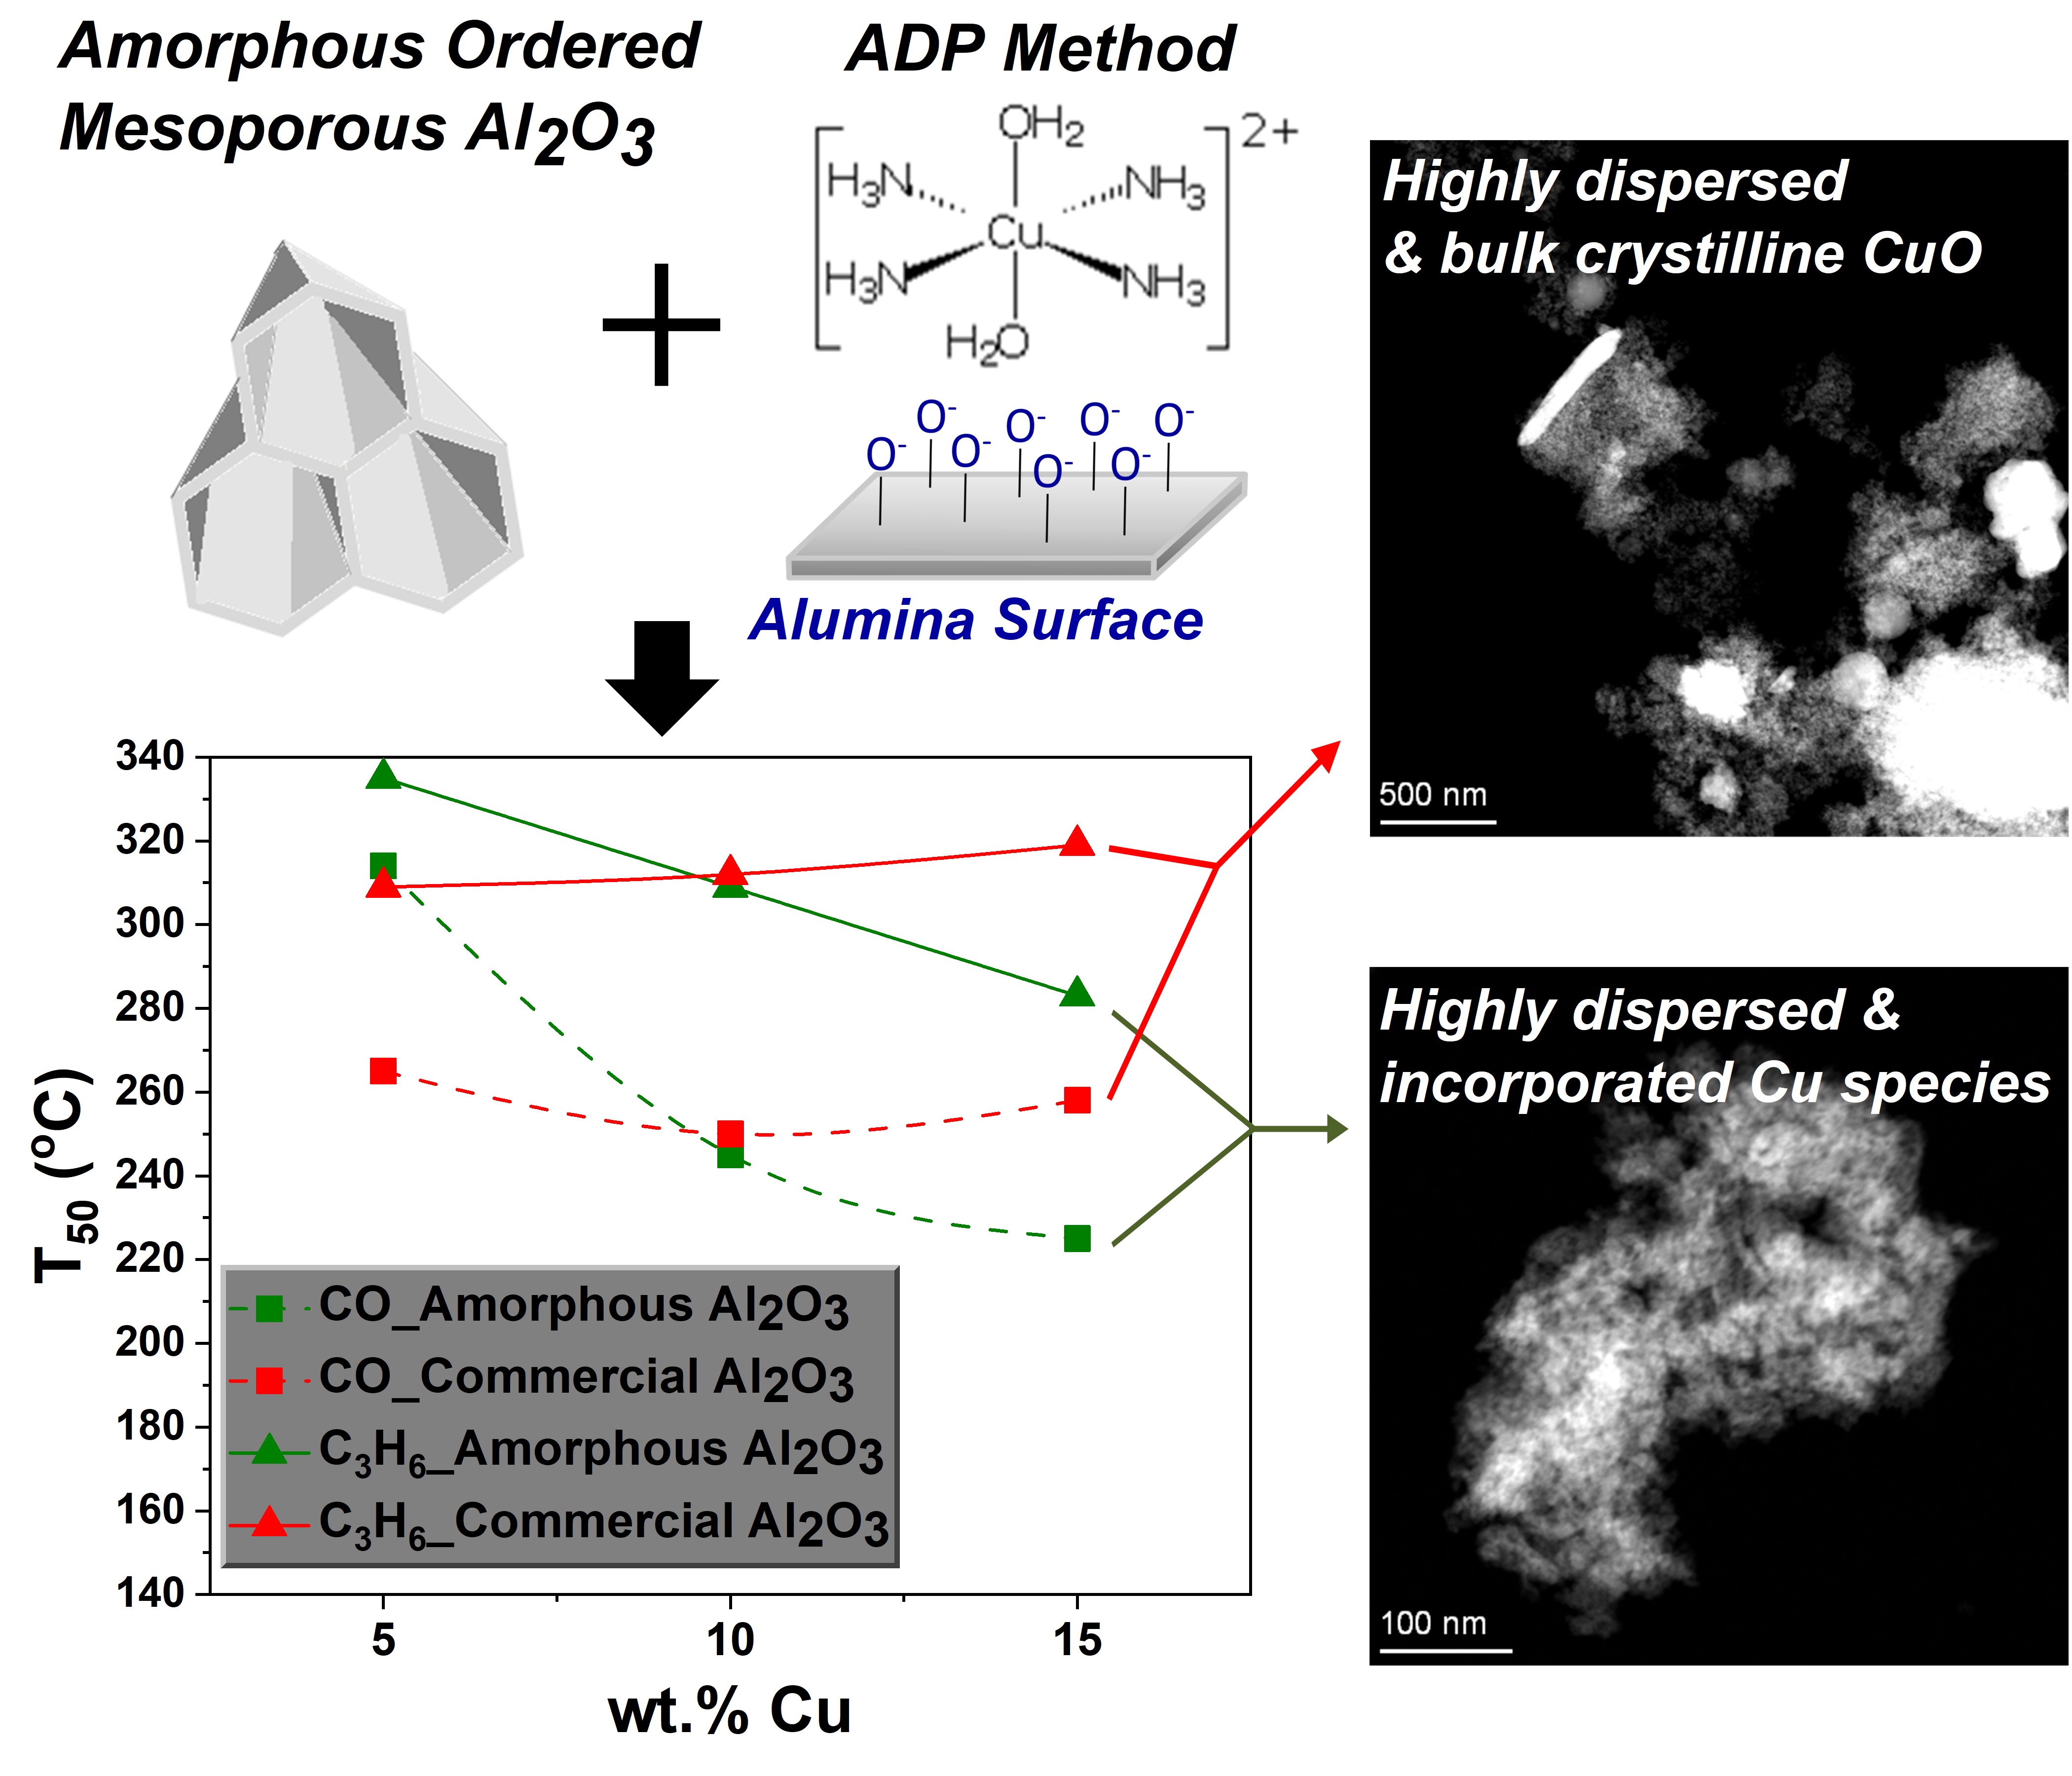
Towards Highly Loaded and Finely Dispersed CuO Catalysts via ADP: Effect of the Alumina Support

by
Tim Van Everbroeck
1,
Aggeliki Papavasiliou
2,*,
Radu-George Ciocarlan
1,
Evangelos Poulakis
3,
Constantine J. Philippopoulos
3,
Erika O. Jardim
4,
Joaquin Silvestre-Albero
4,
Elias Sakellis
2,
Pegie Cool
1 and
Fotios K. Katsaros
2
1
Laboratory of Adsorption & Catalysis, Department of Chemistry, University of Antwerp, Universiteitsplein 1, 2610 Wilrijk, Belgium
2
Institute of Nanoscience and Nanotechnology, National Center for Scientific Research Demokritos, Aghia Paraskevi, 153 10 Athens, Greece
3
Chemical Process Engineering Laboratory, Department of Chemical Engineering, National Technical University of Athens, 9 Heroon Polytechniou Street, Zografos Camphs, 157 80 Athens, Greece
4
Laboratorio de Materiales Avanzados, Departamento de Química Inorgánica, Instituto Universitario de Materiales, Universidad de Alicante, E-03690 San Vicente del Raspeig, Spain
*
Author to whom correspondence should be addressed.
Catalysts 2022, 12(6), 628; https://doi.org/10.3390/catal12060628
Submission received: 24 May 2022 / Revised: 3 June 2022 / Accepted: 6 June 2022 / Published: 8 June 2022
(This article belongs to the Special Issue Advances in Transition Metal Catalysis)

Abstract

:
To meet current economic demands enforcing the replacement of platinum-group metals, extensively used in three-way-catalytic converters (TWC), research is driven towards low-cost and widely available base metals. However, to cope with their lower activity, high metal loadings must be coupled with increased dispersion. Herein, a series of CuO/Al2O3 samples is produced and the effect of different alumina supports’ properties on CuO dispersion, speciation and eventually on the TWC performance is studied. The alumina samples are synthesized via different methods, including soft-templating routes and flame spray pyrolysis, and compared with a commercial one, while CuO used as the catalytic active phase is added through ammonia-driven deposition–precipitation. As found, the large surface area and low crystallinity of the aluminas produced by soft-templating routes favor strong metal–support interaction, generating highly dispersed and strongly bonded CuO species at low loading and copper-aluminate phases at high loading. Notably, the use of amorphous mesoporous alumina completely prevents the formation of crystalline CuO even at 15 wt% Cu. Such high metal loading and dispersion capacity without the application of elevated calcination temperatures is one of the best reported for nonreducible supports. Catalytic evaluation of this material reveals a pronounced enhancement of oxidation activity with metal loading increase.

Graphical Abstract

1. Introduction

Nowadays, the extensive use of Platinum Group Metals (PGMs), originating from the increasing number of gasoline-fuelled automobiles and the decreasing emission limits, coupled with their relatively high prices and limited supply intensify the need for their substitution by low-cost abundant transition metals [1]. Research efforts have been devoted since the early days of the catalytic converter to the use of base metals (nickel, copper, iron, cobalt, etc.). While some of these candidates seemed very attractive, the main complications related to the (i) poisoning by sulfur and lead present in the fuel, (ii) lower catalytic activity compared to PGMs and (iii) thermal durability [1]. In the past years, regulations set the cap for sulfur in gasoline fuels at 30 ppm (Tier 2 Motor Vehicle Emission and Fuel Standards), while starting from 2020, this will be further reduced to 10 ppm (Tier 3 Motor Vehicle Emission and Fuel Standards) [2,3]. In addition, considering that the use of lead additives in automotive fuels is almost completely restricted, the main concern for using base metals as the main catalytic components is now directed to their lower intrinsic activity and thermal stability [4].
Copper-containing catalytic systems are considered an appealing solution for the development of low-cost PGM-free catalytic formulations given their high activity in various reactions including oxidation of CO, HCs and soot, as well as selective catalytic reduction of NO by CO, hydrocarbons or NH3 [5,6,7,8,9,10,11,12,13,14,15,16,17]. However, in order to achieve performances comparable to PGM-based systems, high metal loadings combined with a finely dispersed state are required. Another challenging task concerns the stabilization of the active copper phases during exposure at operating conditions or at elevated temperatures. Evidently, the employed metal deposition method as well as the type of the oxide support play an essential role in this direction by strengthening metal–support interactions and hence suppressing aggregation and particle growth [10,18,19,20,21,22,23].
The ammonia-driven deposition–precipitation (ADP) method is a highly efficient method in terms of simplicity and metal dispersion [19,20]. Its key principle relies on the use of ammonia forming a complex with Cu2+ ions in an aqueous solution. In this manner, the necessary steric hindrance, to prevent close proximity among the metal atoms during deposition, is provided. In addition, ammonia raises the solution’s pH above the point of zero charge of the support material, initiating a strong electrostatic interaction between the negatively charged surface groups of the support and the positively charged [Cu(NH3)4]2+ complex. Consequently, sintering phenomena upon thermal activation resulting in the formation of bulk CuO are notably restricted [20].
On the other hand, alumina is a widely studied supporting material favoring copper dispersion through the formation of isolated Cu2+ species and/or an aluminate phase [14,15,16,17]. The density of acid-basic sites and in general alumina’s performance as catalytic support is strongly related to its textural properties. Over the last years, synthesis of mesoporous alumina possessing large surface area and pore volumes has drawn immense interest, with a large number of studies emerging in the literature [24,25,26,27,28]. A common synthetic approach relies on the use of non-ionic surfactants as structure-directing agents (SDAs) in a sol-gel process. These sol-gel methods are performed in either aqueous or non-aqueous systems with the type of solvent strongly affecting the structural and textural properties of the final alumina material. According to the literature, in the presence of water, aluminum hydroxides tend to crystallize mostly in the boehmite phase, whereas in a non-aqueous environment they exist in an amorphous state [25,26,27,28]. Moreover, in an aqueous system, the weak interactions between the boehmite colloids and the surfactant result in the formation of lath-like or scaffold-like alumina pore structures that lack long-range periodic ordering [24,27]. In contrast, materials with a mesoscopic order of high-quality and amorphous pore walls can be obtained by an evaporation-induced self-assembly (EISA) approach, typically conducted in an ethanolic solution under an acidic environment [25,26,28]. An alternative, fast and low-cost method to produce large quantities of oxide nanoparticles is flame spray pyrolysis (FSP). However, due to the high temperature of the flame, alumina materials formed during this process demonstrate different crystal phases and textural properties compared to soft-template synthesis routes [29].
Until now, considerable research was oriented towards the effect of a copper content and metal deposition method on the final catalytic activity, with alumina’s properties receiving much less attention [10,17,30,31,32]. The aim of this work is to produce highly-loaded and finely dispersed CuO/Al2O3 catalysts as well as to provide new insights into the impact of the alumina properties on CuO speciation, dispersion and hence on catalytic behavior. Three alumina supports were prepared by employing different synthetic strategies, namely, an ethanol-based evaporation-induced self-assembly approach (EISA), a water-based soft-templating method and flame spray pyrolysis, and used as catalytic supports together with a commercial alumina powder. Copper addition in several loadings (5, 10 and 15 wt%) was accomplished using a modified version of the Ammonia Driven Deposition Precipitation (ADP) method developed by Guo et al. [31], as also described in the work of Xin et al. [19,20]. Various characterization techniques, such as SEM, EDS mapping, STEM, N2 adsorption, low- and wide-angle X-ray diffraction (XRD), UV–vis diffuse reflectance, X-ray photoelectron spectroscopy (XPS), H2-temperature programmed reduction (H2-TPR), NH3-temperature programmed desorption (NH3-TPD) and inductively coupled plasma mass spectrometry, were employed for the investigation of the produced supporting and catalytic materials’ morphology, pore structure, crystallinity, speciation, reducibility, acidity as well as metal loading. To evaluate the three-way catalytic performance, activity measurements were taken at the stoichiometric point using a complex feed stream containing, among others, C3H8, CH4, CO2 and H2O, and an appropriate volumetric flow in order to simulate real operating conditions.

2. Results

2.1. Physicochemical Properties of the Alumina Supports

An overview of the produced pure and Cu-loaded alumina samples is given in Table 1. Textural characteristics of the alumina supports derived from N2-sorption measurements are listed in Table 2. The corresponding isotherms and pore size distributions (PSD) are displayed in Figure 1. The Al(1), Al(2) and Al(3) samples exhibit typical IVa isotherm plots, corresponding to mesoporous adsorbents, with an H1 hysteresis loop characteristic of materials with cylindrical pore geometry [33]. However, differences in the hysteresis loops’ shape and location can be observed among the three samples, reflecting the different uniformity degree and size of the mesopores. As derived from the respective pore size distribution (PSD) analysis, the Al(1) material demonstrates a narrow PSD centered around 6 nm, the Al(2) sample possesses three times larger pores of around 18 nm and a wider distribution, whereas the Al(3) sample clearly comprises bigger and non-uniform pores, as evidenced by the very broad PSD curve. Finally, the Al(4) alumina differs greatly from the other samples, presenting a type II isotherm plot accompanied by a less distinct hysteresis loop, indicative of non-porous or macroporous solids.
Figure 2 shows the low- and wide-angle XRD patterns of the parent materials. As observed by the low-angle XRD patterns (Figure 2 left) in the Al(2), Al(3) and Al(4) samples, a single broad diffraction peak emerged, indicative of poorly ordered nanoporous structures. On the contrary, sample Al(1) exhibits a well-resolved diffraction peak around 1.0° accompanied by a weak signal at higher angles, evidencing a long-range pore ordering [25,26,27,28]. According to Figure 2 (right), Al(1) also demonstrates a different wide-angle XRD pattern compared to the rest of the aluminas, since only diffuse weak reflections could be detected, revealing the amorphous nature of the pore walls. The Al(2), Al(3) and Al(4) samples demonstrate the characteristic peaks of a γ-Al2O3 metastable phase (JCPDS #10-425), with a significant contribution from δ-Al2O3 (JCPDS #46-1215) in the case of Al(4) as a result of the elevated temperatures employed during FSP. However, despite their similar XRD patterns, the broader and lower intensity peaks observed in Al(2) reveal a lower crystallinity degree.
Morphological characteristics of the different alumina samples were investigated by scanning electron microscopy (Figure 3). The SEM micrograph illustrated in Figure 3A verifies the formation of a highly ordered mesostructure in the case of Al(1), as demonstrated by the hexagonally packed uniform cylindrical mesochannels. Al(2) seems to be built-up of very thin fiber-like structures grown into each other, generating a non-ordered porous network. Al(3) exhibits analogous morphology with Al(2), i.e., a lath-like mesostructure, consisting of rod-like instead of fiber-like units. The micrograph of Al(4) shows that this material consists of spherical nanoparticles, typical for materials made by flame spray pyrolysis. Some of these particles are already aggregated to bigger structures.
The acidic properties of the alumina samples were evaluated by means of NH3 temperature-programmed desorption. The acquired NH3-TPD profiles are presented in Figure 4 and the total amount of desorbed NH3 is summarized in Table 2. As derived from Figure 4, all aluminas display a similar NH3-TPD profile shape, characterized by two distinct desorption peaks corresponding to medium and strong acid sites, respectively. The position of the first peak is shifted to a lower temperature in Al(1) and to a higher temperature in Al(2), reflecting small deviations in acid strength, whereas the second peak is recorded at the same temperatures in all the alumina samples. It should be noted that in the case of Al(4), the additional weak desorption peak emerged at 450 °C together with the large desorption peak located above 600 °C cannot be solely attributed to NH3 desorption but also to some interfering molecule coming off from the support. This assumption was confirmed by the detection of both desorption signals when a blank TPD experiment was performed without using NH3 (Figure S1). Therefore, the real amount of desorbed NH3 in the Al(4) sample was calculated by subtracting the area of the m/z = 16 peak at 650 °C of the blank experiment. Accordingly, the area of the desorption peaks corresponding to the number of acid sites presents the following trend: Al(2) > Al(1) > Al(3) > Al(4). It is obvious that the Al(1) and Al(2) samples with the highest specific surface area values exhibit considerably higher acidity than the other two aluminas.

2.2. Physicochemical Properties of the Copper-Loaded Alumina Catalysts

The textural characteristics derived from N2-sorption analysis of the final catalysts, after loading with Cu and calcination, are presented in Table 3. The corresponding isotherms and pore size distributions (PSD) are displayed in Supplementary Materials Figures S2 and S3. In the case of the catalytic samples produced from Al(1) alumina, by comparing the isotherms of the parent and the copper-loaded materials, it is obvious that metal addition drastically altered the material’s pore structure. This is also confirmed by the respective narrow pore size distribution curves, centered at very low pore diameter values. On the contrary, the catalytic samples derived from Al(2) and Al(3) alumina supports retain the parent mesoporous structure to a great extent. According to the shape of the Cu-loaded materials’ isotherm plots, metal deposition did not induce significant changes in the alumina pore network. Only in the case of the Al(2)-derived samples is there a drop in surface area and pore volume, presumably due to plugging of some of the pores. Upon CuO loading of the Al(4) sample, the shape of the isotherm evolves to type Iva, featuring a better-resolved hysteresis loop, suggesting the presence of mesoporosity. This is further supported by the obtained PSD curves revealing the formation of pores with a diameter of 10–18 nm, possibly generated from interparticle voids between the agglomerated CuO particles.
N2 adsorption findings are further supported by low-angle X-ray diffraction analysis illustrated in Figure S4. As seen, in the low-angle XRD patterns of the Cu-loaded Al(1) samples, the main low-angle diffraction becomes broader and the weak one disappears, implying a reduction in pore structure regularity upon Cu addition. The wide-angle XRD patterns of the Cu-loaded materials are shown in Figure 5. When a low amount of copper (5 wt%) is added, the absence of peaks attributed to the CuO crystal phase indicate a very good dispersion of Cu species [34]. Only in 5Cu Al(3) could traces corresponding to the CuO tenorite crystal phase (JCPDS #03-0884) be identified. By further increasing copper content to 10 wt%, sharp and high intensity peaks ascribed to the tenorite phase could be clearly detected in 10Cu Al(3) and 10Cu Al(4), while for 10Cu Al(1) and 10Cu Al(2), no characteristic features of CuO are visible. Finally, at 15 wt% Cu loading, all samples’ patterns verify the presence of CuO, except for 15Cu Al(1). The average crystallite sizes of CuO particles, estimated from the Gaussian fitted (111) reflection by using the Scherrer formula, vary between 18 and 21 nm as listed in Table 3.
On the other hand, the Cu Al(1) samples demonstrate completely different diffractograms compared to the other copper loaded materials. Copper addition through the ADP method in this case induced a transition from amorphous to crystalline state as evidenced by the appearance of γ-Al2O3 peaks, justifying the deterioration of pore ordering. However, the most impressive is the absence of peaks related to copper species even at high Cu loading (15 wt%). By more closely inspecting the diffraction emerged around 37°, a strengthening is noticed with Cu loading increase in relation to the other γ-Al2O3 peaks, pointing towards the presence of a CuAl2O4 spinel phase (JCPDS #33-448). The characteristic peaks of this spinel phase are detected at 31.5°, 37°, 45° and 56° [35]. γ-Al2O3 is usually also described as a defective spinel, so unsurprisingly, both XRD patterns are very similar [35,36]. Consequently, unambiguous detection of a CuAl2O4 phase is hindered by its nanocrystalline nature along with the overlapping with γ-Al2O3 diffractions. Moreover, as shown in an enlarged excerpt of the diffractograms (Figure S5), the downward shift noticed around 46° in the case of both 15Cu Al(1) and 15Cu Al(2) compared to the rest of the samples suggests that this phase is also present, albeit to a lesser extent, in sample 15Cu Al(2).
SEM reveals that after the addition of a low amount of Cu, the samples retain the parent morphology, as shown in Figure 6, except for sample 5Cu Al(1). In this case, strongly aggregated structures without noticeable order in the pore arrangement are observed. This drastic change of the morphological characteristics is consistent with both N2-sorption and XRD findings. In some regions of the 5Cu Al(3) sample, aggregates are present at the external alumina surface attributed to CuO, also in complete agreement with the wide-angle XRD pattern. SEM images of the 10 wt% Cu-loading samples can be found in Supplementary Material Figure S6. The CuO aggregates appear to increase in population for 10Cu Al(3) and are also distinguishable in 10CuAl(4). Sample 10Cu Al(2) exhibits the same morphological features as the parent material, while in sample 10Cu Al(1) a second phase with a flake-like morphology could be observed, possibly related to the initiation of a CuAl2O4 spinel phase. This phase predominates in sample 15Cu Al(1), confirming the XRD results. Moreover, at this high copper loading (15 wt%), CuO aggregates are distinguished in all materials except for Al(1), as shown in Figure S7. To further support the aforementioned findings, backscattered electron analysis was performed. As shown by the acquired BSE images of sample 15Cu Al(1), depicted in Figure 7, the same brightness can be observed over the entire examined area, which suggests a great homogeneity in chemical composition. This high homogeneity could originate from either the existence of a single phase or the fine distribution of Cu species. On the contrary, in the other samples loaded with 15 wt% Cu, BSE analysis revealed significant contrast variations. Specifically, the aggregates detected with the SEM mode appear much brighter with BSE imaging, confirming that they consist of CuO. Elemental Cu, Al and O mappings at the microstructural level acquired by SEM/EDS analysis further support these findings (Figures S8–S13).
Additional information about the spatial distribution of Cu species at the nanoscale is provided by STEM and EDS mapping analysis (Figure 8 and Figure 9, Figures S14 and S15). Evidently, 15Cu Al(1) stands out in terms of CuO species uniformity and homogeneous dispersion. As observed in Figure 8, this material comprises small nanocrystals ascribed to an alumina-containing phase according to the diffuse rings in the obtained selected area electron diffraction (SAED) patterns. High-angle annular dark field scanning transmission electron microscopy (HAADF-STEM) micrographs together with Cu, Al and O elemental mappings clearly demonstrate a compositional uniformity. CuO nanoparticles could not be distinguished, suggesting incorporation of Cu into the alumina structure and/or distribution at the subnanometer scale. At low Cu loading (sample 5CuAl(1)) although Cu species are finely dispersed, CuO nanoclusters could also be detected (Figure S14), suggesting that Cu incorporation is mostly favored at higher loadings. In the other high Cu-loaded alumina samples, highly dispersed Cu species co-exist with large CuO crystallites, as seen in Figure S15 and confirmed by SAED patterns. However, these crystallites’ size and population are reduced in the 15Cu Al(2) sample. In addition, in the areas of well-dispersed CuO species, Cu-rich domains could be noticed, evidencing an uneven distribution (Figure 9). Finally, it should be stressed that in all the examined samples, the mesoporous nature was clearly visible.
UV–visible diffuse reflectance (UV-Vis-DR) spectroscopy was performed to gain insight into the state and clustering of the Cu species. Figure 10 shows the UV-Vis-DR spectra of each support with different Cu loadings. In general, as reported in the literature, the band situated at 230–300 nm can be assigned to the charge transfer between Cu2+ and oxygen, whereas the band around 340–440 nm is associated with the presence of [Cu-O-Cu]n-type clusters (oligomeric species). Absorption in the range of 400–450 nm is assigned to the three-dimensional Cu+ clusters in the CuO matrix or to bulk the CuAl2O4 spinel phase and around 600–650 nm to a square planar coordination of Cu2+, typically confirming the presence of bulk CuO [19,34]. Finally, absorption between 600 and 800 nm corresponds to the d-d transitions of Cu2+ situated in an octahedral environment. As observed, at 5 wt% Cu loading only bands at low wavelengths can be detected, indicating the presence of mononuclear and oligomeric Cu species in all samples. The absence of absorption in the 600–800 nm region confirms that these samples are practically free of bulk CuO, in line with XRD results. However, at 10 wt% Cu, bulk CuO appears in the Al(3) and Al(4) samples, as evidenced by the absorption ranging from 300 to 800 nm. On the contrary, in samples Al(1) and Al(2), the recorded UV signals are mainly located between the region of monomeric and oligomeric species with additional weak absorption bands above 700 nm, implying the presence of octahedral Cu2+ species. Finally, at high Cu loading (15 wt%), the band around 600 nm corresponding to bulk CuO emerges in the spectrum of the 15Cu Al(2) sample as well. In the case of 15Cu Al(1), absorption below 400 nm is much higher compared to the other samples, suggesting a larger fraction of well-dispersed Cu species [30]. In addition, two new bands around 450 nm and 750 nm are observed, which could be assigned to d–d transitions of Cu2+ in tetrahedral and octahedral sites of the CuAl2O4 spinel lattice [13,15,30,37].
The state of copper species on the materials’ surface was also probed by XPS analysis. Figure 11 shows the XPS profiles of the 15 wt% Cu-loaded samples in the region of the Cu 2p3/2 transition. These profiles clearly demonstrate important differences among the different catalysts. In general, all samples exhibit a main contribution in the region 932–937 eV and two satellite contributions at ≈ 941.1–941.6 eV and 943.6–943.9 eV due to Cu2+ ions. The satellite structure is exclusive of Cu2+ ions (d9) and has been attributed to either 3d→4s or ligand-to-metal (O 2p→Cu 3d) transitions [38]. According to the literature, the reduced copper species such as metallic Cu and Cu2O have binding energies (BE) below 933 eV, while CuO typically has its transition at 933.4–933.9 eV. At the same time, CuAl2O4 has the transition at 935.0 eV [35,39,40]. To ascertain the nature of copper species, the main component in Figure 11 has been deconvoluted in three contributions: a first one at around 932.7–932.8 eV, a second contribution at 934.7–934.8 eV (except for 15 Cu Al(4), whose peak appears at 934.5 eV) and a small shoulder at 936.1–936.2 eV (except for sample 15 Cu Al(1), whose shoulder appears at 936.7 eV). The component at low BE could be attributed to Cu0. Taking into account that all samples were calcined in air atmosphere without any reductive treatment prior to XPS analysis, it can be inferred that the appearance of this component originates from the surface reduction of copper by the flux of X-ray radiation in the high vacuum chamber of the spectrometer [35]. Interestingly, the percentage of reduced copper (Cu0) is very high for samples 15 Cu Al(4) and 15 Cu Al(3) with 41 and 43%, respectively, while this percentage decreases to 34% for sample 15 Cu Al(2) and 29% for sample 15 Cu Al(1). These results clearly suggest that the reducibility of surface copper species is promoted in samples 15 Cu Al(3) and 15 Cu Al(4), while a different chemical environment, less prone to reduction, is found for the other two samples. Besides the alumina support, metal loading is another parameter affecting samples’ reducibility as derived by the even higher fraction of the in situ reduced copper species recorded for two low Cu-loaded samples, ranging from 49 to 53% (Figures S16 and S17). The Cu 2p3/2 region exhibits a second contribution at ca. 934.7–934.8 eV, being the main component for samples 15 Cu Al(1) and 15 Cu Al(2). These BE values are relatively close to the values reported in the literature for Cu2+ in CuAl2O4 (≈935 eV) [35,39,40]. Although these results confirm the presence of spinel in the synthesized catalysts, some contribution from CuO (expected BE at 934.1 eV) cannot be excluded, especially for the 15 Cu Al(3) and 15 Cu Al(4) samples, where a slight shift to lower BEs is recorded. The presence of CuO in these two samples could also explain the higher reducibility of surface copper species during the XPS measurements, this reduction being rather limited for sample 15 Cu Al(1). All catalysts also exhibit a shoulder at higher BE (936.1–936.7 eV). Although this contribution is very high in binding energy as compared to the typically reported values for Cu2+ (as CuO or CuAl2O4), it could be associated with copper ions coordinated to oxygen in a highly oxidizing Al3+ environment [39]. The Al 2p transitions of the 15 wt% Cu-loaded samples are shown in Supplementary Materials (Figure S18).
Surface and bulk Cu content values determined by XPS and ICP-MS, respectively, are listed in Table 4. In addition, Cu to Al atomic ratios which could be used as an indication of Cu dispersion, are also included in Table 4 [41]. As seen in the table, the 15Cu Al(1) sample demonstrates a much higher Cu/Al value in relation to the other samples, indicating a higher dispersion degree.
H2-TPR provides valuable information regarding catalysts’ reducibility, which is closely related to the nature of copper species. In general, for supported CuO catalysts, two main reduction stages are found in the H2-TPR profiles. TPR peaks emerging below 250 °C are usually assigned to the reduction of highly dispersed CuO or isolated Cu2+ species; on the other hand, bulk CuO is reduced at around 300 °C (as seen in the H2-TPR profile of bulk CuO in Figure S19) [19,20]. Another general aspect of TPR is that stronger interactions between CuO and the support will result in a higher reduction temperature [9,38]. This strong metal–support interaction can be exploited to suppress the mobility of the particles, especially at higher temperatures [19].
Figure 12 shows the H2-TPR profiles of the four supports loaded with 5, 10 or 15 wt% Cu. For the sample series with 5 wt% Cu loading, a single reduction peak is generally observed in all TPR profiles, located however at different temperatures. In the case of the 5Cu Al(3) sample, where according to XRD analysis traces of bulk crystalline CuO are detected, the lowest reduction temperature is recorded at around 200 °C. For 5Cu Al(4), the reduction peak shifts to slightly higher temperatures, around 215 °C, while for 5Cu Al(1) and 5Cu Al(2), the reduction occurs at much higher temperatures, around 283 °C and 298 °C, respectively. The higher temperature profiles of the last two samples denote a stronger interaction between copper species and the alumina support, as was also suggested by Patel et al. [9].
The sample series consisting of 10 wt% Cu loading present different reduction profiles as a result of CuO species evolution with metal loading increase. H2-TPR profiles of 10Cu Al(1) and 10Cu Al(2) samples are very similar, consisting of two overlapping peaks between 250 and 300 °C, mainly attributed to highly dispersed CuOx and possibly to a copper aluminate spinel phase [42]. The peak assigned to highly dispersed CuOx species is now located at lower temperatures compared to the respective samples loaded with a lower amount of Cu (5 wt%). This downward shift with Cu loading increase, also reported in other works, is ascribed to the weaker interaction between larger CuOx species and the alumina support [17,43]. The other two samples, 10Cu Al(3) and 10Cu Al(4), exhibit more complicated profiles indicative of speciation and particle size heterogeneity. In the case of 10Cu Al(3), the two distinct peaks below and above 300 °C are related to the reduction of well-dispersed CuOx and bulk CuO, respectively, as detected by XRD analysis. Finally, the H2-TPR profile of the 10Cu Al(4) sample is characterized by two low temperature peaks located between 200 and 250 °C and two overlapping peaks centered at 300 °C. The low temperature peaks could be associated with CuOx nanoparticles of different dispersion state, whereas the higher temperature peaks with bulk-like CuO aggregates and large CuO crystallites or crystallites of different sizes [44,45,46]. By further increasing Cu loading to 15 wt%, only the 15Cu Al(1) sample preserves the same reduction pattern with a slight shift at higher temperatures. In contrast, in the 15Cu Al(2) sample, an additional peak appeared at a higher temperature (around 380 °C), which, based on XRD and UV-Vis-DR findings, could be ascribed to the reduction of large CuO crystallites. In the case of 15Cu Al(3) and 15Cu Al(4), an increase of Cu loading resulted in a widening and an upward shift of both low and high temperature peaks. These changes are closely related to CuO dispersion, crystallinity and size [44]. In particular, the higher contribution from the high temperature peaks observed in both samples is consistent with the larger fraction of bigger CuO particles as evidenced by XRD, UV-vis-DR and SEM analysis. Finally, the lack of detection of the peak located around 300 °C only in these two samples further supports its assignment to Cu species strongly interacting with the support, possibly in the form of copper aluminate species.

2.3. Catalytic Activity of CuO/Alumina

CO, C3H6, C3H8, CH4 and NO conversion profiles as a function of catalyst temperature are shown in Figures S20–S23. Light-off (temperature at which 50% conversion is reached, T50), T90 (temperature at which 90% conversion is reached) and maximum conversion temperatures along with maximum conversion values are listed in Table S1. Regarding samples’ oxidation performance at 5 wt% Cu loading, the 5Cu Al(1) sample demonstrates the lowest activity, especially in the case of CO and C3H6 with much higher T50 and T90 values in comparison to the other samples, whereas the lower T50 values are recorded for the 5Cu Al(3) and 5Cu Al(4) samples. By further increasing the amount of Cu to 10 wt%, the difference between material activity is smoothed, whereas at 15 wt% Cu loading, the situation is reversed, with the 15Cu Al(1) and 15Cu Al(2) samples displaying the optimum oxidation performance.
The opposite trend with metal loading is, however, noticed in the case of NO reduction as shown in Figure S22. NO conversion efficiency progressively drops with an increase in the amount of Cu. At 5 wt% Cu loading, the maximum NO conversion is achieved by the 5Cu Al(1) sample, surpassing 15%. At 10 wt% Cu loading, the 10Cu Al(1) and 10Cu Al(3) samples present similar NO profiles, around 10%, whereas at 15 wt% Cu loading, 15Cu Al(1) performs poorly, providing the worst NO conversion.
Valuable information regarding the evolution of catalytic performance with metal loading can be drawn from Figure 13, where T50 of CO, C3H6 and C3H8 versus Cu amount are plotted. A monotonic decrease of T50 values with metal loading is observed only in the case of the Al(1) and Al(2) sample series. In particular, the most profound improvement of oxidation activity with Cu increase is observed for the Al(1) samples. In this case, T50 values of CO and C3H6 are lowered by 90 °C and 50 °C, respectively, upon metal increase from 5 to 15 wt%, accompanied by a significant reduction in T90, varying between 55 °C and 120 °C. In the other two sample series, Al(3) and Al(4), an insensitivity to metal loading is observed, as a steady performance is attained regardless of Cu increase. Only in the case of the Al(4) samples is a minimum reached in CO, C3H6 and C3H8 conversion at 10 wt% with a further rise at higher loading.

3. Discussion

The ammonia-driven deposition–precipitation method (ADP) is a simple and highly efficient deposition strategy that provides finely dispersed metal or metal oxide nanoparticles onto a catalyst support [19,20]. In this work, a modified ADP method was employed with a molar Cu2+/NH3 ratio regulated at 1/6. As proven in our previous work [20], a higher amount of NH3 favors the formation of the positively charged complex [Cu(NH3)4(H2O)2]2+ over the zero charged complex Cu(OH)2(H2O)4 which is also produced during the ADP process. The dominance of the copper tetra-ammine complex strengthens the electrostatic interaction with the support ultimately affording highly dispersed copper oxide species. However, as can be reasonably assumed and demonstrated herein, another determining factor governing this interaction is the support surface and bulk properties.
The Al(1) and Al(2) samples that were produced by means of ethanol-based and water-based soft-templating approaches possess larger specific surface area and more acid sites as well as lower crystallinity degree compared to the other two alumina samples, Al(3) and Al(4). Hence, they offer abundant sites for copper adsorption generating strongly bonded and evenly distributed Cu species. This is clearly evidenced by the position of H2-TPR peaks at higher reduction temperatures in the 5 wt% Cu-loaded samples and the absence of XRD peaks corresponding to bulk crystalline CuO phase in the whole metal loading range for the Al(1) sample and up to 15 wt% Cu loading for Al(2). On the contrary, in the Al(3) and Al(4) samples, diffractions ascribed to the CuO phase could be observed from 5 and 10 wt% of Cu loading, respectively. XRD findings are further supported by UV-Vis-DR and H2-TPR analysis, as shown by the multiple signals detected in the case of the Cu Al(3) and Cu Al(4) sample series even from medium Cu loading (≥10 wt%), indicating a greater heterogeneity in Cu speciation and particle size. Specifically, as verified by microscopy techniques, in these two samples well-dispersed CuO nanoparticles coexist with bulk-like aggregates and crystalline CuO. This transition from isolated Cu species to small clusters and eventually to three-dimensional CuO with metal loading is well documented in the literature and closely related to the support’s surface area. Specifically, as postulated by Friedman et al. [47] and confirmed by other studies [17,35], there is a threshold loading of Cu onto γ-Al2O3 supports determined to be around 4 wt% Cu per 100 m2 g−1. Beyond this level, support adsorption sites are saturated and segregation of bulk copper oxide phase occurs. In this work, Cu dispersion capacity of the three γ-Al2O3 samples correlates well with surface area and the following order is observed: Al(2) > Al(3) ≈ Al(4). However, the amorphous Al(1) sample deviates from this trend, far exceeding the suggested saturation limit despite presenting a lower surface area than the Al(2) sample. Evidently, both surface area and crystallinity degree play a key role, determining the total number of the support’s adsorption sites and the extent of metal–support interaction.
The strong metal–support interaction in the Cu Al(1) and Cu Al(2) series is further supported by the formation of a surface copper aluminate spinel phase at medium and high Cu loadings. It should be noted that this phase could also be present in the other two samples, but in a significantly smaller amount. According to XRD, UV-Vis, XPS, backscattered and STEM analysis, this phase predominates in the 15Cu Al(1) sample. Moreover, in this sample, surface CuAl2O4 coexists with a “bulk-like” spinel phase as evidenced by the band detected around 450 nm in the UV-Vis-DR spectrum, assigned to tetrahedrally coordinated Cu2+ [30]. This band is usually associated with bulk CuAl2O4, considering the different Cu2+ distribution at the defect sites of the alumina matrix in the two aluminate phases. In surface copper aluminate, Cu2+ ions exist principally (≈90%) in tetragonally distorted octahedral (Oh) coordination, whereas in the bulk spinel phase, the larger fraction around 60% of Cu2+ ions occupies the tetrahedral (Td) sites and the remaining 40% the octahedral (Oh) defect sites of Al2O3 [12,35,47]. Formation of the octahedrally coordinated surface spinel can easily occur in high surface area supports even at low temperatures (>300 °C), justifying its presence in both Cu Al(1) and Cu Al(2) samples [48,49]. In contrast, the bulk aluminate phase requires higher temperatures (>600 °C) for the deeper diffusion of Cu2+ ions into the tetrahedral sites [47]. In addition to temperature, the increased copper loading is another factor favoring the formation of bulk copper aluminate [12]. In the present case, although Cu loading is high enough (15 wt%), calcination temperature employed is lower (550 °C) than that reported in the literature. However, the Al(1) sample belongs to a category of mesoporous alumina which according to previous studies [25,50] are characterized by a high quantity of defects as a result of the high surface area, lattice distortion and oxygen deficiency in the bulk. This defective structure of the Al(1) sample could facilitate and accelerate the penetration of copper ions into the bulk matrix, leading to a higher amount of tetrahedrally coordinated Cu2+, designated herein as the “bulk-like” spinel phase. Moreover, the partial hydrolysis of the amorphous framework walls during the ADP process, i.e., utilization of basic conditions for a prolonged period, could also have contributed to this direction. This incorporation of Cu ions into the alumina lattice could account for the structural evolution observed in Cu Al(1) sample series, since as previously reported, the atom rearrangement within the alumina structure at medium Cu doping levels could lead to a transition from the amorphous to the gamma phase [50].
By correlating the findings of the characterization analysis with catalytic performance, it can be shown that each sample contains a combination of copper phases regulated by the employed alumina support with a net effect on pollutant conversion efficiency. As shown at low Cu loading, the loosely bonded, well-dispersed and more reducible CuO species, according to the H2-TPR analysis, dominating in the Al(3) and Al(4) samples are more advantageous towards CO and hydrocarbon oxidation compared to the strongly interacted Cu species present in the Al(1) and Al(2) samples. However, the opposite trend is observed regarding NO reduction, in line with other works, identifying the isolated Cu2+ ions as the active phase towards SCR of NO [15,30]. The gradual increase of Cu content induces a negligible amelioration of the catalytic activity in terms of oxidation performance in the Al(3) and Al(4) samples, as the extra Cu added accumulates in the form of large CuO particles slightly interacting with the other copper or support phases and hence not contributing towards the increase of active sites’ population. On the contrary, in the Al(1) and Al(2) samples, the additional Cu amount greatly promotes catalytic efficiency as it is highly deposited and/or dissolved into the alumina matrix, enriching the number and the type of catalytic active sites, with formation of surface and bulk-like copper aluminate. The beneficial catalytic action of spinel-type phases is highlighted in several works [9,12,15,16,30,51,52,53]. Yoshida et al. [12] investigated the thermal aging of Cu/Al2O3 catalysts and its effect on the Cu local structure and eventually on the catalytic performance. As concluded, Cu incorporation into the Al2O3 structure occupying predominantly the tetrahedral (Td) defect sites resulted in significant improvement of the TWC performance. This was associated with the redox behavior of the Td-Cu2+ sites, reduced by CO and/or C3H6 and subsequently re-oxidized by NO. On the other hand, according to Shimizu et al. [15,16], the surface Cu2+ cations in octahedral sites account for the higher activity of copper aluminum mixed oxide catalysts in NO selective reduction by C3H6. In other studies, the coexistence of surface copper aluminate either with bulk copper aluminate or with CuO is reported to produce a synergetic effect favoring charge transfer and thus promoting the catalytic performance [9,17,51,52,54]. In this context, the higher oxidation performance of the 15Cu Al(1) and 15Cu Al(2) samples could be ascribed to both the increased number of active sites as well as the interplay between the different Cu phases and hence to the generated interfacial sites. More precisely, in terms of light-off temperatures, the optimum CO oxidation performance is demonstrated by the 15CuAl(2) sample in which copper is present both in a highly dispersed form, i.e., CuO nanoparticles and surface Cu-Al spinel as well as in large CuO crystallites. The highest activity towards C3H6, on the other hand, is achieved by 15CuAl(1) exhibiting the highest Cu dispersion clearly evidenced by STEM analysis. In this sample, highly dispersed CuOx species co-exist with nanosized copper aluminate spinel phases. It is also worth emphasizing that the high CO and C3H6 activities attained by both these samples surpasses those reported in the literature for similar catalytic systems [12,55], despite the more complex feed steam employed herein containing 10% H2O, CO2 and a mixture of hydrocarbons (CH4, C3H8 and C3H6). Although the produced materials are very active towards pollutant oxidation, they lack efficiency in NO conversion. Apparently, the presence of a large amount of water vapor in the reactant gas feed could be to some extent responsible for the poor NO reduction observed in all samples [12,55]. However, the observed decline in NO conversion with increasing Cu amount from 5 to 15 wt%, in all cases and especially in Cu Al(1) sample series, indicates the significant effect of Cu speciation. As proven by other works [12,54], a thermal evolution of the Cu/Al2O3 structure by applying calcination at higher temperatures could greatly enhance NO reduction performance. Therefore, a follow-up study by our group will involve the thermal treatment of the Cu Al(1) samples at higher temperatures in view of producing more active catalytic systems through the incorporation of a higher fraction of Cu ions into the support matrix and thus the increase of CuAl2O4 yield.

4. Materials and Methods

4.1. Catalyst Preparation

All chemicals used were purchased from Merck—Sigma Aldrich (Merck KGaA, Darmstadt, Germany) and used without further purification.

4.1.1. Synthesis of Alumina Supports

Four different mesoporous alumina supports were used in this study.
  • Ethanol-based method—Al(1)
For the synthesis of the first alumina, denoted as Al(1), a facile, highly reproducible and cost-effective procedure, described by Yuan et al. [25], was adopted. This method relies on evaporation-induced self-assembly (EISA) with the use of the non-ionic triblock co-polymer Pluronic P123 as a soft-template. In a typical experiment, 2 g P123 was dissolved in 40 mL of EtOH at RT. Then, 3.2 mL of nitric acid (65 wt%) and 0.01 mol of aluminum isopropoxide were added to this solution under vigorous stirring for 8 h. Finally, the obtained solution was transferred into a petri dish and placed in an oven at 60 °C in air for 2 days, for solvent evaporation and material condensation to occur. Calcination was carried out at 550 °C for 6 h at a heating rate of 1 °C min−1 under airflow.
  • Water-based method—Al(2)
A second alumina denoted as Al(2) was synthesized according to the method of Wu et al. [27]. Similar to the previous method, aluminum isopropoxide was used as the aluminum source and was hydrolyzed in an aqueous solution of nitric acid. Pluronic F127 was used as the template for the sol-gel synthesis. In brief, 20 mmol of aluminum isopropoxide was added to 2 mol of H2O at 85 °C and stirred for 15 min. Next, 1.5 mmol nitric acid (65 wt%) was added and the solution was stirred at 85 °C for 7 h. For the first 2 h, no cap was placed on the flask, to allow the formed isopropanol to evaporate. Finally, 8.68 g of Pluronic F127 was added to the mixture and after the template was dissolved, the mixture was stirred at room temperature for 16 h. The sol was then dried in a petri dish at 70 °C for 24 h. The dried product was collected and calcined at 700 °C for 4 h with a ramping speed of 1 °C min−1.
  • Commercially Available Al2O3—Al(3)
The commercial Al(3) is Puralox SCFa-140 from Sasol provided by Johnson Matthey.
  • Flame Spray Pyrolysis method—Al(4)
Al(4) was provided by TECNAN-Lurederra and was synthesized by a liquid-feed flame spray pyrolysis (LF-FSP) method in a prototype reactor designed in-house with a capacity of up to 1 kg h−1. It applies a one-step process, using liquid precursor mixture based on organometallic reagents and solvents, adjusting the viscosity (~6 cp) and the calorimetric properties (~8000 cal g−1) to control the atomization and the flame behavior.

4.1.2. CuO Loading Using the ADP Method

The preparation of the CuO-loaded catalyst is as follows: an appropriate amount of the support material (e.g., 0.5 g) was stirred in a 0.03 M Cu(NO3)2 aqueous solution. The amount of solution was appropriately chosen to achieve the intended Cu-loading in wt% (5, 10 or 15 wt%). Ammonia (25% in water) was added in order to obtain a molar ratio of Cu/NH3 = 1/6. The vessel was sealed, so no ammonia was lost during the process. After stirring the solution for 48 h, the resulting mixture was dried at 60 °C until all the solvent was evaporated. Finally, calcination followed at 550 °C for 6 h with a heating rate of 1 °C min−1. For simplicity, the samples are denoted as shown in Table 1.

4.2. Physicochemical Characterization

N2-physisorption was carried out at 77 K with a Quantachrome Quadrasorb SI (AUTOSORB-1-Krypton version—Quantachrome Instruments, Boynton Beach, FL, USA) automated gas adsorption system. Prior to the measurements, the samples were outgassed at 200 °C for 16 h. The specific surface area was calculated using the Brunauer-Emmet-Teller (BET) equation. The Barrett–Joyner–Halenda (BJH) method was applied to estimate the pore size distribution. The total pore volume was determined at P/P0 = 0.95.
X-ray diffraction was performed using a Rigaku rotating anode X-ray generator (Rigaku Co., Tokyo, Japan) operating at 50 kV, 100 mA, Ni-filtered Cu Ka1 radiation and an R-AXIS IV image plate. Samples were sealed in Lindemann capillaries.
H2-temperature programmed reduction (TPR) measurements of the catalysts were performed on a Quantachrome iQ (AUTOSORB-1-Krypton version—Quantachrome Instruments, Boynton Beach, FL, USA). Prior to the measurement, about 20 mg of the sample was outgassed at 200 °C for 16 h. After cooling, the sample was first pretreated at 200 °C under a He flow for 1 h. Subsequently, the sample was reduced with 5% H2/Ar at a flow rate of 25 mL min−1 and the temperature was raised from 100 °C to 800 °C with a heating rate of 10 °C min−1. The hydrogen consumption was continuously monitored using a thermal conductivity detector (TCD). The final TCD signal was normalized by the catalyst weight used during the measurement.
UV–vis diffuse reflectance (UV–vis-DR) analysis was carried out on a Nicolet Evolution 500 spectrophotometer (Thermo Electron Corporation, Waltham, MA, USA) equipped with an integrating sphere. The spectra were taken in the range of 200–800 nm with a scan speed of 120 nm min−1. The samples were diluted to 2 wt% with dried KBr. Pure KBr was set as a background. Three consequent scans were taken and the average was calculated. The Kubelka–Munk function for materials of infinite thickness was applied to the reflectance measurements to obtain the coefficient of absorption [56].
The morphological investigation of the samples was conducted with a JEOL JSM 7401F Field Emission Scanning Electron Microscope (JSM 7401F, JEOL Ltd., Tokyo, Japan) equipped with Gentle Beam mode. The applied acceleration voltage was 2 kV. Samples were mounted on metallic (brass) substrates using a double-coated carbon-conductive tape. Backscattered images were acquired with SEM mode at a high accelerating voltage of 10 kV. Elemental mapping distributions of Cu, Al and O were acquired by EDS microanalysis, at acceleration voltage of 20 kV, using an Xplore-15 SDD detector (Oxford Instruments, Abingdon, UK) with a surface of 15 mm2.
STEM analysis was performed with a FEI Talos F200i field-emission (scanning) transmission electron microscope (Thermo Fisher Scientific Inc., Waltham, MA, USA) operating at 200 kV, equipped with a windowless energy-dispersive spectroscopy microanalyzer (6T/100 Bruker, Hamburg, Germany).
NH3-TPD experiments were carried out in a U-shaped quartz reactor using a 5% NH3 in He, at 50 mL min−1. Prior to the experiments, about 80 mg of sample was first activated by heating at 200 °C (5 °C min−1) for 2 h and then cooled to 120 °C with a He flow (50 mL min−1). Then, the sample was exposed to the NH3/He flow for 30 min. Physically adsorbed ammonia was removed by purging with He at 120 °C for 2 h. NH3 desorption (NH3-TPD) was performed in He flow up (50 mL min−1) from 120 °C to 800 °C, with a heating rate of 10 °C min−1, and monitored by online mass spectrometry. The evaluation of ammonia was recorded by following the m/z = 16.
X-ray photoelectron spectroscopy (XPS) was performed using a K-Alpha XPS system by Thermo Scientific (Thermo Fisher Scientific Inc., Waltham, MA, USA). Al-Kα radiation (1486.6 eV) was monochromatized by a twin crystal monochromator, resulting in a focused beam of 400 μm diameter at 3 mA × 12 kV. The whole energy band was scanned at 200 eV by operating the alpha hemispherical analyzer in constant energy mode, and narrow scans at 50 eV were used to measure the particular elements. To compensate charging, a system flood gun provided low-energy electrons and argon ions. The powder samples were pressed into small Inox cylinders before placement in the vacuum chamber. The analysis chamber was evacuated until a residual pressure of ca. 5 × 10⁻⁷ N m−2 was reached. The elemental surface composition was estimated by calculating the integrals of each peak after subtraction of the S-shaped background. The experimental curve was fitted to a combination of Lorentzian (30%) and Gaussian (70%) lines.
Inductively coupled plasma mass spectrometry (ICP-MS) was used to determine the Cu content in the samples using an Agilent 7500 series ICP-MS. Finally, 100 mg of the sample was digested overnight at 70 °C in 1 mL aqua regia and then diluted to the appropriate concentration range.

4.3. Catalytic Activity Measurements

The catalytic performance of the materials was tested in a fixed-bed continuous-flow stainless-steel reactor with a gas hourly space velocity of 60,000 h−1 and a total gas flow rate of 200 NmL min−1. Prior to the measurement, the catalytic powder was pelletized using an IR pelletizer and crushed in order to have a particle size between 250 µm and 350 µm. The pressure applied to the pelletizer was about 200 MPa. Afterwards, 200 mg of the sieved catalytic powder was pre-treated by passing atmospheric air (50 mL min−1) through the reactor at 500 °C (5 °C min−1) for 2 h. Subsequently, the reactor was cooled to 50 °C and the catalyst was then exposed to simulated vehicle exhaust gas under stoichiometric conditions as described in Table 5, followed by heating to 500 °C with a heating rate of 5 °C min−1. The conversion performance was recorded every 50 °C under steady-state conditions, at least 30 min after temperature stabilization. For the hydrocarbon conversion analysis, a Shimadzu GC-17A gas chromatograph equipped with an FID detector was used, while a Dräger X-am 7000 CO analyzer was utilized for the CO gas quantification. A ThermoScientific 42-HL NOx analyzer was applied to monitor the NO conversion during the catalytic reaction. The catalytic activity of the materials was calculated from the conversion of CO, CH4, C3H6, C3H8 and NO in the function of the reaction temperature. Light-off temperature (T50) of the different components was obtained by taking the reaction temperature where a 50% conversion was reached.

5. Conclusions

The present work underlines the importance of the catalytic support’s properties for active phase dispersion and speciation and, in turn, for three-way catalytic performance. To investigate this, a large number of Cu/Al2O3 samples were produced by applying a modified ammonia-driven deposition–precipitation (ADP) method to different alumina supports. By gradually increasing the copper amount from 5 to 15 wt%, monomeric and oligomeric copper species mainly transformed into copper aluminate phases or into bulk CuO depending on the support’s properties. As found, the alumina supports’ saturation levels leading to the segregation of a separate CuO crystalline phase mainly depends on the textural properties (surface area, acid sites) as well as the lattice distortion. Notably, the amorphous distorted mesoporous alumina used as a catalytic support shows a very high copper loading capacity, preventing formation of bulk CuO even at 15 wt% Cu loading. Instead, finely dispersed and strongly interacted Cu species in the form of surface and bulk-like CuAl2O4 phases are produced as a result of the abundant surface adsorption sites and the easy dissolution into the bulk matrix. The evolution of Cu species with the metal content controlled by the support’s structural properties greatly affects the catalytic activity. The high oxidation efficiency attained towards CO and C3H6 by the 15 wt% Cu-loaded materials on high-surface-area and low-crystallinity alumina supports is associated with the increased number of active sites and the interaction between the newly formed Cu phases, surface and bulk-like CuAl2O4 or surface aluminate and bulk CuO. The copper-containing catalysts developed herein, although unable to completely replace PGMs, could be integrated into current TWC formulations as oxidation catalysts, contributing to the minimization of scarce and expensive materials. Moreover, matching the ADP method with an amorphous mesoporous alumina support was proved to be an effective strategy towards the stabilization of Cu ions in a highly dispersed state. This provides useful insight not solely into the synthesis of new noble metal-free three-way catalysts, which are more prone to undesirable sintering phenomena, but also into other applications areas, such as antibacterial and photocatalytic.

Supplementary Materials

The following supporting information can be downloaded at: https://www.mdpi.com/article/10.3390/catal12060628/s1, Figure S1: NH3-TPD and TPD after cleaning with He for 2 h; Figure S2: N2-physisorption isotherms. Top left: Al(1) and derived materials loaded with CuO, top right: Al(2) and derived materials loaded with CuO, bottom left: Al(3) and derived materials loaded with CuO, bottom right: Al(4) and derived materials loaded with CuO; Figure S3: Pore size distributions (PSD) derived from the desorption branch. Top left: Al(1) and derived materials loaded with CuO, top right: Al(2) and derived materials loaded with CuO, bottom left: Al(3) and derived materials loaded with CuO, bottom right: Al(4) and derived materials loaded with CuO; Figure S4: Low-angle XRD pattern of 5 Cu Al(1); Figure S5: Detail of the XRD patterns of the 15 wt% Cu-loaded alumina samples; Figure S6: SEM micrographs of (A) 10Cu Al(1), (B) 10Cu Al(2), (C) 10Cu Al(3) and (D) 10Cu Al(4) samples; Figure S7: SEM micrographs of (A) 15CuAl(1), (B) 15CuAl(2), (C) 15CuAl(3) and (D) 15CuAl(4) samples; Figure S8: SEM micrograph of 5CuAl(1) sample and the corresponding O, Cu, Al elemental maps; Figure S9: SEM micrograph of 5CuAl(2) sample and the corresponding O, Cu, Al elemental maps; Figure S10: SEM micrograph of 15CuAl(1) sample and the corresponding O, Cu, Al elemental maps; Figure S11: SEM micrograph of 15CuAl(2) sample and the corresponding O, Cu, Al elemental maps; Figure S12: SEM micrograph of 15CuAl(3) sample and the corresponding O, Cu, Al elemental maps; Figure S13: SEM micrograph of 15CuAl(4) sample and the corresponding O, Cu, Al elemental maps; Figure S14: (A) HAADF STEM image and (B-D) EDS mapping images of 5CuAl(1) sample; Figure S15: (A) SAED pattern, (B) HAADF STEM image, (C,D) EDS mapping images of 15CuAl(4) sample, (E) HAADF STEM image and (F-H) EDS mapping images of 15CuAl(2) sample; Figure S16: XPS characterization of the Cu 2p3/2 transition for 5 Cu Al(1) sample; Figure S17: XPS characterization of the Cu 2p3/2 transition for 5 Cu Al(2) sample; Figure S18: XPS characterization of the Al 2p transition for (A) 15 Cu Al(1) (B) 15 Cu Al(2) (C) 15 Cu Al(3) (D) 15 Cu Al(4); Figure S19: H2-TPR profile of CuO; Figure S20: CO conversion profiles vs. temperature (A) 5 wt% Cu-loaded samples (B) 10 wt% Cu-loaded samples (C) 15 wt% Cu-loaded samples; Figure S21: C3H6 conversion profiles vs. temperature (A) 5 wt% Cu-loaded samples (B) 10 wt% Cu-loaded samples (C) 15 wt% Cu-loaded samples; Figure S22: NO conversion profiles vs. temperature (A) 5 wt% Cu-loaded samples (B) 10 wt% Cu-loaded samples (C) 15 wt% Cu-loaded samples; Figure S23: C3H8 and CH4 conversion profiles vs. temperature (A) 5 wt% Cu-loaded samples (B) 10 wt% Cu-loaded samples (C) 15 wt% Cu-loaded samples; Table S1: Maximum conversion values, Light-off temperatures (T50), temperatures of 90% conversion in the case of CO and C3H6 and temperatures of max conversion in the case of C3H8, CH4 and NO for the different tested catalysts.

Author Contributions

T.V.E.: Conceptualization, Methodology, Investigation, Writing—Original Draft; A.P.: Conceptualization, Methodology, Investigation, Writing—Original Draft, Writing—Review and Editing, Supervision; R.-G.C.: Investigation; E.P.: Investigation; C.J.P.: Investigation, Resources; E.O.J.: Investigation; J.S.-A.: Investigation, Resources, Writing—Original Draft, Writing—Review and Editing; E.S.: Investigation, P.C.: Investigation, Resources, Writing—Review and Editing, Supervision; F.K.K.: Investigation, Resources, Writing—Review and Editing, Funding acquisition. All authors have read and agreed to the published version of the manuscript.

Funding

This research was partially funded by the European Union’s Horizon 2020 Project Partial-PGMs (H2020-NMP-686086). F.K.K. and E.S. would like to acknowledge the financial support from the project “National Infrastructure in Nanotechnology, Advanced Materials and Micro-/Nanoelectronics” INNOVATION-EL (MIS 5002772), which is implemented under the Action “Reinforcement of the Research and Innovation Infrastructure”, funded by the Operational Programme “Competitiveness, Entrepreneurship and Innovation” (NSRF 2014–2020) and co-financed by Greece and the European Union (European Regional Development Fund) and the NCSR Demokritos internal project No. EE11968, entitled “Synthesis and characterization of nanostructured materials for environmental applications”. J.S.A. would like to acknowledge financial support from MINECO (Project PID2019-108453GB-C21).

Data Availability Statement

Not applicable.

Acknowledgments

The authors thank the Johnson Matthey Technology Centre (Reading, UK) for supplying the commercial alumina and TECNAN-Lurederra (Navarra, Spain) for preparing the alumina via FSP. The authors acknowledge Thomas Kenis from ELCAT, University of Antwerp, for performing the ICP-MS measurements.

Conflicts of Interest

The authors declare no conflict of interest.

References

  1. Twigg, M.V. Catalytic control of emissions from cars. Catal. Today 2011, 163, 33–41. [Google Scholar] [CrossRef]
  2. Environmental Protection Agency. Federal Register Vol.79 No.81. 2014. Available online: https://www.govinfo.gov/content/pkg/FR-2014-04-28/pdf/2014-06954.pdf (accessed on 28 April 2014).
  3. Environmental Protection Agency (EPA). Amendments Related to: Tier 3 Motor Vehicle Emission and Fuel Standards, Environmental Protection Agency (EPA). 2016. Available online: https://www.epa.gov/regulations-emissions-vehicles-and-engines/final-rule-amendments-related-tier-3-motor-vehicle (accessed on 22 April 2016).
  4. Wilson, N.; Horrocks, J. Lessons from the removal of lead from gasoline for controlling other environmental pollutants: A case study from New Zealand. Environ. Health 2008, 7, 1. [Google Scholar] [CrossRef] [PubMed] [Green Version]
  5. Zhang, L.; Yao, X.; Lu, Y.; Sun, C.; Tang, C.; Gao, F.; Dong, L. Effect of precursors on the structure and activity of CuO-CoOx/γ-Al2O3 catalysts for NO reduction by CO. J. Colloid Interf. Sci. 2018, 509, 334–345. [Google Scholar] [CrossRef]
  6. Peneau, V.; Shaw, G.; Armstrong, R.D.; Jenkins, R.L.; Dimitratos, N.; Taylor, S.H.; Zanthoff, H.W.; Peitz, S.; Stochniol, G.; Hutchings, G.J. The partial oxidation of propane under mild aqueous conditions with H2O2 and ZSM-5 catalysts. Catal. Sci. Technol. 2016, 6, 7521–7531. [Google Scholar] [CrossRef] [Green Version]
  7. Yang, S.; Wang, J.; Chai, W.; Zhu, J.; Men, Y. Enhanced soot oxidation activity over CuO/CeO2 mesoporous nanosheets. Catal. Sci. Technol. 2019, 9, 1699–1709. [Google Scholar] [CrossRef]
  8. Chen, S.-Y.; Tang, W.; He, J.; Miao, R.; Lin, H.-J.; Song, W.; Wang, S.; Gao, P.-X.; Suib, S.L. Copper manganese oxide enhanced nanoarray-based monolithic catalysts for hydrocarbon oxidation. J. Mater. Chem. A 2018, 6, 19047–19057. [Google Scholar] [CrossRef]
  9. Patel, A.; Shukla, P.; Chen, J.; Rufford, T.E.; Wang, S.; Rudolph, V.; Zhu, Z. Structural sensitivity of mesoporous alumina for copper catalyst loading used for NO reduction in presence of CO. Chem. Eng. Res. Des. 2015, 101, 27–43. [Google Scholar] [CrossRef]
  10. Patel, A.; Rufford, T.; Rudolph, V.; Zhu, Z. Selective catalytic reduction of NO by CO over CuO supported on SBA-15: Effect of CuO loading on the activity of catalysts. Catal. Today 2011, 166, 188–193. [Google Scholar] [CrossRef]
  11. Lyu, X.; Wang, P.; Zhao, H.; Zhang, Y.; Meng, Z.; Lei, L. Migration mechanism on Cu species in CHA-type catalyst for the selective catalytic reduction of NOx during hydrothermal treatment. J. Environ. Chem. Eng. 2021, 9, 106413–106423. [Google Scholar] [CrossRef]
  12. Yoshida, H.; Hirakawa, T.; Oyama, H.; Nakashima, R.; Hinokuma, S.; Machida, M. Effect of Thermal Aging on Local Structure and Three-Way Catalysis of Cu/Al2O3. J. Phys. Chem. C 2019, 123, 10469–10476. [Google Scholar] [CrossRef]
  13. Yoshida, H.; Yamashita, N.; Ijichi, S.; Okabe, Y.; Misumi, S.; Hinokuma, S.; Machida, M. A Thermally Stable Cr–Cu Nanostructure Embedded in the CeO2 Surface as a Substitute for Platinum-Group Metal Catalysts. ACS Catal. 2015, 5, 6738–6747. [Google Scholar] [CrossRef]
  14. Renuka, N.; Shijina, A.; Praveen, A.; Aniz, C. Redox properties and catalytic activity of CuO/γ-Al2O3 meso phase. J. Colloid Interf. Sci. 2014, 434, 195–200. [Google Scholar] [CrossRef] [PubMed]
  15. Shimizu, K.-I.; Maeshima, H.; Yoshida, H.; Satsuma, A.; Hattori, T. Spectroscopic characterisation of Cu–Al2O3 catalysts for selective catalytic reduction of NO with propene. Phys. Chem. Chem. Phys. 2000, 2, 2435–2439. [Google Scholar] [CrossRef]
  16. Shimizu, K.-I.; Maeshima, H.; Satsuma, A.; Hattori, T. Transition metal-aluminate catalysts for NO reduction by C3H6. Appl. Catal. B Environ. 1998, 18, 163–170. [Google Scholar] [CrossRef]
  17. Patel, A.; Shukla, P.; Pan, G.T.; Chong, S.; Rudolph, V.; Zhu, Z. Influence of copper loading on mesoporous alumina for catalytic NO reduction in the presence of CO. J. Environ. Chem. Eng. 2017, 5, 2350–2361. [Google Scholar] [CrossRef]
  18. Prieto, G.; Zecevic, J.; Friedrich, H.; De Jong, K.P.; De Jongh, P.E. Towards stable catalysts by controlling collective properties of supported metal nanoparticles. Nat. Mater. 2012, 12, 34–39. [Google Scholar] [CrossRef]
  19. Xin, Q.; Glisenti, A.; Philippopoulos, C.; Poulakis, E.; Mertens, M.; Nyalosaso, J.L.; Meynen, V.; Cool, P. Comparison between a Water-Based and a Solvent-Based Impregnation Method towards Dispersed CuO/SBA-15 Catalysts: Texture, Structure and Catalytic Performance in Automotive Exhaust Gas Abatement. Catalysts 2016, 6, 164. [Google Scholar] [CrossRef] [Green Version]
  20. Xin, Q.; Papavasiliou, A.; Boukos, N.; Glisenti, A.; Li, J.P.H.; Yang, Y.; Philippopoulos, C.J.; Poulakis, E.; Katsaros, F.K.; Meynen, V.; et al. Preparation of CuO/SBA-15 catalyst by the modified ammonia driven deposition precipitation method with a high thermal stability and an efficient automotive CO and hydrocarbons conversion. Appl. Catal. B Environ. 2018, 223, 103–115. [Google Scholar] [CrossRef]
  21. Jiao, L.; Regalbuto, J.R. The synthesis of highly dispersed noble and base metals on silica via strong electrostatic adsorption: I. Amorphous silica. J. Catal. 2008, 260, 329–341. [Google Scholar] [CrossRef]
  22. Ge, C.; Liu, L.; Liu, Z.; Yao, X.; Cao, Y.; Tang, C.; Gao, F.; Dong, L. Improving the dispersion of CeO2 on γ-Al2O3 to enhance the catalytic performances of CuO/CeO2/γ-Al2O3 catalysts for NO removal by CO. Catal. Commun. 2014, 51, 95–99. [Google Scholar] [CrossRef]
  23. Yan, Q.; Chen, S.; Zhang, C.; O’Hare, D.; Wang, Q. Synthesis of Cu0.5Mg1.5Mn0.5Al0.5Ox mixed oxide from layered double hydroxide precursor as highly efficient catalyst for low-temperature selective catalytic reduction of NOx with NH3. J. Colloid Interf. Sci. 2018, 526, 63–74. [Google Scholar] [CrossRef] [PubMed]
  24. Wu, W.; Wan, Z.; Chen, W.; Zhu, M.; Zhang, D. Synthesis of mesoporous alumina with tunable structural properties. Microporous Mesoporous Mater. 2015, 217, 12–20. [Google Scholar] [CrossRef]
  25. Yuan, Q.; Yin, A.-X.; Luo, C.; Sun, L.-D.; Zhang, Y.-W.; Duan, W.-T.; Liu, A.H.-C.; Yan, C.-H. Facile Synthesis for Ordered Mesoporous γ-Aluminas with High Thermal Stability. J. Am. Chem. Soc. 2008, 130, 3465–3472. [Google Scholar] [CrossRef]
  26. Cai, W.; Yu, J.; Anand, C.; Vinu, A.; Jaroniec, M. Facile Synthesis of Ordered Mesoporous Alumina and Alumina-Supported Metal Oxides with Tailored Adsorption and Framework Properties. Chem. Mater. 2011, 23, 1147–1157. [Google Scholar] [CrossRef]
  27. Wu, W.; Wan, Z.; Zhu, M.; Zhang, D. A facile route to aqueous phase synthesis of mesoporous alumina with controllable structural properties. Microporous Mesoporous Mater. 2016, 223, 203–212. [Google Scholar] [CrossRef] [Green Version]
  28. Yuan, Q.; Duan, H.-H.; Li, L.-L.; Li, Z.-X.; Duan, W.-T.; Zhang, L.-S.; Song, W.-G.; Yan, C.-H. Homogeneously Dispersed Ceria Nanocatalyst Stabilized with Ordered Mesoporous Alumina. Adv. Mater. 2010, 22, 1475–1478. [Google Scholar] [CrossRef] [PubMed]
  29. Hafshejani, L.D.; Tangsir, S.; Koponen, H.; Riikonen, J.; Karhunen, T.; Tapper, U.; Lehto, V.-P.; Moazed, H.; Naseri, A.A.; Hooshmand, A.; et al. Synthesis and characterization of Al2O3 nanoparticles by flame spray pyrolysis (FSP)—Role of Fe ions in the precursor. Powder Technol. 2016, 298, 42–49. [Google Scholar] [CrossRef]
  30. Chen, L.; Horiuchi, T.; Osaki, T.; Mori, T. Catalytic selective reduction of NO with propylene over Cu-Al2O3 catalysts: Influence of catalyst preparation method. Appl. Catal. B Environ. 1999, 23, 259–269. [Google Scholar] [CrossRef]
  31. Guo, X.; Yin, A.; Dai, W.-L.; Fan, K. One Pot Synthesis of Ultra-High Copper Contented Cu/SBA-15 Material as Excellent Catalyst in the Hydrogenation of Dimethyl Oxalate to Ethylene Glycol. Catal. Lett. 2009, 132, 22–27. [Google Scholar] [CrossRef]
  32. Lopez-Suarez, F.E.; Bueno-López, A.; Illán-Gómez, M. Cu/Al2O3 catalysts for soot oxidation: Copper loading effect. Appl. Catal. B Environ. 2008, 84, 651–658. [Google Scholar] [CrossRef] [Green Version]
  33. Thommes, M.; Kaneko, K.; Neimark, A.V.; Olivier, J.P.; Rodriguez-Reinoso, F.; Rouquerol, J.; Sing, K.S.W. Physisorption of gases, with special reference to the evaluation of surface area and pore size distribution (IUPAC Technical Report). Pure Appl. Chem. 2015, 87, 1051–1069. [Google Scholar] [CrossRef] [Green Version]
  34. Papavasiliou, A.; Van Everbroeck, T.; Blonda, C.; Oliani, B.; Sakellis, E.; Cool, P.; Canu, P.; Katsaros, F.K. Mesoporous CuO/TiO2 catalysts prepared by the ammonia driven deposition precipitation method for CO preferential oxidation: Effect of metal loading. Fuel 2022, 311, 122491. [Google Scholar] [CrossRef]
  35. Strohmeier, B.R.; Levden, D.E.; Field, R.S.; Hercules, D.M. Surface spectroscopic characterization of Cu/Al2O3 catalysts. J. Catal. 1985, 94, 514–530. [Google Scholar] [CrossRef]
  36. Liu, Y.; Cheng, B.; Wang, K.-K.; Ling, G.-P.; Cai, J.; Song, C.-L.; Han, G.-R. Study of Raman spectra for γ-Al2O3 models by using first-principles method. Solid State Commun. 2014, 178, 16–22. [Google Scholar] [CrossRef]
  37. Le Nestour, A.; Gaudon, M.; Villeneuve, G.; Daturi, M.; Andriessen, A.R.; Demourgues, A. Defects in Divided Zinc−Copper Aluminate Spinels: Structural Features and Optical Absorption Properties. Inorg. Chem. 2007, 46, 4067–4078. [Google Scholar] [CrossRef]
  38. Ertl, G.; Hierl, R.; Knözinger, H.; Thiele, N.; Urbach, H. XPS study of copper aluminate catalysts. Appl. Surf. Sci. 1980, 5, 49–64. [Google Scholar] [CrossRef]
  39. Tikhov, S.; Sadykov, V.; Kryukova, G.; Paukshtis, E.; Popovskii, V.; Starostina, T.; Kharlamov, G.; Anufrienko, V.; Poluboyarov, V.; Razdobarov, V. Microstructural and spectroscopic investigations of the supported copperalumina oxide system: Nature of aging in oxidizing reaction media. J. Catal. 1992, 134, 506–524. [Google Scholar] [CrossRef]
  40. Severino, F.; Brito, J.L.; Laine, J.; Fierro, J.; Agudo, A. Nature of Copper Active Sites in the Carbon Monoxide Oxidation on CuAl2O4 and CuCr2O4 Spinel Type Catalysts. J. Catal. 1998, 177, 82–95. [Google Scholar] [CrossRef]
  41. Papavasiliou, A.; Deze, E.; Papageorgiou, S.; Sideratou, Z.; Boukos, N.; Poulakis, E.; Philippopoulos, C.; Glisenti, A.; Van Everbroeck, T.; Cool, P.; et al. A hyperbranched polymer synthetic strategy for the efficient fixation of metal species within nanoporous structures: Application in automotive catalysis. Chem. Eng. J. 2021, 421, 129496. [Google Scholar] [CrossRef]
  42. Jabłońska, M.; Beale, A.M.; Nocuń, M.; Palkovits, R. Ag-Cu based catalysts for the selective ammonia oxidation into nitrogen and water vapour. Appl. Catal. B Environ. 2018, 232, 275–287. [Google Scholar] [CrossRef] [Green Version]
  43. Amano, F.; Suzuki, S.; Yamamoto, T.; Tanaka, T. One-electron reducibility of isolated copper oxide on alumina for selective NO–CO reaction. Appl. Catal. B Environ. 2006, 64, 282–289. [Google Scholar] [CrossRef]
  44. Zhou, R.-X.; Yu, T.-M.; Jiang, X.-Y.; Chen, F.; Zheng, X.-M. Temperature-programmed reduction and temperature-programmed desorption studies of CuO/ZrO2 catalysts. Appl. Surf. Sci. 1999, 148, 263–270. [Google Scholar] [CrossRef]
  45. Wang, X.; Wang, J.; Liu, A.; Yu, Y.; Ji, J.; Guo, K.; Wan, H.; Tang, C.; Dong, L. Unravelling the structure sensitivity of CuO/SiO2 catalysts in the NO + CO reaction. Catal. Sci. Technol. 2020, 10, 3848–3856. [Google Scholar] [CrossRef]
  46. Urrutxua, M.; Pereda-Ayo, B.; De-La-Torre, U.; González-Velasco, J.R. Evaluation of Cu/SAPO-34 Catalysts Prepared by Solid-State and Liquid Ion-Exchange Methods for NOx Removal by NH3-SCR. ACS Omega 2019, 4, 14699–14713. [Google Scholar] [CrossRef] [PubMed] [Green Version]
  47. Friedman, R.M.; Freeman, J.J.; Lytle, F.W. Characterization of CuAl2O3 catalysts. J. Catal. 1978, 55, 10–28. [Google Scholar] [CrossRef]
  48. Ham, H.; Kim, J.; Cho, S.J.; Choi, J.-H.; Moon, D.J.; Bae, J.W. Enhanced Stability of Spatially Confined Copper Nanoparticles in an Ordered Mesoporous Alumina for Dimethyl Ether Synthesis from Syngas. ACS Catal. 2016, 6, 5629–5640. [Google Scholar] [CrossRef]
  49. Wolberg, A.; Roth, J. Copper oxide supported on alumina III. X-ray K-absorption edge studies of the Cu2+ species. J. Catal. 1969, 15, 250–255. [Google Scholar] [CrossRef]
  50. Fu, L.; Li, X.; Liu, M.; Yang, H. Insights into the nature of Cu doping in amorphous mesoporous alumina. J. Mater. Chem. A 2013, 1, 14592–14605. [Google Scholar] [CrossRef]
  51. Zhu, Z.; Zhu, H.; Wang, S.; Lu, G. Preparation and Characterization of Copper Catalysts Supported on Mesoporous Al2O3Nanofibers for N2O Reduction to N2. Catal. Lett. 2003, 91, 73–81. [Google Scholar] [CrossRef]
  52. Gang, L.; van Grondelle, J.; Anderson, B.G.; van Santen, R.A. Selective Low Temperature NH3 Oxidation to N2 on Copper-Based Catalysts. J. Catal. 1999, 186, 100–109. [Google Scholar] [CrossRef]
  53. Van Everbroeck, T.; Ciocarlan, R.-G.; Van Hoey, W.; Mertens, M.; Cool, P. Copper-Containing Mixed Metal Oxides (Al, Fe, Mn) for Application in Three-Way Catalysis. Catalysts 2020, 10, 1344. [Google Scholar] [CrossRef]
  54. Qian, J.; Hou, X.; Qin, Z.; Li, B.; Tong, Z.; Dong, L.; Dong, L. Enhanced catalytic properties of Cu-based composites for NOx reduction with coexistence and intergrowth effect. Fuel 2018, 234, 296–304. [Google Scholar] [CrossRef]
  55. Hirakawa, T.; Shimokawa, Y.; Tokuzumi, W.; Sato, T.; Tsushida, M.; Yoshida, H.; Ohyama, J.; Machida, M. Multicomponent 3d Transition-Metal Nanoparticles as Catalysts Free of Pd, Pt, or Rh for Automotive Three-Way Catalytic Converters. ACS Appl. Nano Mater. 2020, 3, 9097–9107. [Google Scholar] [CrossRef]
  56. Norouzzadeh, P.; Mabhouti, K.; Golzan, M.; Naderali, R. Investigation of structural, morphological and optical characteristics of Mn substituted Al-doped ZnO NPs: A Urbach energy and Kramers-Kronig study. Optik 2020, 204, 164227. [Google Scholar] [CrossRef]
Figure 1. N2-physisorption isotherms (left) and pore size distributions (PSD) (right) of the alumina supports.
Catalysts 12 00628 g001
Figure 2. Low-angle (left) and wide-angle (right) XRD patterns of the different alumina supports.
Catalysts 12 00628 g002
Figure 3. SEM micrographs of the different parent alumina materials. (A) Al(1), (B) Al(2), (C) Al(3), (D) Al(4).
Catalysts 12 00628 g003
Figure 4. NH3-TPD measurements of the different alumina materials.
Catalysts 12 00628 g004
Figure 5. Wide-angle XRD patterns of the (A) 5 wt%, (B) 10 wt% and (C) 15 wt% Cu-loaded samples.
Catalysts 12 00628 g005
Figure 6. SEM micrographs of (A) 5CuAl(1), (B) 5CuAl(2), (C) 5CuAl(3) and (D) 5CuAl(4) samples.
Catalysts 12 00628 g006
Figure 7. BSE images of (A) 15CuAl(1), (B) 15CuAl(2), (C) 15CuAl(3) and (D) 15CuAl(4) samples.
Catalysts 12 00628 g007
Figure 8. (A) SAED pattern, (B) HAADF STEM image and (C,D) EDS mapping images of 15CuAl(1) sample.
Catalysts 12 00628 g008
Figure 9. (A) HAADF STEM image and (BD) EDS mapping images of 15CuAl(2) sample.
Catalysts 12 00628 g009
Figure 10. UV-VIS-DR spectra of (A) 5 wt% Cu-loaded aluminas, (B) 10 wt% Cu-loaded aluminas and (C) 15 wt% Cu-loaded aluminas.
Catalysts 12 00628 g010
Figure 11. XPS characterization of the Cu 2p3/2 transition for (A) 15 Cu Al(1), (B) 15 Cu Al(2), (C) 15 Cu Al(3), (D) 15 Cu Al(4) samples.
Catalysts 12 00628 g011
Figure 12. H2-TPR profiles of the Cu-loaded aluminas: (A) Cu Al(1), (B) Cu Al(2), (C) Cu Al(3) and (D) Cu Al(4) sample series.
Catalysts 12 00628 g012
Figure 13. Light-off temperature (T50) as a function of Cu loading.
Catalysts 12 00628 g013
Table 1. Overview of the samples.
SampleMethod for Al2O3Cu wt%
Al(1)Ethanol-
5Cu Al(1)Ethanol5
10Cu Al(1)Ethanol10
15Cu Al(1)Ethanol15
Al(2)Water-
5Cu Al(2)Water5
10Cu Al(2)Water10
15Cu Al(2)Water15
Al(3)Commercial-
5Cu Al(3)Commercial5
10Cu Al(3)Commercial10
15Cu Al(3)Commercial15
Al(4)FSP-
5Cu Al(4)FSP5
10Cu Al(4)FSP10
15Cu Al(4)FSP15
Table 2. Properties of the alumina supports: N2-sorption-derived data and desorbed NH3 amount from NH3-TPD. BET SSA = BET specific surface area, TPV = total pore volume, APD = average pore diameter.
SampleBET SSA
m2 g−1
TPV
cc g−1
APD
nm
NH3 (m/z = 16)
µmol g−1
Al(1)2860.456.366
Al(2)3241.181894
Al(3)1270.423032
Al(4)1120.21326
Table 3. Porosity characteristics of the catalysts derived from N2-sorption and mean CuO crystallite size (nm) calculated from the XRD patterns with the Scherrer equation applied to the (111) diffraction peak of CuO.
SampleBET SSA
m2 g−1
TPV
cc g−1
APD
nm
Mean Crystal Size nm
5Cu Al(1)2560.274.3-
10Cu Al(1)2500.243.9-
15Cu Al(1)2410.254.2-
5Cu Al(2)2880.658-
10Cu Al(2)2580.7510-
15Cu Al(2)2650.801321
5Cu Al(3)1200.3930-
10Cu Al(3)1050.423120
15Cu Al(3)1070.443220
5Cu Al(4)1000.2710-
10Cu Al(4)960.341819
15Cu Al(4)790.261318
Table 4. XPS data including a maximum of the peak, b % Cu0 derived from the deconvoluted peak at 932.8 eV, c surface content Cu derived from XPS data, d Cu content derived from ICP-MS data and e Cu to Al atomic ratio.
SampleCu 2p3/2 BE (eV) a% Cu0 bAl 2p BE (eV) aCu Surf. (wt%) cCu
(wt%) d
Cu/Al Atomic Ratio e
15 Cu Al(1)934.882974.488.8813.52.4
15 Cu Al(2)934.583474.087.814.92
15 Cu Al(3)933.084374.186.5514.41.5
15 Cu Al(4)933.284174.087.8914.21.9
Table 5. Composition of the reaction gas mixture in stoichiometric condition. N2 was used as balance gas.
GasCOCH4C3H6C3H8CO2H2OH2O2NO
Vol. %0.70.02250.04500.022515100.2330.7770.1
Publisher’s Note: MDPI stays neutral with regard to jurisdictional claims in published maps and institutional affiliations.

