

Preclinical Development of Antisense Oligonucleotides to Rescue Aberrant Splicing Caused by an Ultrarare ABCA4 Variant in a Child with Early-Onset Stargardt Disease

 , , , , and
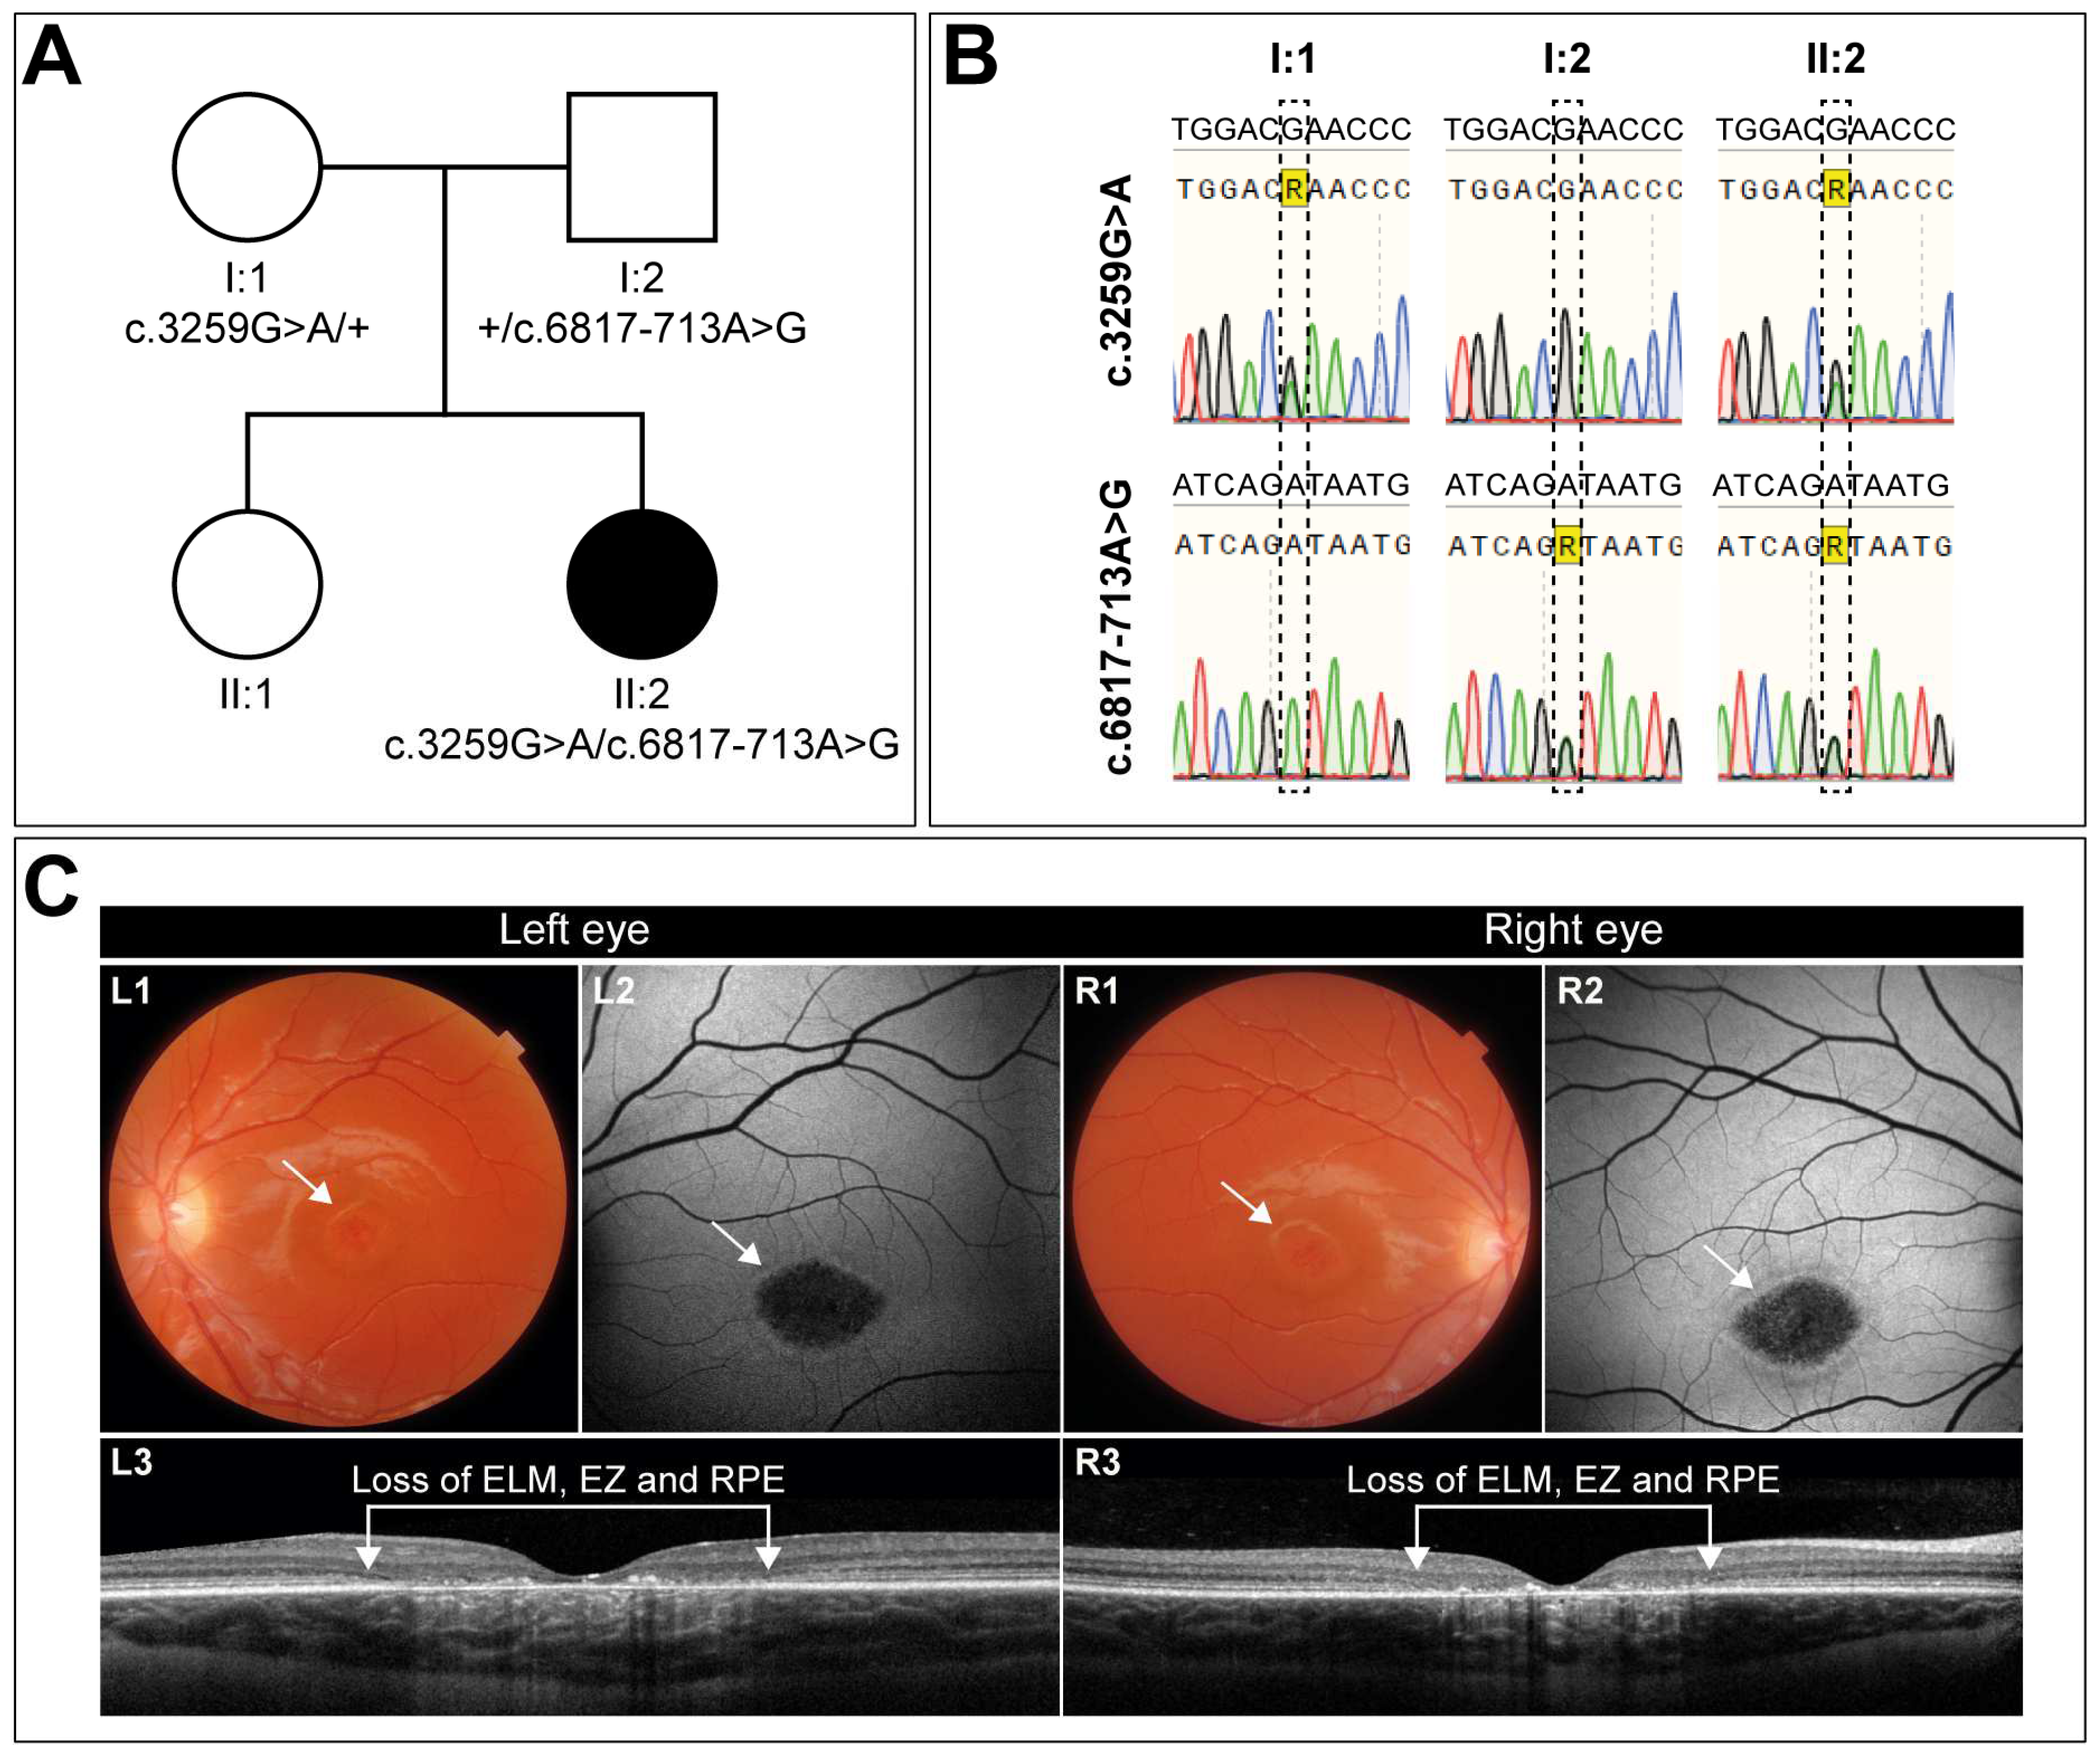
Abstract
:1. Introduction
2. Materials and Methods
2.1. Clinical Evaluation
2.2. Antisense Oligonucleotide Design
2.3. Generation of Wild-Type and c.6817-713A>G ABCA4 Splice Vectors
2.4. Cloning of PE in ABCA4 cDNA Vector
2.5. In Vitro AON Rescue Studies in HEK293T Cells
2.6. ABCA4 cDNA Vector Transfection in HEK293T Cells
2.7. AON Rescue Studies in Patient-Derived Fibroblasts
2.8. Patient-Derived iPSC Culture Conditions
2.9. iPSC Differentiation to PPCs
2.10. AON Rescue Studies in Patient-Derived PPCs
2.11. RNA Isolation and cDNA Synthesis
2.12. PPC Characterization by qPCR
2.13. iPSC Characterization
2.14. ABCA4 Transcript Analysis
2.15. Protein Isolation and Western Blot Analysis
2.16. Statistical Analysis
3. Results
3.1. Clinical Characterization of a Case with Early-Onset STGD1 Reveals Symmetric Disease Development between the Two Eyes
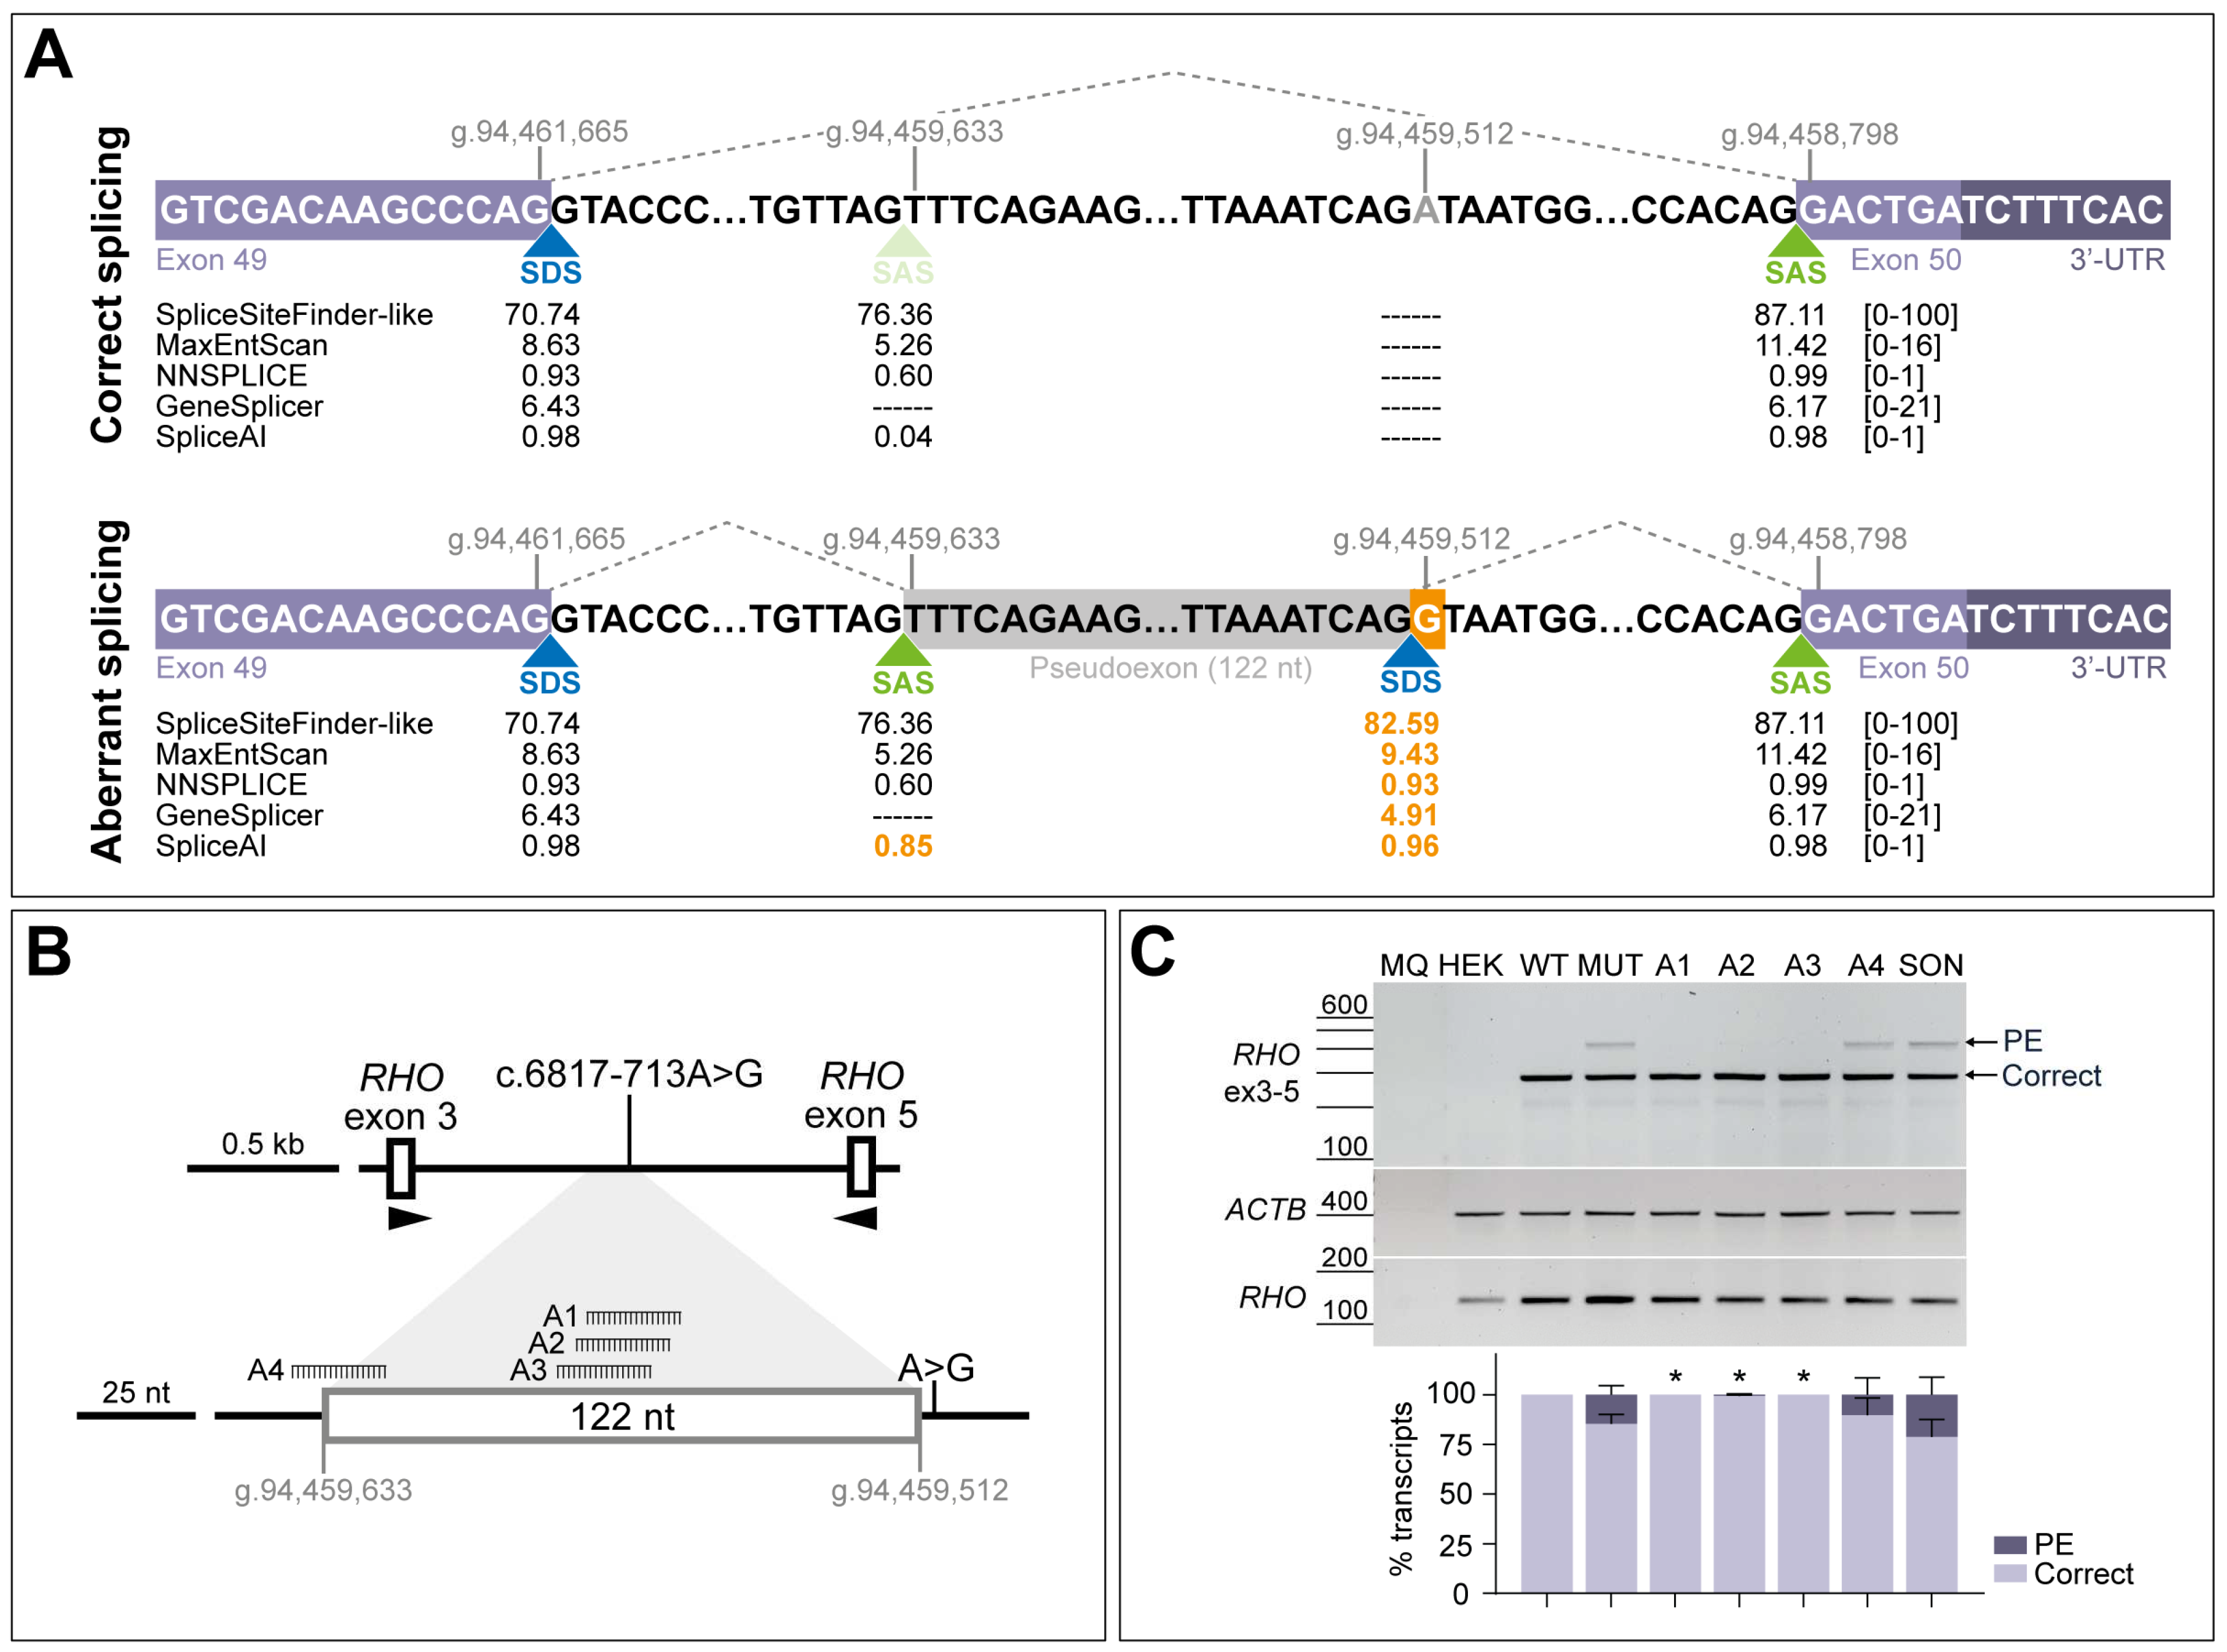
3.2. AONs Can Rescue the Splicing Defect Caused by c.6817-713A>G in Minigene Assays
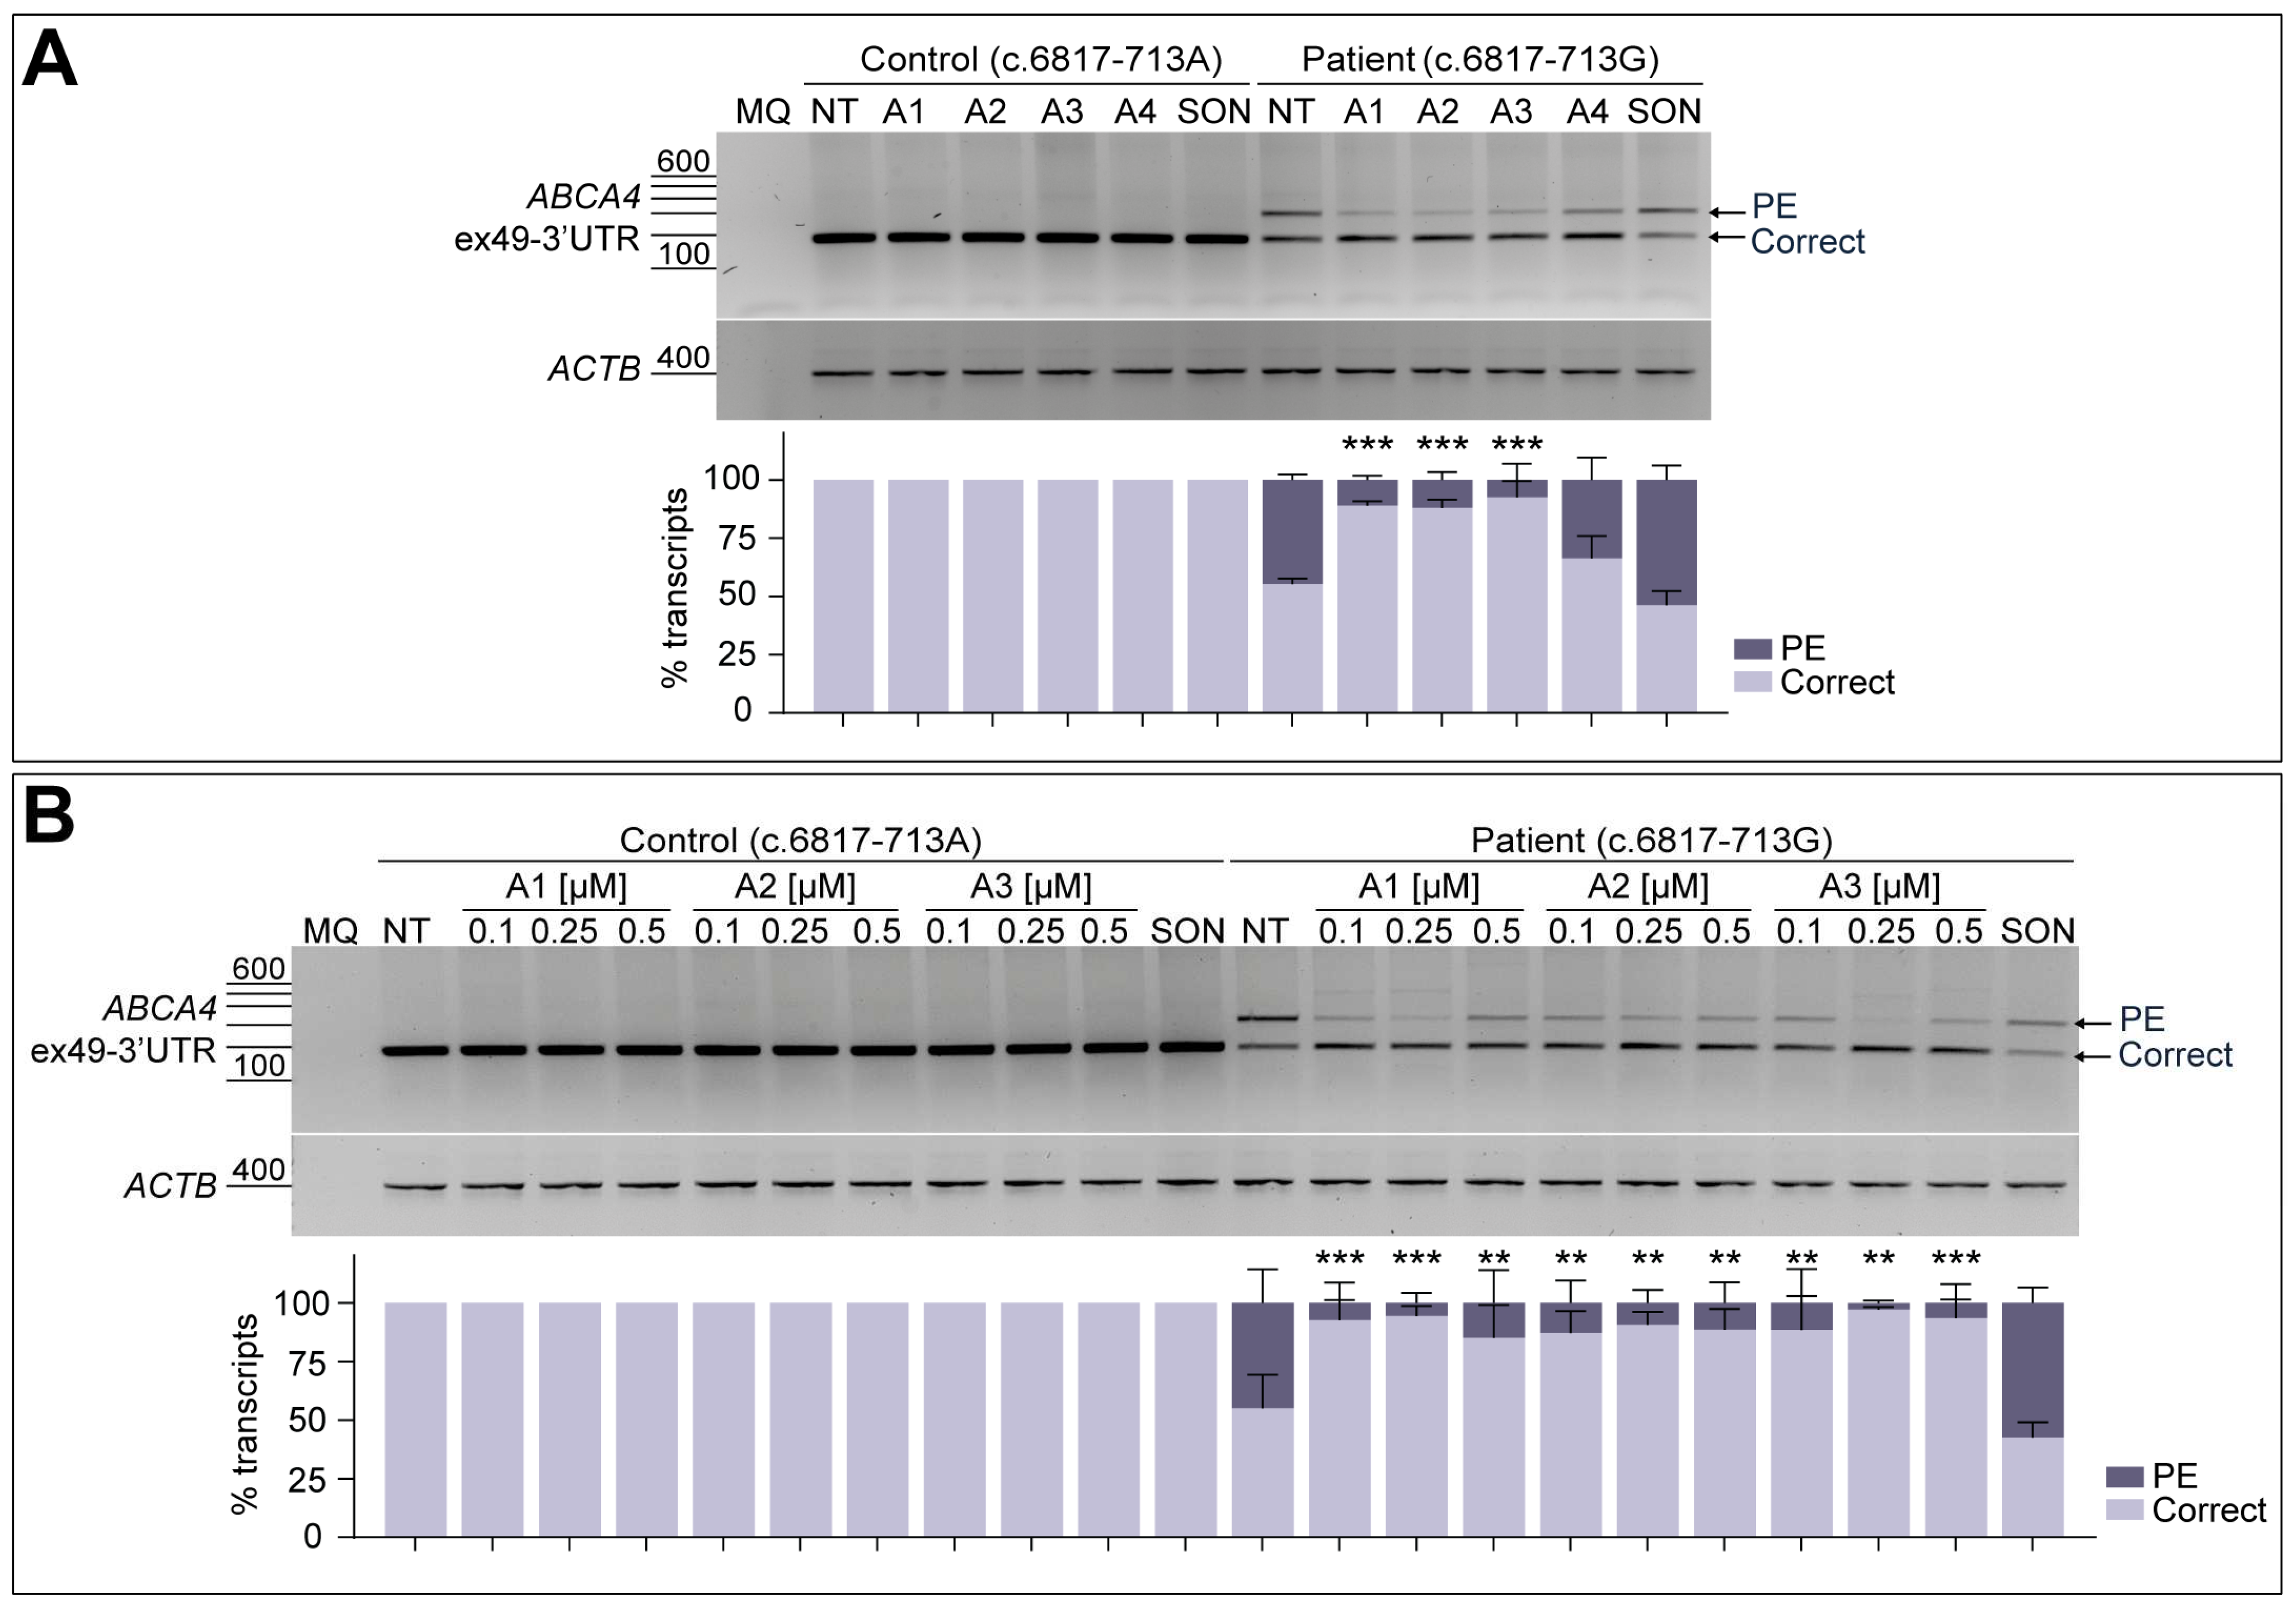
3.3. AON-Driven Splicing Correction Is Recapitulated in Patient-Derived Fibroblasts
3.4. Patient-Derived Fibroblasts Were Successfully Reprogrammed into Induced Pluripotent Stem Cells (iPSCs)
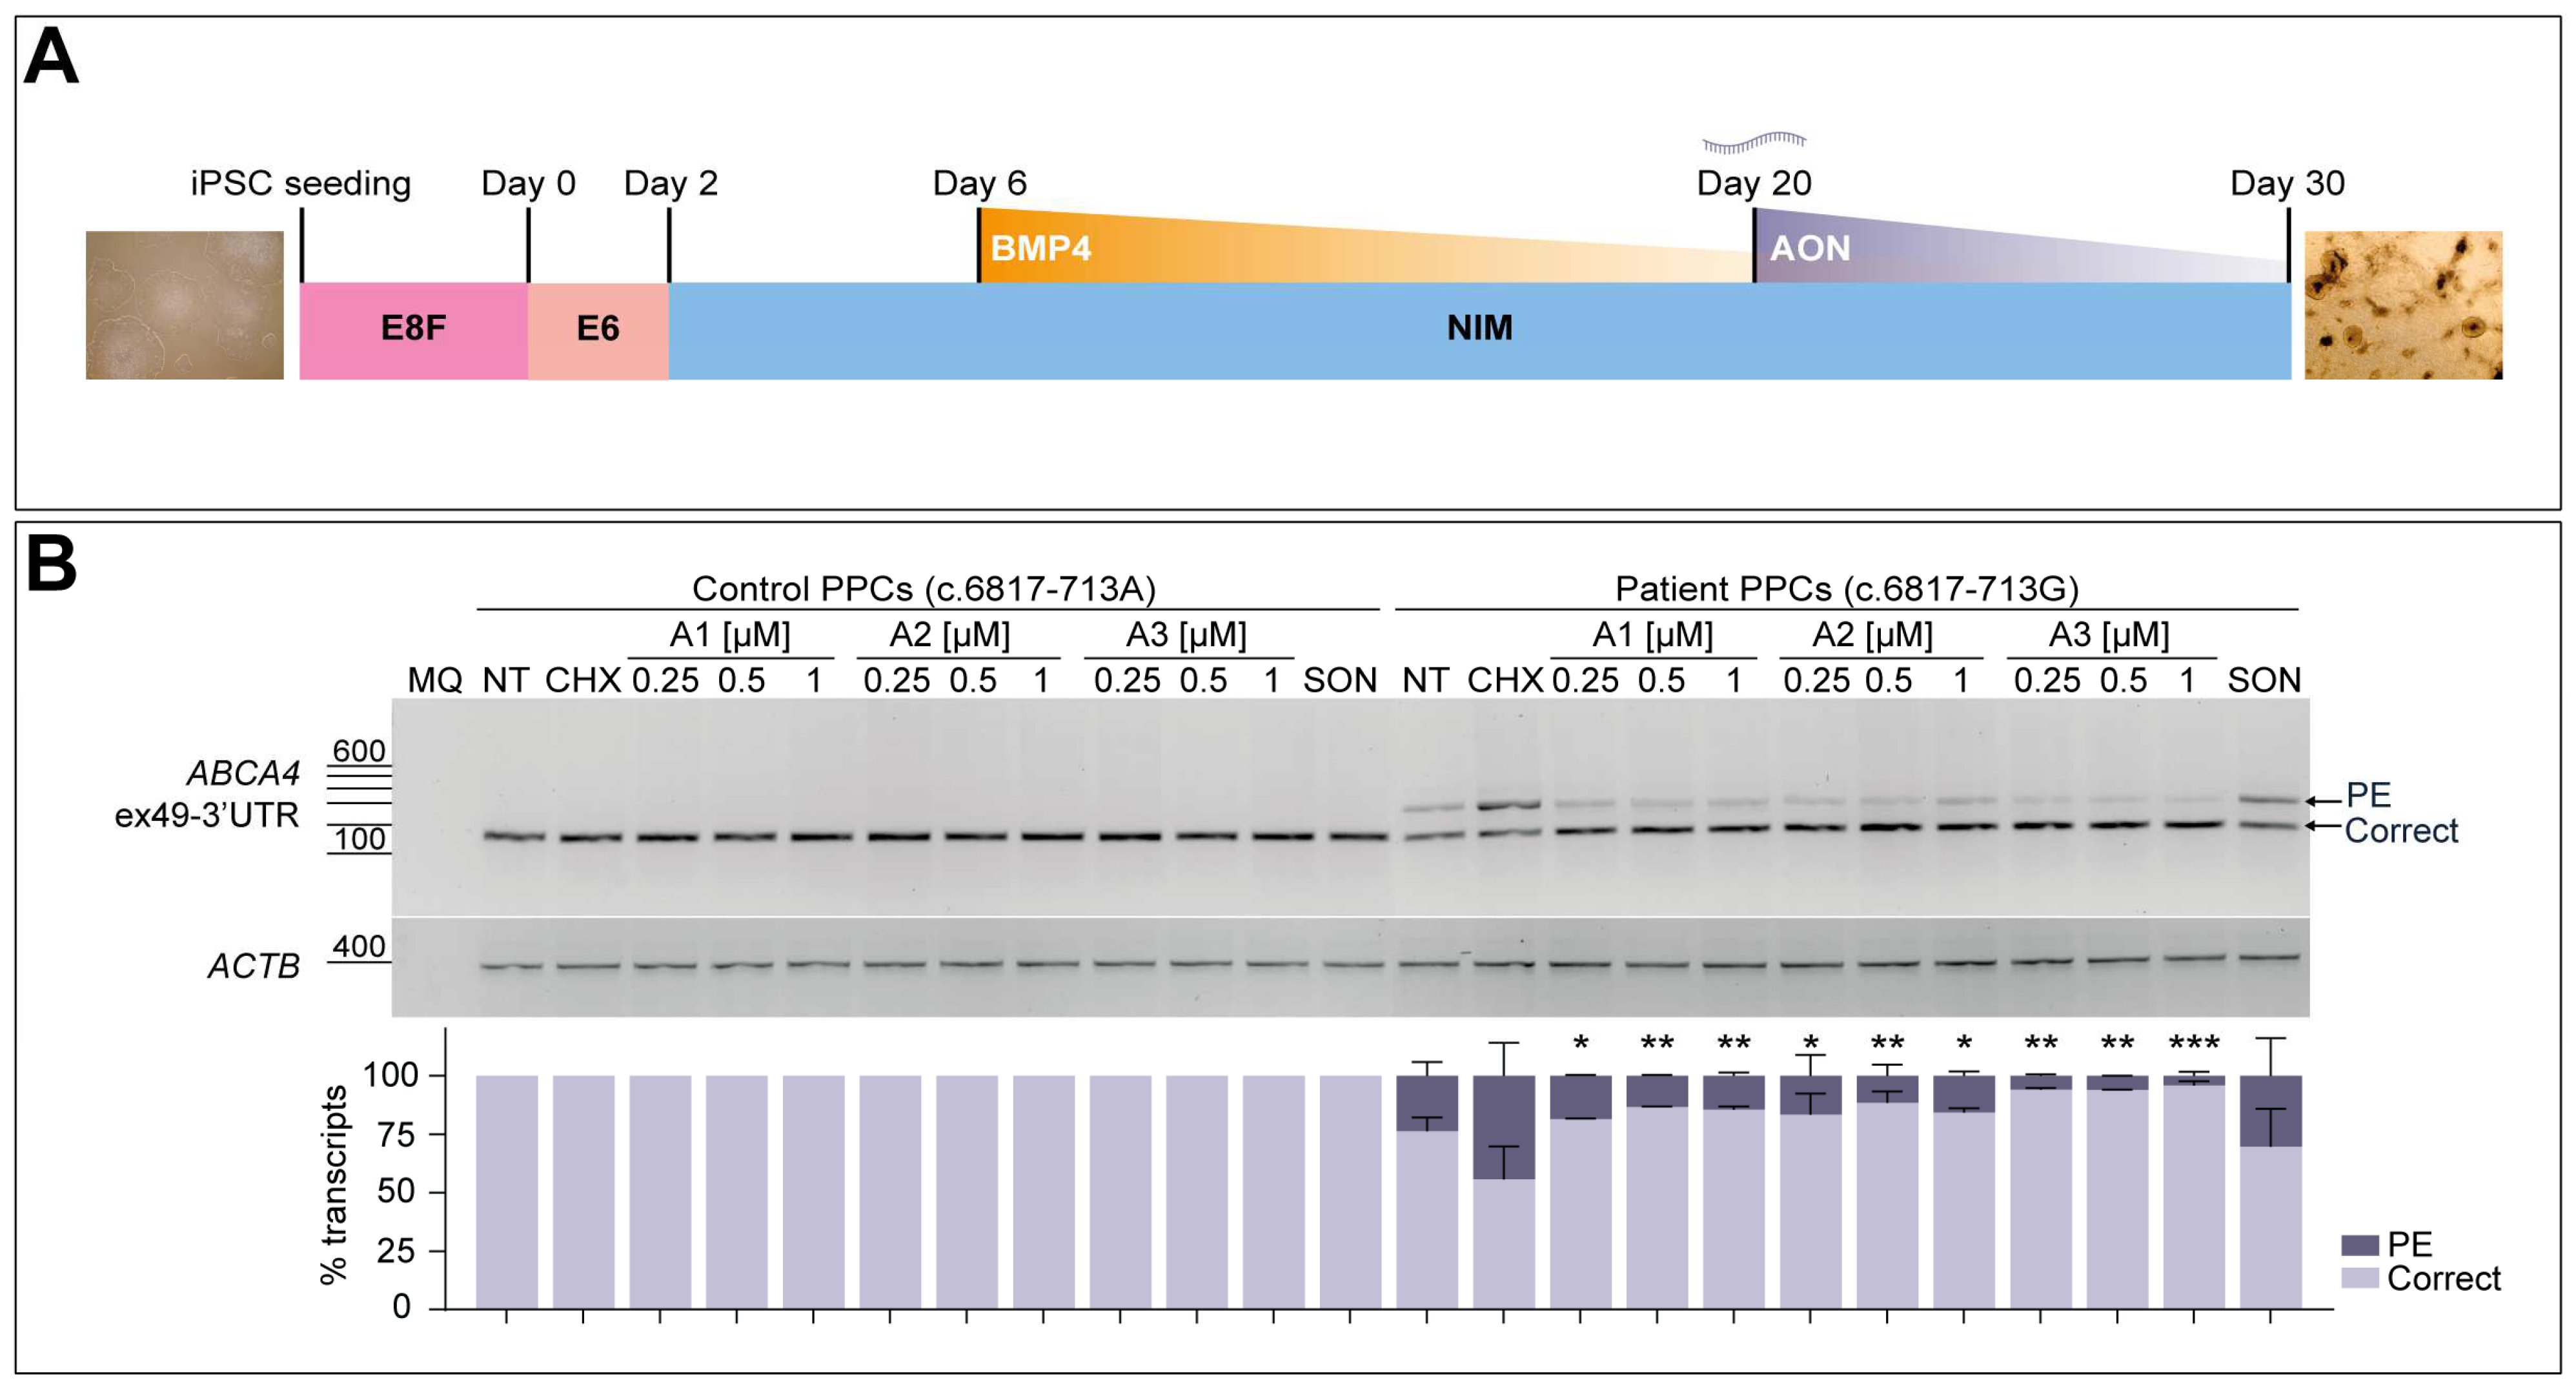
3.5. AON Lead Candidates Effectively Rescue Aberrant Splicing in Patient-Derived PPCs
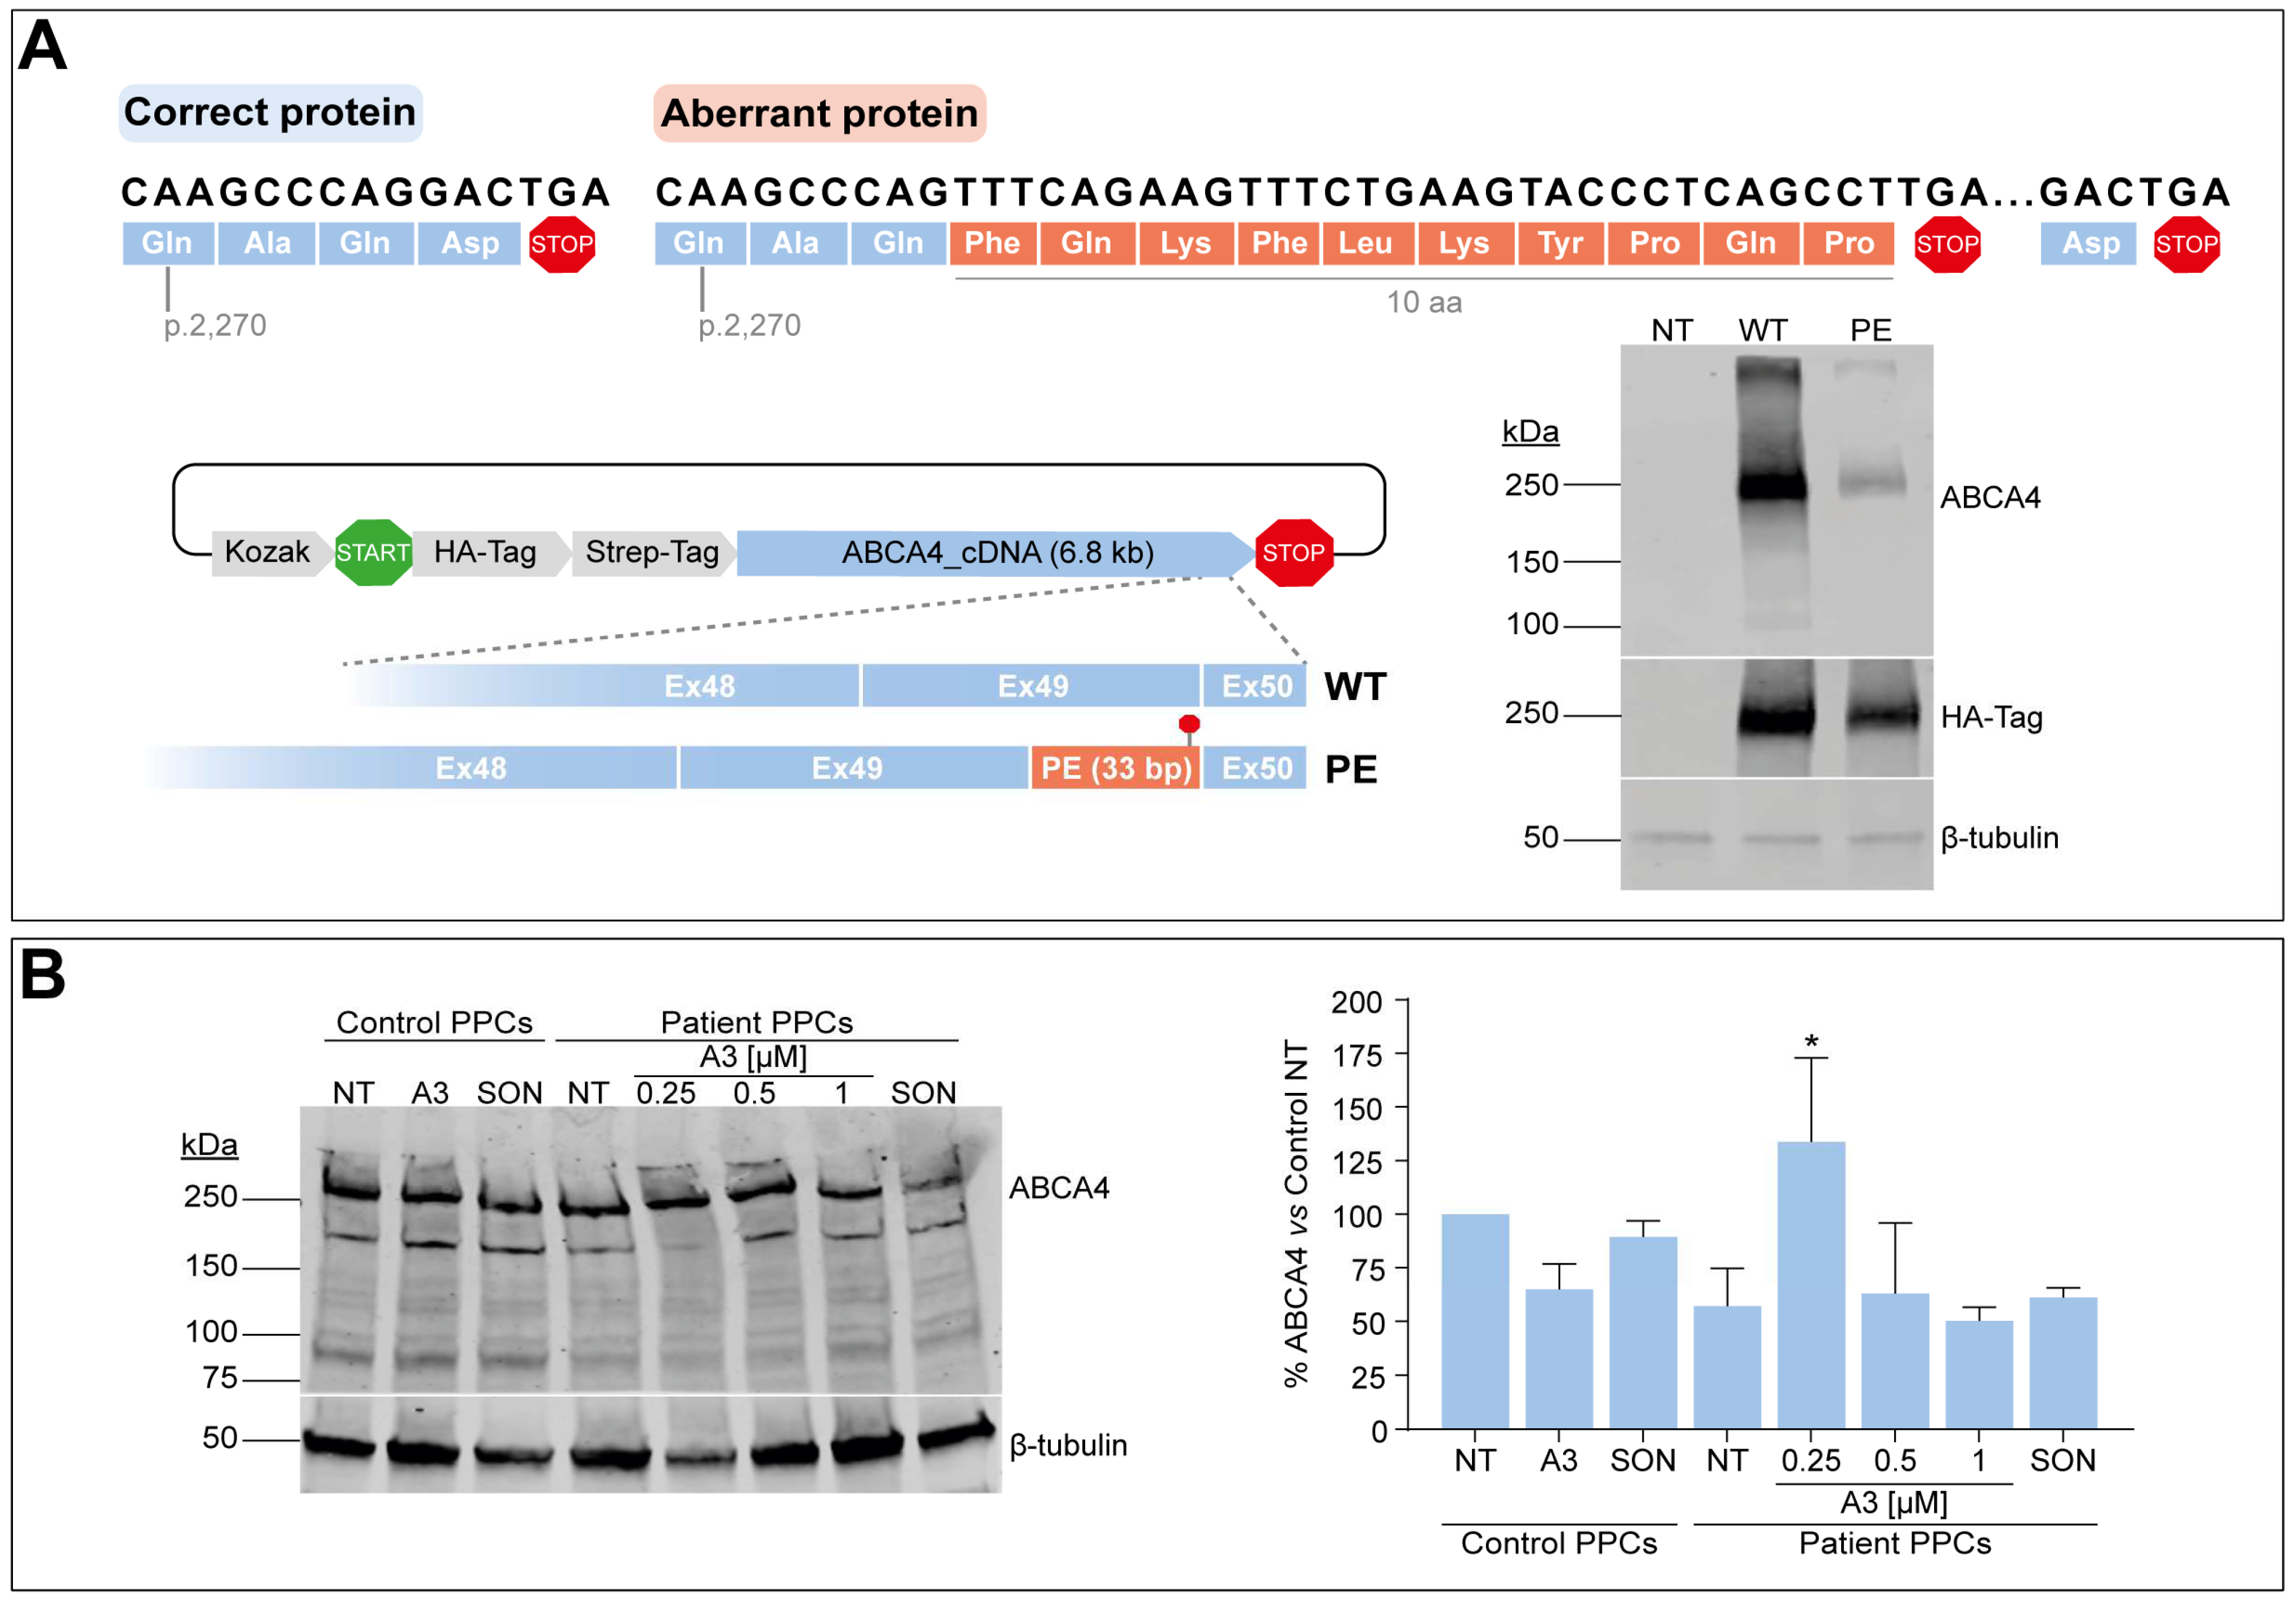
3.6. C-Terminal Domain Alteration Affect ABCA4 Protein Levels and Might Be Amenable to AON-Based Correction
4. Discussion
5. Conclusions
6. Patents
Supplementary Materials
Author Contributions
Funding
Institutional Review Board Statement
Informed Consent Statement
Data Availability Statement
Acknowledgments
Conflicts of Interest
References
- Defelippe, V.M.; Ghislaine, J.M.W.v.T.; Otte, W.M.; Schutgens, R.E.G.; Stunnenberg, B.; Cross, H.J.; O’Callaghan, F.; De Giorgis, V.; Jansen, F.E.; Perucca, E.; et al. Toward responsible clinical n-of-1 strategies for rare diseases. Drug Discov. Today 2023, 28, 103688. [Google Scholar] [CrossRef]
- McDonald, S.; Nikles, J. N-of-1 Trials in Healthcare. Healthcare 2021, 9, 330. [Google Scholar] [CrossRef]
- Schork, N.J.; Beaulieu-Jones, B.; Liang, W.S.; Smalley, S.; Goetz, L.H. Exploring human biology with N-of-1 clinical trials. Camb. Prism. Precis. Med. 2023, 1, e12. [Google Scholar] [CrossRef]
- Georgiou, M.; Fujinami, K.; Michaelides, M. Inherited retinal diseases: Therapeutics, clinical trials and end points-A review. Clin. Exp. Ophthalmol. 2021, 49, 270–288. [Google Scholar] [CrossRef]
- Molday, R.S.; Garces, F.A.; Scortecci, J.F.; Molday, L.L. Structure and function of ABCA4 and its role in the visual cycle and Stargardt macular degeneration. Prog. Retin. Eye Res. 2022, 89, 101036. [Google Scholar] [CrossRef]
- Quazi, F.; Lenevich, S.; Molday, R.S. ABCA4 is an N-retinylidene-phosphatidylethanolamine and phosphatidylethanolamine importer. Nat. Commun. 2012, 3, 925. [Google Scholar] [CrossRef]
- Cremers, F.P.M.; Lee, W.; Collin, R.W.J.; Allikmets, R. Clinical spectrum, genetic complexity and therapeutic approaches for retinal disease caused by ABCA4 mutations. Prog. Retin. Eye Res. 2020, 79, 100861. [Google Scholar] [CrossRef]
- Khan, M.; Cornelis, S.S.; Pozo-Valero, M.D.; Whelan, L.; Runhart, E.H.; Mishra, K.; Bults, F.; AlSwaiti, Y.; AlTalbishi, A.; De Baere, E.; et al. Resolving the dark matter of ABCA4 for 1054 Stargardt disease probands through integrated genomics and transcriptomics. Genet. Med. 2020, 22, 1235–1246. [Google Scholar] [CrossRef]
- Corradi, Z.; Khan, M.; Hitti-Malin, R.; Mishra, K.; Whelan, L.; Cornelis, S.S.; Hoyng, C.B.; Kämpjärvi, K.; Klaver, C.C.W.; Liskova, P.; et al. Targeted sequencing and in vitro splice assays shed light on ABCA4-associated retinopathies missing heritability. Hum. Genet. Genom. Adv. 2023, 4, 100237. [Google Scholar] [CrossRef]
- Hammond, S.M.; Wood, M.J. Genetic therapies for RNA mis-splicing diseases. Trends Genet. 2011, 27, 196–205. [Google Scholar] [CrossRef] [PubMed]
- Tomkiewicz, T.Z.; Nieuwenhuis, S.E.; Cremers, F.P.M.; Garanto, A.; Collin, R.W.J. Correction of the Splicing Defect Caused by a Recurrent Variant in ABCA4 (c.769-784C>T) That Underlies Stargardt Disease. Cells 2022, 11, 3947. [Google Scholar] [CrossRef]
- Tomkiewicz, T.Z.; Suarez-Herrera, N.; Cremers, F.P.M.; Collin, R.W.J.; Garanto, A. Antisense Oligonucleotide-Based Rescue of Aberrant Splicing Defects Caused by 15 Pathogenic Variants in ABCA4. Int. J. Mol. Sci. 2021, 22, 4621. [Google Scholar] [CrossRef]
- Khan, M.; Arno, G.; Fakin, A.; Parfitt, D.A.; Dhooge, P.P.A.; Albert, S.; Bax, N.M.; Duijkers, L.; Niblock, M.; Hau, K.L.; et al. Detailed Phenotyping and Therapeutic Strategies for Intronic ABCA4 Variants in Stargardt Disease. Mol. Ther. Nucleic Acids 2020, 21, 412–427. [Google Scholar] [CrossRef]
- Sangermano, R.; Garanto, A.; Khan, M.; Runhart, E.H.; Bauwens, M.; Bax, N.M.; van den Born, L.I.; Khan, M.I.; Cornelis, S.S.; Verheij, J.; et al. Deep-intronic ABCA4 variants explain missing heritability in Stargardt disease and allow correction of splice defects by antisense oligonucleotides. Genet. Med. 2019, 21, 1751–1760. [Google Scholar] [CrossRef]
- Albert, S.; Garanto, A.; Sangermano, R.; Khan, M.; Bax, N.M.; Hoyng, C.B.; Zernant, J.; Lee, W.; Allikmets, R.; Collin, R.W.J.; et al. Identification and Rescue of Splice Defects Caused by Two Neighboring Deep-Intronic ABCA4 Mutations Underlying Stargardt Disease. Am. J. Hum. Genet. 2018, 102, 517–527. [Google Scholar] [CrossRef]
- Kaltak, M.; de Bruijn, P.; Piccolo, D.; Lee, S.E.; Dulla, K.; Hoogenboezem, T.; Beumer, W.; Webster, A.R.; Collin, R.W.J.; Cheetham, M.E.; et al. Antisense oligonucleotide therapy corrects splicing in the common Stargardt disease type 1-causing variant ABCA4 c.5461-10T>C. Mol. Ther. Nucleic Acids 2023, 31, 674–688. [Google Scholar] [CrossRef]
- Phyland, R.K.; McKay, A.; Olver, J.; Walterfang, M.; Hopwood, M.; Ponsford, M.; Ponsford, J.L. Use of Olanzapine to Treat Agitation in Traumatic Brain Injury: A Series of N-of-One Trials. J. Neurotrauma 2023, 40, 33–51. [Google Scholar] [CrossRef] [PubMed]
- Nikles, J.; Evans, K.; Hams, A.; Sterling, M. A systematic review of N-of-1 trials and single case experimental designs in physiotherapy for musculoskeletal conditions. Musculoskelet. Sci. Pract. 2022, 62, 102639. [Google Scholar] [CrossRef] [PubMed]
- Samuel, J.P.; Wootton, S.H.; Holder, T.; Molony, D. A scoping review of randomized trials assessing the impact of n-of-1 trials on clinical outcomes. PLoS ONE 2022, 17, e0269387. [Google Scholar] [CrossRef] [PubMed]
- Kronish, I.M.; Hampsey, M.; Falzon, L.; Konrad, B.; Davidson, K.W. Personalized (N-of-1) Trials for Depression: A Systematic Review. J. Clin. Psychopharmacol. 2018, 38, 218–225. [Google Scholar] [CrossRef] [PubMed]
- Gabler, N.B.; Duan, N.; Vohra, S.; Kravitz, R.L. N-of-1 trials in the medical literature: A systematic review. Med. Care 2011, 49, 761–768. [Google Scholar] [CrossRef]
- Kim, J.; Hu, C.; Moufawad El Achkar, C.; Black, L.E.; Douville, J.; Larson, A.; Pendergast, M.K.; Goldkind, S.F.; Lee, E.A.; Kuniholm, A.; et al. Patient-Customized Oligonucleotide Therapy for a Rare Genetic Disease. N. Engl. J. Med. 2019, 381, 1644–1652. [Google Scholar] [CrossRef]
- Aartsma-Rus, A.; Garanto, A.; van Roon-Mom, W.; McConnell, E.M.; Suslovitch, V.; Yan, W.X.; Watts, J.K.; Yu, T.W. Consensus Guidelines for the Design and In Vitro Preclinical Efficacy Testing N-of-1 Exon Skipping Antisense Oligonucleotides. Nucleic Acid Ther. 2023, 33, 17–25. [Google Scholar] [CrossRef]
- Garanto, A.; Collin, R.W.J. Design and In Vitro Use of Antisense Oligonucleotides to Correct Pre-mRNA Splicing Defects in Inherited Retinal Dystrophies. In Retinal Gene Therapy: Methods and Protocols; Boon, C.J.F., Wijnholds, J., Eds.; Springer: New York, NY, USA, 2018; pp. 61–78. [Google Scholar]
- Aartsma-Rus, A. (Ed.) Overview on AON Design. In Exon Skipping: Methods and Protocols; Humana Press: Totowa, NJ, USA, 2012; pp. 117–129. [Google Scholar]
- Zuker, M. Mfold web server for nucleic acid folding and hybridization prediction. Nucleic Acids Res. 2003, 31, 3406–3415. [Google Scholar] [CrossRef]
- Cartegni, L.; Wang, J.; Zhu, Z.; Zhang, M.Q.; Krainer, A.R. ESEfinder: A web resource to identify exonic splicing enhancers. Nucleic Acids Res. 2003, 31, 3568–3571. [Google Scholar] [CrossRef]
- Kibbe, W.A. OligoCalc: An online oligonucleotide properties calculator. Nucleic Acids Res. 2007, 35, W43–W46. [Google Scholar] [CrossRef]
- Suarez-Herrera, N.; Tomkiewicz, T.Z.; Garanto, A.; Collin, R.W.J. Development and Use of Cellular Systems to Assess and Correct Splicing Defects. Methods Mol. Biol. 2022, 2434, 145–165. [Google Scholar] [CrossRef]
- Warlich, E.; Kuehle, J.; Cantz, T.; Brugman, M.H.; Maetzig, T.; Galla, M.; Filipczyk, A.A.; Halle, S.; Klump, H.; Scholer, H.R.; et al. Lentiviral vector design and imaging approaches to visualize the early stages of cellular reprogramming. Mol. Ther. 2011, 19, 782–789. [Google Scholar] [CrossRef]
- Capowski, E.E.; Samimi, K.; Mayerl, S.J.; Phillips, M.J.; Pinilla, I.; Howden, S.E.; Saha, J.; Jansen, A.D.; Edwards, K.L.; Jager, L.D.; et al. Reproducibility and staging of 3D human retinal organoids across multiple pluripotent stem cell lines. Development 2019, 146, dev171686. [Google Scholar] [CrossRef]
- Gonzalez-Cordero, A.; Kruczek, K.; Naeem, A.; Fernando, M.; Kloc, M.; Ribeiro, J.; Goh, D.; Duran, Y.; Blackford, S.J.I.; Abelleira-Hervas, L.; et al. Recapitulation of Human Retinal Development from Human Pluripotent Stem Cells Generates Transplantable Populations of Cone Photoreceptors. Stem Cell Rep. 2017, 9, 820–837. [Google Scholar] [CrossRef]
- Kishor, A.; Fritz, S.E.; Hogg, J.R. Nonsense-mediated mRNA decay: The challenge of telling right from wrong in a complex transcriptome. Wiley Interdiscip. Rev. RNA 2019, 10, e1548. [Google Scholar] [CrossRef]
- Green, M.R.; Sambrook, J. Precipitation of RNA with Ethanol. Cold Spring Harb. Protoc. 2020, 2020, 101717. [Google Scholar] [CrossRef]
- Livak, K.J.; Schmittgen, T.D. Analysis of Relative Gene Expression Data Using Real-Time Quantitative PCR and the 2−ΔΔCT Method. Methods 2001, 25, 402–408. [Google Scholar] [CrossRef]
- Schindelin, J.; Arganda-Carreras, I.; Frise, E.; Kaynig, V.; Longair, M.; Pietzsch, T.; Preibisch, S.; Rueden, C.; Saalfeld, S.; Schmid, B.; et al. Fiji: An open-source platform for biological-image analysis. Nat. Methods 2012, 9, 676–682. [Google Scholar] [CrossRef]
- Fountzilas, E.; Tsimberidou, A.M.; Vo, H.H.; Kurzrock, R. Clinical trial design in the era of precision medicine. Genome Med. 2022, 14, 101. [Google Scholar] [CrossRef]
- Girach, A.; Audo, I.; Birch, D.G.; Huckfeldt, R.M.; Lam, B.L.; Leroy, B.P.; Michaelides, M.; Russell, S.R.; Sallum, J.M.F.; Stingl, K.; et al. RNA-based therapies in inherited retinal diseases. Ther. Adv. Ophthalmol. 2022, 14, 25158414221134602. [Google Scholar] [CrossRef]
- Trapani, I.; Puppo, A.; Auricchio, A. Vector platforms for gene therapy of inherited retinopathies. Prog. Retin. Eye Res. 2014, 43, 108–128. [Google Scholar] [CrossRef]
- Parfitt, D.A.; Lane, A.; Ramsden, C.M.; Carr, A.F.; Munro, P.M.; Jovanovic, K.; Schwarz, N.; Kanuga, N.; Muthiah, M.N.; Hull, S.; et al. Identification and Correction of Mechanisms Underlying Inherited Blindness in Human iPSC-Derived Optic Cups. Cell Stem Cell 2016, 18, 769–781. [Google Scholar] [CrossRef]
- Zhong, M.; Molday, L.L.; Molday, R.S. Role of the C terminus of the photoreceptor ABCA4 transporter in protein folding, function, and retinal degenerative diseases. J. Biol. Chem. 2009, 284, 3640–3649. [Google Scholar] [CrossRef]
- Patel, M.J.; Biswas, S.B.; Biswas-Fiss, E.E. Functional significance of the conserved C-Terminal VFVNFA motif in the retina-specific ABC transporter, ABCA4, and its role in inherited visual disease. Biochem. Biophys. Res. Commun. 2019, 519, 46–52. [Google Scholar] [CrossRef]
- Simonelli, F.; Testa, F.; Zernant, J.; Nesti, A.; Rossi, S.; Allikmets, R.; Rinaldi, E. Genotype-Phenotype Correlation in Italian Families with Stargardt Disease. Ophthalmic Res. 2005, 37, 159–167. [Google Scholar] [CrossRef]
- Moore, N.A.; Morral, N.; Ciulla, T.A.; Bracha, P. Gene therapy for inherited retinal and optic nerve degenerations. Expert. Opin. Biol. Ther. 2018, 18, 37–49. [Google Scholar] [CrossRef]
- Taylor, A.W. Ocular Immune Privilege and Transplantation. Front. Immunol. 2016, 7, 37. [Google Scholar] [CrossRef]
- Goyenvalle, A.; Jimenez-Mallebrera, C.; van Roon, W.; Sewing, S.; Krieg, A.M.; Arechavala-Gomeza, V.; Andersson, P. Considerations in the Preclinical Assessment of the Safety of Antisense Oligonucleotides. Nucleic Acid Ther. 2023, 33, 1–16. [Google Scholar] [CrossRef]
- Ahmed, S.; Amin, M.M.; Sayed, S. Ocular Drug Delivery: A Comprehensive Review. AAPS PharmSciTech 2023, 24, 66. [Google Scholar] [CrossRef]


Disclaimer/Publisher’s Note: The statements, opinions and data contained in all publications are solely those of the individual author(s) and contributor(s) and not of MDPI and/or the editor(s). MDPI and/or the editor(s) disclaim responsibility for any injury to people or property resulting from any ideas, methods, instructions or products referred to in the content. |
© 2024 by the authors. Licensee MDPI, Basel, Switzerland. This article is an open access article distributed under the terms and conditions of the Creative Commons Attribution (CC BY) license (https://creativecommons.org/licenses/by/4.0/).
Share and Cite
Suárez-Herrera, N.; Li, C.H.Z.; Leijsten, N.; Karjosukarso, D.W.; Corradi, Z.; Bukkems, F.; Duijkers, L.; Cremers, F.P.M.; Hoyng, C.B.; Garanto, A.; et al. Preclinical Development of Antisense Oligonucleotides to Rescue Aberrant Splicing Caused by an Ultrarare ABCA4 Variant in a Child with Early-Onset Stargardt Disease. Cells 2024, 13, 601. https://doi.org/10.3390/cells13070601
Suárez-Herrera N, Li CHZ, Leijsten N, Karjosukarso DW, Corradi Z, Bukkems F, Duijkers L, Cremers FPM, Hoyng CB, Garanto A, et al. Preclinical Development of Antisense Oligonucleotides to Rescue Aberrant Splicing Caused by an Ultrarare ABCA4 Variant in a Child with Early-Onset Stargardt Disease. Cells. 2024; 13(7):601. https://doi.org/10.3390/cells13070601
Chicago/Turabian StyleSuárez-Herrera, Nuria, Catherina H. Z. Li, Nico Leijsten, Dyah W. Karjosukarso, Zelia Corradi, Femke Bukkems, Lonneke Duijkers, Frans P. M. Cremers, Carel B. Hoyng, Alejandro Garanto, and et al. 2024. "Preclinical Development of Antisense Oligonucleotides to Rescue Aberrant Splicing Caused by an Ultrarare ABCA4 Variant in a Child with Early-Onset Stargardt Disease" Cells 13, no. 7: 601. https://doi.org/10.3390/cells13070601