Article

Valorization of Pine Cones (Pinus nigras) for Industrial Wastewater Treatment and Crystal Violet Removal: A Sustainable Approach Based on Bio-Coagulants and a Bio-Adsorbent

1
Laboratory of Process Engineering for Sustainable Development and Health Products (GPDDPS), Department of Process Engineering, National Polytechnic School of Constantine, Constantine 25000, Algeria
2
Department of Physics and Chemistry, Higher Normal School of Constantine, Constantine 25000, Algeria
3
Laboratory LIPE, Faculty Process Engineering, University of Constantine 3, Constantine 25000, Algeria
4
Laboratoire d’Etude et Recherche sur le Matériau Bois (LERMAB), Ecole Nationale Supérieure des Technologies et Industries du Bois (ENSTIB), University of Lorraine, 27 Rue Philippe Seguin, 88000 Epinal, France
*
Authors to whom correspondence should be addressed.
Water 2024, 16(2), 260; https://doi.org/10.3390/w16020260
Submission received: 16 December 2023 / Revised: 3 January 2024 / Accepted: 9 January 2024 / Published: 11 January 2024

Abstract

:
Pine cones are a widely available and abundant natural resource in Algeria, and they are rich in active molecules. This study investigated the valorization of Pine cones as a natural and abundant bio-coagulant in raw form (powder) and extract form. The active components of the Pine cones were extracted using two solvents, distilled water (DW) and NaCl, to obtain coagulants (proteins, polyphenols, and carbohydrates) for the treatment and improvement of industrial water quality parameters (discharge from a processing plant and tomato production) and an adsorbent (residue extract, RE). The recovered bio-coagulant was used to remove turbidity, chemical oxygen demand (COD), and zeta potential. The formed adsorbent was used to remove crystal violet (CV). Coagulation-flocculation experiments were carried out in a jar test to evaluate the performance of the coagulant in powder and extract form. The use of pine cone powder (PCP), extract using NaCl (PC-NaCl), and extract using DW (PC-DW) resulted in turbidity reductions of 96%, 94%, and 98%, respectively. For the residue recovered after extraction, a CV removal percentage of 99.9% was achieved at the optimal conditions of pH 10, CV concentration of 20 mg/L, adsorbent dose of 20 mg/L, and contact time of 120 min, as determined using the Box–Behnken design (BBD). Furthermore, all the effects were significant in the process of the CV phase adsorption on the bio-adsorbent. The model designed for optimal design fit the experimental data well, with a coefficient of determination, R2, of 0.965 and an Adj-R2 of 0.926. The p-value of this model was 0.000, which indicated that the model was very significant. This confirmed the effectiveness of the bio-adsorbent in removing dyes from water.

1. Introduction

Water is a fundamental and precious substance for all living organisms on Earth, as it is essential for various human activities, including domestic, agricultural, and industrial applications [1]. Environmental contamination and its detrimental impact on habitats have been extensively studied in recent decades. The challenges of removing pollutants from wastewater have grown with increasing industrialization [2]. Industrial water use currently accounts for less than 20% of global water consumption, and it is projected to increase by four times in 2050 [3]. Significant quantities of untreated industrial wastewater (e.g., from food processing and the textile industry) are discharged directly into the environment each year, causing severe environmental and health problems [4,5]. Food processing is a major water consumer and producer of wastewater. The wastewater produced by food processing plants poses a severe environmental problem globally, as it generally contains elevated levels of organic contaminants such as chemical oxygen demand (COD), biological oxygen demand (BOD), high food substances (nitrogen and phosphorus), and various chemicals such as solvents and ions [3,6,7]. Treating food processing wastewater before discharging it into coastal waters, rivers, and lakes is essential to reduce the risk of environmental pollution [7]. On the other hand, synthetic dyes are a significant class of recalcitrant organic compounds that are frequently found in the environment because of their widespread use in several industries such as the textile industry [8,9]. Increased demand and applications of synthetic dyes in chemical-based industries has led to the discharge of highly polluted wastewater, resulting in health problems and environmental pollution [10]. Several studies have stated that certain dyes are noxious, carcinogenic, and mutagenic which makes them hazardous to the flora and fauna [11,12]. Furthermore, the presence of dyes in aqueous ecosystems even at low concentrations diminishes photosynthetic phenomena by preventing light penetration, thereby deteriorating water quality and gas solubility as well as destroying the aesthetic value of water [12]. Several processes have been used to treat industrial pollutants (turbidity, COD, colorants, TSS, etc.), namely biological, membrane, advanced oxidation, and coagulation–flocculation processes (CFPs). The CFP is a physicochemical process that is commonly used to pretreat industrial wastewater. It is effective in removing suspended solids in two steps: (1) the tendency of colloidal particles to form large flocs by destabilization and (2) settling these large flocs by precipitation [13,14]. Coagulants are used to neutralize the negative charges in the polluted water, destabilizing the colloidal particles and causing them to form large flocs [8]. Conventional coagulation techniques use divalent, positively charged chemical compounds such as aluminum sulfate and ferric chloride, which have been linked to various adverse health and environmental impacts [15,16]. Extensive research has been conducted on the effects of using chemical compounds as coagulants, revealing high levels of chemical residues, toxic sludge, and health risks with prolonged use [17]. Changing over from chemical to natural coagulants offers a promising solution for reducing environmental pollution and health-related risks associated with chemical coagulants [16]. Natural coagulants are biodegradable, environmentally friendly, and often cheaper than chemical coagulants, especially when locally sourced [18]. These advantages make natural coagulants an attractive alternative for water treatment, which is essential from a sustainability point of view [19]. The use of natural coagulants derived from plant species is gaining traction in recent years due to their wide availability, renewability, and cost-effectiveness [17]. Numerous studies have been conducted to identify and evaluate plant materials that can be used as sources of natural coagulants, including Moringa olefeira [20,21,22,23], acorn leaves [24], cactus (Opuntia ficus-indica) [25,26,27], oak leaves [28], Jatropha curcas [29,30,31], and Aleppo pine seeds [8]. Large amounts of pine cones are produced annually as a by-product of agriculture worldwide [32]. The pine cone tree ‘‘Snouber’’ is the most common tree in Algeria with a surface area of approximately 900,000 hectares [33]. Pine cones are primarily composed of lignin, cellulose, and tannins [34]. Some of these components, such as phenolic groups of lignin, polysaccharides, and tannins, can stain treated water and significantly increase chemical oxygen demand (COD) [2]. Various activation techniques have been investigated to reduce the organic content of natural adsorbents and improve their adsorption capacity [34]. The coagulation activity of pine cone extract has been demonstrated to be equivalent or superior to that of other natural coagulants and alum [35]. Therefore, the conditions of availability, abundance, and renewability, as well as the effectiveness of this waste, motivated us to valorize it as a bio-coagulant for the treatment of wastewater and as an adsorbent for the removal of dye.
The current study was performed to evaluate the performance of pine cones as a natural coagulant in wastewater treatment in three forms: a powder, an extract with distilled water, and an extract with sodium chloride. The initial pH of the wastewater and the coagulant dosage were the variables analyzed in this study. The performance of this natural coagulant was determined by measuring the turbidity, chemical oxygen demand (COD), phosphate, and zeta potential after the treatment. Another objective of this study was the valorization of residues from the pine cone extraction process. These residues, which remained after the extraction of coagulant compounds, were examined for their potential to remove dyes through an adsorption process. Crystal violet (CV) was selected as the model dye. A response surface methodology, the Box–Behnken design, was adopted to optimize the experiments. Initial pH, stirring time, concentration of CV, and adsorbent dosage were chosen as variables, and the performance of this bio-adsorbent was assessed by measuring the efficiency of CV removal. In addition, PCP and PCER were characterized using Fourier-transform infrared spectroscopy (FTIR) and scanning electron microscopy (SEM) to elucidate the chemical structure, thermal stability, and morphology, respectively.
The innovative aspects include the use of pine cones as a low-cost biomaterial in physical-chemical water treatment processes. The novelties of this study are: (i) the valorization of local pine cone-based natural waste for the treatment of industrial wastewater and dyes; (ii) the comparative study of the effects of two solvents (distilled water and NaCl) on the performance of pine cones in improving wastewater quality; (iii) the development of mathematical models to facilitate the adsorption process for waters with similar properties in terms of CV concentration, and eventual replacement of the experimental study by a modeling study using the models obtained, i.e., addition of the adsorbent and a sodium hydroxide solution to the treatment unit without the experimental tests (optimization stage), using only the mathematical models obtained; (iv) and the valorization of residue from the extraction of coagulating agents from pine cones and its application as a bio-adsorbent for the reduction of crystal violet in water.

2. Materials and Methods

This study was carried out according to the sequence described in the following diagram (Figure 1).

2.1. Preparation of Bio-Coagulant

2.1.1. Preparation of Pine Cone Powder (PCP)

The pine cones (PCs) were collected from pine trees located in Mila, in the eastern region of Algeria. To prepare the coagulant, the PCs were dried in an oven (Carbolite Ltd. Type AX120: Hope Valley, UK) for 24 h at 60 °C, cooled to room temperature, crushed in a domestic blender, and sieved to obtain particles ranging from 63 µm to 250 µm. The resulting PCP was then used in each experiment (see Figure 2).

2.1.2. Preparation of Pine Cone Extract (PCE)

First, 5000 mg of PCP was added to 1000 mL of solvents (distilled water or sodium chloride at a concentration of 1 M) and mixed for 20 min to extract the active coagulation agent at a temperature of 80 °C and a pH of 10.
The mixtures of powder and solvent were immersed in an ultrasonic bath (Model: Branson1510, spectra lab instruments, Maharashtra, India) and simultaneously stirred for 10 min. The experiment was performed at 28 °C using an ultrasonic wavelength of 42 kHz. The selection of solvent concentration, agitation time, temperature, pH, and ultrasound assistance was based on preliminary laboratory results.
The suspension was filtered through a standard filter, and the filtrate solution was used in a subsequent jar flocculation (see Figure 2).
Figure 2. Bio-coagulant preparation steps.
Water 16 00260 g002

2.2. Preparation of Adsorbent (Bio-Coagulant Residue)

After extracting the pine cones, the residues were washed with distilled water and dried at 50 °C for 24 h to remove any residual solvents or chemicals that could affect the study results. The dried residues, referred to as PCER, were used as an adsorbent [36].
The determination of the point of zero charge (PZC) for the PCER was carried out using the solid addition method as described by Vieira [37]. To characterize the PCER sample, 100 mL of distilled water was added to closed vials, and the pH of each vial was adjusted to values ranging from 2 to 10 using 0.1 M NaOH or HCl. Then, 0.01 g of the ER sample was added to each vial. The suspensions were stirred at room temperature for 24 h, and the final pH of the supernatant was measured. The difference between the initial and final pH values (ΔpH = pH_initial − pH_final) was plotted against pH0. The point where the curve crosses the zero pH line is the point of zero charge, or pHPZC [38].

2.3. Raw Materials and Chemicals

The wastewater samples utilized in this study were obtained from the discharge of tomato processing activities located in Constantine, Algeria. Once collected, the physicochemical properties of the samples were examined to assess their pollution levels and determine the suitable treatment method. The wastewater characteristics are presented in Table 1.
The crystal violet (CV) dye was obtained from BIOCHEM, and its chemical structure is shown in Figure 3. For experimentation, all the solutions were prepared after dilution of the stock solution, which was prepared in distilled water. The physicochemical properties of the dye are presented in Table 2.

2.4. Analytical Methods

In the current study, various physicochemical parameters of water samples were characterized. The pH, electrical conductivity (EC) (salinity), and turbidity values were measured using specific instruments such as the SX-610 Pen pH meter, JENWAY type 3540 conduct meter (Camlab, Cambridge, UK), and HANNA type HI 98 713 Turbidity Meter (Hanna instruments, Cluj-Napoca, Romania), respectively. The chemical parameters, including chemical oxygen demand (COD), total suspended solids (TSS), and phosphate, were determined in the laboratory following the Standard Methods for the Examination of Water and Wastewater [20]. The measurement of the zeta potential was analyzed using a Model Nano ZS, Malvern Instruments, and ZetaSizer (Malvern Panalytical Ltd., Malvern, UK).

2.5. Bio-Coagulant and Bio-Adsorbent Characterization

Bio-coagulant PCP and bio-adsorbent PCER were characterized using FTIR, SEM, and BET equipment. The functional groups of PCP and PCER were determined by Fourier-transform infrared (FTIR) using a JASCO FT/IR-4600 type instrument spectrum (JASCO, Tokyo, Japan). The scanning electron microscopy (SEM) images of PCP and PCER were evaluated using an FEI Quanta 650/Broker instrument (FEI Company, Hillsboro, OR, USA), which identified the surface’s aspect and morphology. The BET analysis was used to determine the specific surface area and properties of the bio-coagulant PCP and the bio-adsorbent PCER using a Quantachrome, Nova instrument (Boston, MA, USA).
Regarding the liquid form of the bio-coagulant PC, the pH was measured using an SX-610 Pen pH meter. The various coagulant agent extracts were characterized in terms of polysaccharides, total phenolics, and proteins. Their concentrations were determined using the Dubois et al. [40], Folin Ciocalteu [41], and Bradford [42] methods, respectively.

2.6. Coagulation/Flocculation Experiments

The performance evaluation of the coagulant agent extracted from the different processes described above was conducted using the jar test, following standard methods [20,22,24].
Using a jar tester (SELECTA flocumatic, Selecta, Barcelona, Spain), six 1 L beakers were filled with 500 mL of the sample suspension. Different doses of PC were added to each beaker and agitated for 3 min at 160 rpm to ensure thorough mixing. The agitation speed was then reduced to 30 rpm and continued for an additional 20 min. After a 30 min sedimentation period, clarified samples were collected from the top of each beaker [28].
The coagulation experiments aimed to investigate the impact of pH, dosage of the bio-coagulant, and types of solvent used for extraction. The pH range varied from pH 2 to 12, while the dosage of the PC extract was studied from 20 to 200 mg/L, and two types of solvents, namely NaCl and distilled water, were utilized. The powder form of the PCs was employed as well. The turbidity, chemical oxygen demand (COD), and phosphate (PO4−3) removal efficiencies were calculated according to Equations (1)–(3), respectively.
Turbidity Removal efficiency (TRE %) = ((Initial turbidity-Residual turbidity) × 100)/(Initial turbidity)
COD Removal efficiency (CODRE %) = ((Initial COD-Residual COD) × 100)/(Initial COD)
Phosphate Removal efficiency (PRE %) = ((Initial Phosphate-Residual Phosphate) × 100)/(Initial Phosphate)
where initial and residual values are, respectively, the value of the specific parameter investigated (e.g., turbidity, COD, PO4−3) with its relative unit (e.g., NTU, mg/L, mg/L) pre- and post-jar test performance.
These parameters were individually varied to identify the optimal conditions for each parameter. All experiments were conducted three times, and the average of the experiments was reported.

2.7. Experiment Design

In order to obtain the optimal conditions for adsorption, the RSM methodology was used. Through RSM, a quadratic polynomial equation was developed to predict the response as a function of the independent variables involving their interactions [43,44].
Y i = B 0 + i = 1 k B i X i + i = 1 k B i i X i 2 + i = 1 j = 2 i j k B i j X i X j
where Yi is the response variable (dye removal), K is the number of factors (K = 4), β0 is a constant, βi, βii, and βij are regression coefficients, and Xi are the studied parameters.
In this study, the Box–Behnken design (BBD) was used as an experimental methodology using Minitab software 21.1.0 (Minitab, LLC, State College, PA, USA). The BBD had k = 4 factors, i.e., the initial pH (X1), stirring time (X2), the concentration of CV (X3), and the dosage of the adsorbent (X4). Dye removal (Y) was taken as the response of the design experiments.
The total number of experiments was 27 (see Table 3). ANOVA was used to assess the adequacy of the proposed model by performing a diagnostic check test.
This analysis was performed using the correlation coefficient (R2) test and the p-value (probability) [45,46].

2.8. Batch Adsorption Experiments

A solution of crystal violet (CV) was prepared with concentrations varying from 20 mg/L to 70 mg/L and was adjusted to different pH values (4–10). Different doses of the adsorbent (20–200 mg/L) were added to each solution, and the solutions were agitated for 20–120 min at a constant speed of 200 rpm at room temperature.
At predetermined time intervals, samples were collected and filtered using a filter with a diameter of 0.45 µm. The absorbance of CV at 591 nm was measured using a SHIMADZU UV-VIS Spectrophotometer UV-1201(Laboratoires Humeau, La Chapelle-sur-Erdre cedex, France) to determine the residual concentrations of the dye. Dye removal (%) was calculated according to Equation (5):
Dye removal (%) = ((C0 − Cr) × 100)/C0
where C0 is the initial CV concentration (mg /L) and Cr is the residual CV concentration (mg/L).

3. Results

3.1. Characterization of Bio-Coagulant and Bio-Adsorbent

3.1.1. Fourier-Transform Infrared Spectroscopy

Figure 4a,b shows the FTIR spectra of the PCP and PCER, respectively. Based on these figures, different bands were determined and presented as follows:
  • At 3331 and 3325 cm−1, we noticed three peaks of different intensities which represented the stretching vibrations of O-H groups (phenols, carboxyl, or alcohols) or linked to amine groups (NH) [20,24,47,48,49]. The CH group was observed at 2928 cm−1 and 2926 cm−1 [50,51,52].
  • The bands at 1637 cm−1 and 1600 cm−1 could be representative of carboxylic groups (C=O) [53].
  • The bands at 1273 cm−1 and 1247 cm−1 indicated the presence of a COO stretch that supports the existence of carboxyl/alcohol/ether/ester functional groups in the PCP and PCER [54,55].
  • The probability of the presence of an ester (CO) was established at the bond of 1030 and 1027 cm−1 of the FTIR spectrum of PCP and PCER where these peaks were stronger in both materials [56].
During the water treatment using PC and PCER as a bio-coagulant and bio-adsorbent, respectively, the carboxyl group (C=O) provides adsorption sites for the removal of various pollutants such as suspended matter, colloidal matter, and dyes in water [49,57].

3.1.2. SEM Analysis

Figure 5a–c presents scanning electron microscopy (SEM) images of PCP at magnifications of 100 µm, 10 µm, and 5 µm, respectively. The morphology of this bio-coagulant featured a heterogeneous, relatively porous matrix. This structure favors the coagulation–flocculation process due to the presence of several coagulating agents such as polysaccharides, total phenolic compounds, and proteins in the PCs. Based on these characteristics, it could be concluded that PCs have a suitable morphological profile to facilitate the removal of turbidity, TSS, etc. by enhancing adsorption and bridging capacity [28,58].
Figure 5d–f presents scanning electron microscopy (SEM) images of PCER at magnifications of 100 µm, 10 µm, and 5 µm, respectively. SEM images showed that the bio-adsorbent PCER had a fibrous surface with sponge areas and an irregular heterogeneous mesoporous structure. These exterior surface properties promote the accumulation of contaminants (e.g., crystal violet) due to existing accumulation cavities [54,59].
The SEM figures of PCP (Figure 5a–c) and PCER (Figure 5d–f) clearly showed morphological changes. This could indicate the partial removal of active components such as polysaccharides, total phenolic compounds, proteins, and other components present in the PCP during the extraction process. In Figure 5a–c, the structure acts as an attachment point for various pollutants, facilitating coagulation [60]. On the other hand, Figure 5d–f revealed a porous structure that enhances the liberation of active sites, thereby favoring adsorption [32].

3.1.3. BET Surface Area Analysis

Table 4 summarizes the main results of the structural analysis of the materials examined in this study, namely BET-specific surface area, pore volume, and average pore radius.
Structural analysis of PCP and PCER [50,51,53,54] led to the conclusion that thermochemical treatment led to an improvement in structural parameters (specific surface area, pore volume, and pore radius) that affect the removal efficiency of crystal violet in water.

3.2. Characterization of the Bio-Coagulant (Pine Cone Extract)

Table 5 shows the amounts of proteins, polysaccharides, and total phenolics in PC extract with distilled water (DW) and 1 M sodium chloride (NaCl). The results are shown in milligrams per gram of PC dry weight (mg/g).
The results confirm that PC contain three coagulating agents (proteins, polysaccharides, and total phenolics) at different concentrations. The concentrations of proteins, polysaccharides, and total phenolics in the PC extract with distilled water were 5.88, 33.62, and 3.29 mg/g, respectively, and 7.18, 29.11, and 5.48 mg/g, respectively, in the PC extract with NaCl. The presence of these active components plays a very important role in the coagulation–flocculation process using PCs as a plant-based bio-coagulant [24,28].
Coagulant proteins facilitate the coagulation of colloids, thereby facilitating their removal, through the adsorption and bridging mechanisms. In fact, proteins are molecules that possess both a long chain and a high molecular weight, which are both factors that contribute to the formation of bridges involving colloidal particles [28].
Bahrodin et al. [61] found that polysaccharides extracted from Saccharum officinarum promote coagulation through interparticle bridging, a mechanism less affected by pH compared to charge neutralization. This suggests that polysaccharides could be effective coagulants even in environments with varying pH levels.
Yin et al. [57] have explained and illustrated the possible molecular interactions that induce coagulation due to tannins. They highlighted that the phenolic groups are very important in this process. These groups readily deprotonate to form stable phenoxide ions, facilitated by electron delocalization within the aromatic ring. This delocalization increases the electron density on the oxygen atom, and the suggested higher phenolic content in tannins implies enhanced coagulation efficiency.

3.3. Effect of Bio-Coagulant Dosage

The efficiency of turbidity removal, phosphate removal, COD removal, zeta potential, and final pH of wastewater as a function of various PCP and extract dosages with distilled water and NaCl at pH 7.4 and a settling time of 30 min is plotted in Figure 6.
Figure 6a shows that the highest coagulation efficiencies were observed when a coagulant dose of 60 mg/L was used in the treatment with PC-NaCl, resulting in a 75% reduction in turbidity. This was because the presence of active compounds such as polyphenols, carbohydrates, and proteins, which have free OH- groups that can interact with colloidal particles in the effluent, is related to turbidity removal efficiency [62]. However, increasing the dose of the bio-coagulant beyond the optimal dose resulted in a decrease in coagulation efficiency.
In the cases of the PC powder and PC-DW coagulants, reduced coagulation activities were noticed, with a turbidity reduction of up to 46% at a bio-coagulant dose of 200 mg/L. This was because the lower concentration of active components, i.e., proteins, in the coagulant extract with distilled water (PC-DW) and PC powder was the main reason for reduced coagulation efficiency. The PC extract with NaCl showed its effectiveness when used as a coagulant with the optimal dose of 60 mg/L. The highest efficiency removal for COD was 98%. As shown in Figure 6b, with over 60 mg/L of coagulant, COD removal begins to decrease.
The maximum reduction was likely due to the fact that the presence of NaCl in the extract could promote the precipitation of suspended particles and improve the efficiency of the removal of COD. Improvement in organic removal might be attributed to the action of electric double layers generated by carboxylic, phenolic, and amino groups [60]. However, further COD reduction became increasingly difficult, likely due to the decreasing availability of functional groups in the aqueous solution.
The other coagulants, PC-DW and PC powder, achieved maximum reductions of 68% and 71%, respectively, at a coagulant dose of 200 mg/L as shown in Figure 6b.
Figure 6b illustrates that increasing the coagulant dosage up to 100 mg/L for PC-DW and PC powder resulted in a decrease in COD removal. This was due to coagulant overloading, which limited the number of available adsorption sites for colloidal particle bridging by covering the surface of the natural coagulant [19,60].
The effect of coagulant dosage on phosphate removal is shown in Figure 6c, where the graph clearly shows that the 20 mg/L coagulant dosage of PCP gave the highest removal efficiency of 41%. Similarly, the 20 mg/L dosage of pine cone extract with distilled water (PC-DW) gave a phosphate removal efficiency of 40.63%. Maximum phosphate reduction was achieved using pine cone extract (PC-NaCl) as a coagulant, with a reduction percentage of around 59%. The observed correlation between ionic strength and phosphate removal is in perfect agreement with the findings of Zaho et al. [63]. In their study, they also experimented with adding NaCl to synthetic water and observed a significant influence on phosphate removal by their new coagulant. Similar to our results, they found a rapid increase in removal efficiency at low ionic strength, followed by a slower increase at higher levels. The influence of ionic strength can be attributed to a classical notion of colloid stability [64]. Generally, with increasing ionic strength, the zeta potential and diffuse double layer thickness decrease, leading to higher phosphate removal efficiency [63].
Figure 6d shows the variation of the zeta potential with the dosage of the coagulant used (PC powder, PC-ED, and PC-NaCl). The optimal dosages of the bio-coagulant were 60, 200, and 200 mg/L for PC-NaCl, PC-ED, and PC powder, respectively.
These optimal dosages may contain an optimal amount of coagulants that can adsorb onto the surface of suspended particles. These coagulants, such as proteins, can neutralize the electrical charges of the particles, thereby reducing electrostatic repulsion and allowing the particles to approach each other [49]. It was seen that the zeta potential was canceled during the treatment with PC-NaCl, which corresponded to a coagulant dosage of 60 mg/L. In the presence of dissolved salts, zeta potential increases. This behavior reflects the neutralization of surface charges by the added salts, which leads to a reduction of the ionic double layer around the particles. This is consistent with the Schulze–Hardy rule, with the salts acting as counterions [65].
Figure 6e shows the variation of pH with the dosage of the bio-coagulant used (PC powder, PN-DW, and PC-NaCl). It was observed that with all three treatments, pH remained stable as the dosage of the bio-coagulant increased. This may be related to the nature of the treatment considered, such as the treatment with the bio-coagulant, where the dosage of the coagulant did not influence the pH. This result is similar to that found by other researchers [24] who treated surface water with an acorn leaves-based bio-coagulant using a NaCl extract (0.25 M).

3.4. Effect of pH

One of the most significant factors in coagulation treatment is the pH of the wastewater as it can affect the coagulation process and its performance. In order to investigate the impact of pH on the effectiveness of the coagulation treatment in the removal of turbidity, COD, phosphate, and zeta potential from wastewater, the pH of the wastewater samples was adjusted from 2 to 12 before the coagulation step (Figure 7a–e).
According to Figure 7a, the best coagulation activity was achieved at a pH value of 12 for all three treatments (PC powder, PC-DW, and PC-NaCl), with coagulation efficiencies of 96.79%, 98.55%, and 94.59%, respectively. At higher pH values, the cationic protein components of PC became activated. However, poor coagulation activity was observed near the neutral pH zone, i.e., at values from 6 to 8, as shown in Figure 7a. This is in accordance with the findings of Hussain et al. (2019), who found that higher pH values give excellent results in terms of coagulation activity [35].
The three treatments using PC powder, PC DW, and PC NaCl coagulants all showed their effectiveness, with the highest COD removal efficiencies of 98.1%, 97.7%, and 98.8%, respectively (Figure 7b).
Figure 7b also shows that increasing the pH increased COD removal for all three treatments. This result is similar to the findings of other researchers and can be explained by the fact that increasing the pH promoted the formation of chemical complexes between the coagulants and organic compounds, which facilitated their removal and led to a greater reduction in COD [57].
Phosphate removal efficiency was plotted against pH, as shown in Figure 7c. Phosphate removal efficiencies were high (84.63, 36.89, and 71.78%) when the pH levels were 12, 6, and 10 for PCP, PC-DW, and PC-NaCl, respectively.
As shown in Figure 7c, pH value had a significant impact on the phosphate removal efficiency of the three forms of bio-coagulants (PCP, PC-DW, and PC-NaCl). Optimal coagulation performance was achieved at pH 12 (pH base value), which demonstrated the importance of an increasing coagulant concentration and its contribution to phosphate removal.
At acidic pH, the performance apparently dropped significantly to unsatisfactory levels. At this relatively low pH, neutralization of negatively charged phosphates with positively charged coagulants such as proteins, polysaccharides, and total phenolic compounds was hindered by the presence of H3O+ cations as they interacted negatively with the colloids. Functional groups compete for electrostatic interactions [63].
Figure 7d shows that charge removal increased with increasing initial pH, up to almost complete charge removal at pH = 12 for all three treatments.
Figure 7e shows the variation of the final pH with the initial pH. It was observed that there was no significant difference between the initial pH and final pH for the three treatments.
The coagulative behavior of PCP and the extracts increased as the alkalinity of the wastewater increased, within the range of pH 8 to pH 12. This clearly showed that PC performed better in basic conditions, which was supported by the characterization analysis.
As the pH increased, PC, an anionic polyelectrolyte, became progressively more negatively charged due to the ionization of hydroxyl (–OH) groups from its alcoholic and carboxylic groups [66]. These carboxylic groups broke the –OH bonds and further ionized when added to alkaline solutions. The liberated H+ ions subsequently interacted with negatively charged colloidal particles in the wastewater [67,68]. In this case, the bio-coagulant achieved the highest percentage removal of turbidity, COD, and phosphate.
Our suggested mechanism of interaction is through hydrogen-bonded bridging between the ionized carbonyl and carboxyl groups on the PC and the different pollutants present in the wastewater [66].

3.5. Use of Extract Residues as a Bio-Adsorbent for CV Removal from Water

3.5.1. The Point of Zero Charge of PCER Adsorbent

Figure 8 shows the graph of (final pH–initial pH) as a function of initial pH for the PCER adsorbent from which the pHpzc is deduced. Close inspection of the results showed that the pHpzc value of PCER was 7.2. The pHpzc gives the net charge of the material, as a function of the solution pH: the surface of the materials becomes positively charged at pH < pHpzc and negatively charged at pH > pHpzc, as shown in Figure 8.

3.5.2. Optimization and Modeling of the Adsorption Process

In order to evaluate the efficiency of the extract residue (PCER) adsorbent recovered after pine cone extraction, we conducted 27 experiments by analyzing four specific factors (three center points are included). Table 6 shows the experimental matrix obtained by the Box–Behnken design and the response obtained at each experiment (removal of CV).
The full quadratic regression model for adsorption using the extract residue of pine cones (PCER) is given in the real form in Equation (6):
Removal of Crystal violet (%) = 57.42 +8.90 X1 + 11.35 X2 − 7.25 X3 + 7.05 X4 + 18.02 X12 − 1.87 X22− 2.81 X32 + 5.35 X42 + 6.10 X1 × X2 − 13.01 X1 × X3 − 13.67 X1 × X4 − 10.31 X2 × X3 + 5.55 X2 × X4 + 9.83 X3 × X4

3.5.3. The Effect of Factors

Figure 9 illustrates the results of the main effects plots. We could observe that the studied factors (pH, stirring time, concentration of CV, and dosage of the adsorbent (PCER)) had different effects on dye removal.
Based on the results, we observed that pH had the greatest effect on dye removal efficiency. It had a negative effect at pH < 6.5 and a significant positive effect at pH > 6.5.
Figure 9 shows that the adsorption capacity increased with pH. The evolution of the adsorption capacity (efficiency removal of dye) in the pH range studied could be explained by the fact that when the pH was higher than the point zero charge (pHpzc = 7.2), the surface of the adsorbent PCER was negatively charged and the molecules of cationic dye CV in the solution were positively charged, which increased the efficiency of dye removal.
Adsorption can be attributed to pH-dependent interactions between the bio-adsorbent surface and the dye. As pH increased, the surface of the bio-adsorbent became increasingly negative, facilitating a specific electrostatic attraction with the positively charged dye molecule (=N+(CH3)2). This increase in favorable interactions led to efficient adsorption at higher pH values [69].
Stirring time also had a significant impact on the efficiency of dye removal. It was observed that a dye removal efficiency of 73% was achieved in 120 min. In general, the removal efficiency increased with increasing stirring time. This was because more time allowed for more contact between the adsorbent and the dye molecules.
Regarding the concentration of the dye, it was found that it had a negative effect when going from 20 to 70 mg/L. Dye removal efficiency decreased with increasing initial dye concentration. This was because there may be an overload of the available adsorption sites on the bio-adsorbent. Binding sites are limited in number, and when all sites are occupied, additional dye adsorption becomes difficult or even impossible. Therefore, at high initial concentrations, dye adsorption may be limited by the saturation of adsorption sites.
Finally, regarding the dose of the adsorbent, it was observed that it had a positive effect. An increase in dye removal efficiency with an increase in adsorbent concentration could be attributed to a larger surface area and the availability of more adsorption sites [69].

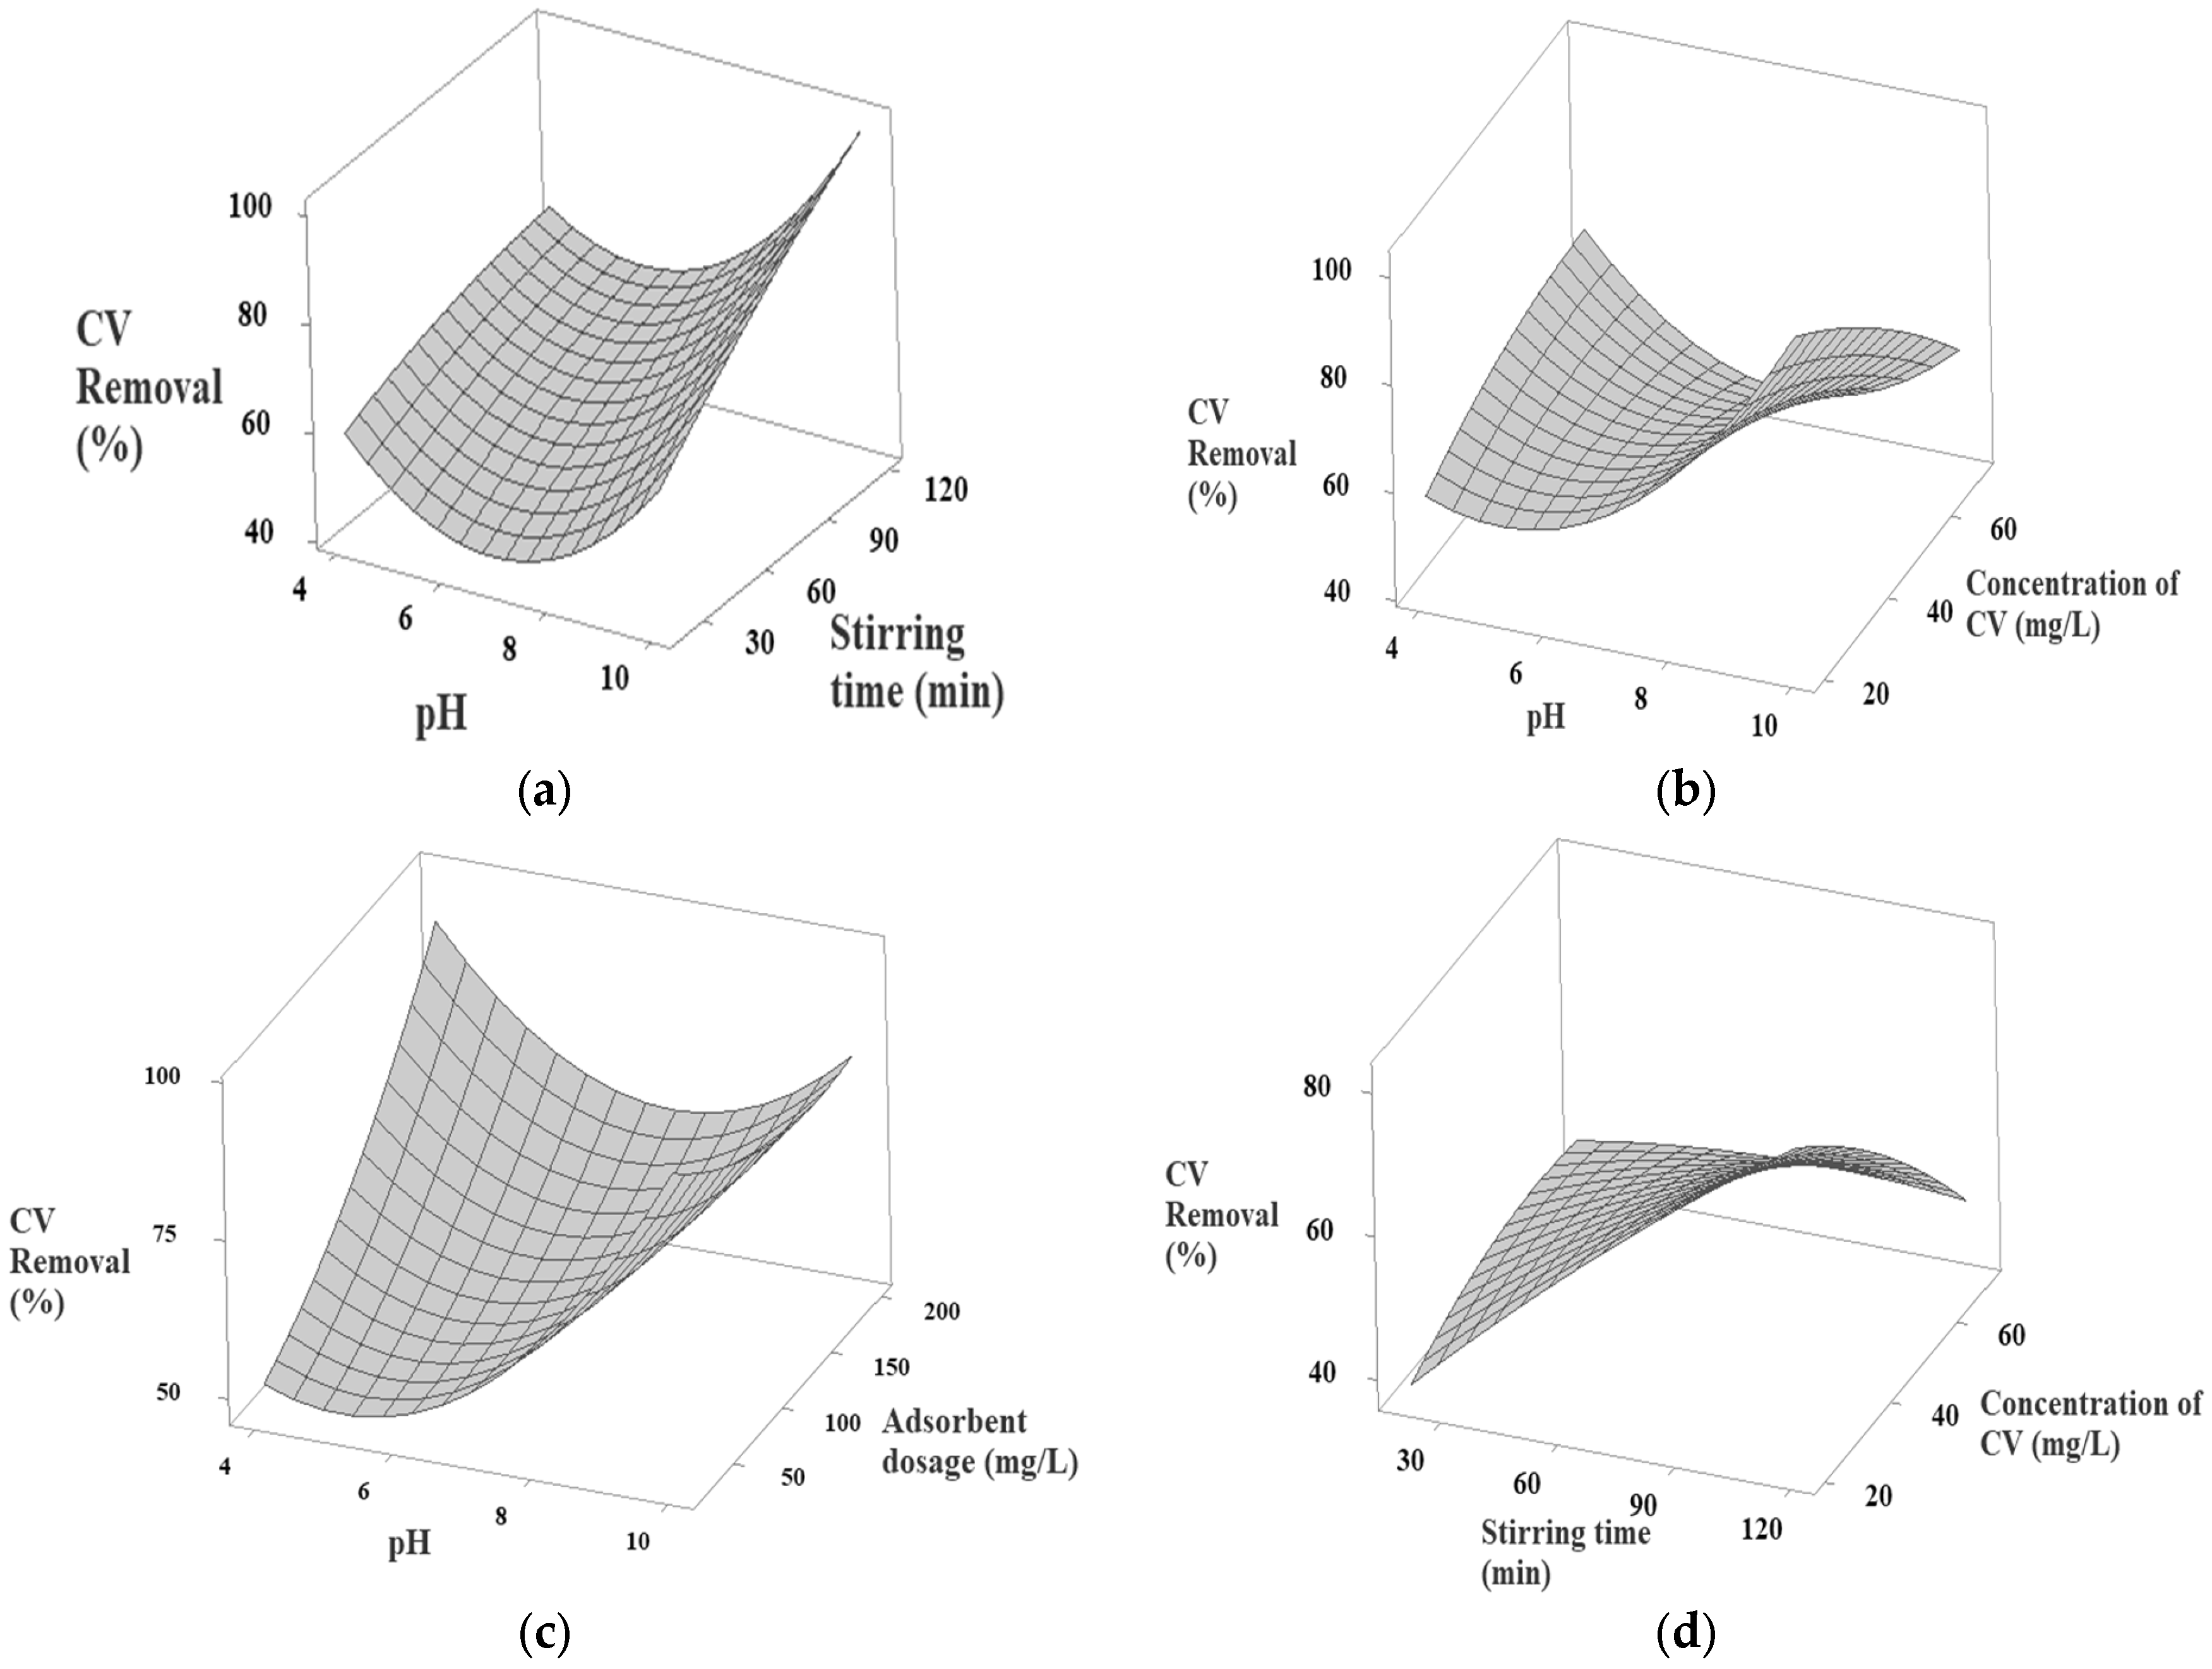
3.5.4. Response Surface Plotting

For a better explanation of the independent variables and their interactive effects on the removal of CV dye solutions, 3D plots are represented in Figure 10a–f.
pH definitely affected the adsorption of the dye. Figure 10a–c clearly reveals that with a further increase in pH from 8.0 to 10.0, adsorption increased in the difference percentage (greater than 98%). This was because the increase in pH neutralized the negative charge at the adsorbent surface, allowing the positively charged dye molecule to attach more easily. Higher dye adsorption at higher pH was due to the electrostatic attraction between the negatively charged adsorbent surfaces and the positively charged dye molecules (=N+ (CH3)2). Basic conditions promote dye adsorption [70].
Figure 10a,d,e shows that the adsorption rate of crystal violet dye on the adsorbent increased with stirring time, reaching 99% adsorption efficiency in about 120 min. This was because the adsorption rate increased over time, and it took almost 2 h to completely saturate the active sites of the adsorbent. These findings are consistent with other studies on crystal violet dye removal from aqueous solutions, such as those using pineapple leaf powder [71,72], coniferous pinus bark powder [72], and waste materials [70] where dye removal increased with increase in contact time.
Figure 10b,d shows that an increase in the concentration of CV led to a decrease in the removal efficiency of CV. It was observed that the removal of CV caused a small decrease from 20 to 45 mg/L, then a rapid decrease from 45 to 70 mg/L, a decrease from 70 to 55%. At higher concentrations, the ratio of initial CV ions to available surface area was high, and fractional adsorption became dependent on the initial concentration. However, at extremely high concentrations, the available sites were depleted, resulting in a decrease in CV adsorption [46,73].
One of the parameters that strongly affected adsorption capacity was the dose of the adsorbent. It could be easily inferred that the percent removal of CV increased with an increasing amount of the adsorbent (20–200 mg), as shown in Figure 10c,e,f, as we could see a stronger response (75%) with a higher amount of the adsorbent. This was due to the greater availability of the exchangeable sites or surface area at higher concentrations of the adsorbent [9].

3.5.5. Analysis of Variance (ANOVA Test)

The analysis of variance (ANOVA) is essential to test the significance of the quadratic response surface regression model using Minitab software 21.1.0 (LLC, State College, PA, USA). The ANOVA results in Table 7 show that the model was highly significant, with an F-value of 24.23 and a p-value of 0.000. We found that the quadratic model was highly significant [46].
The model was evaluated using both the coefficient of determination (R2) and the adjusted coefficient of determination (adjusted R2). R2 and adjusted R2 were found to be 96.58% and 92.6%, respectively. Our models were considered highly significant and indicated excellent correlations between the experimental results and the predicted values of dye removal uptake from these models.

3.5.6. Optimization and Validation

In order to maximize dye removal efficiency, the regression equation (Equation (6)) was optimized using Minitab 21. Table 8 presents the optimized parameters resulting from analyses performed on the equations generated by Minitab. These parameters must be evaluated to ensure the accuracy and validity of the optimal conditions. To obtain the desired CV removal efficiency, the following parameters were set: the pH was maintained at 10, the CV concentration was set to 20 mg/L, the adsorbent dose was 20 mg/L, and stirring time was set to 120 min. These parameters allowed for a CV removal efficiency of 99.9%.

4. Conclusions

This study investigated the use of a PC bio-coagulant in the treatment of wastewater by the coagulation–flocculation process. The results showed that the optimal pH and bio-coagulant doses for PCP and PC-DW were pH 12 and 200 mg/L, while for PC-NaCl, they were pH 12 and 60 mg/L. These conditions resulted in turbidity removal effectiveness of 96%, 98%, and 94%, respectively, and COD removal rates of 98.11%, 97.7%, and 98.8%, respectively. By exploring the residue remaining from PCs after extracting a coagulant agent, we observed its potential as an inexpensive and effective bio-adsorbent for removing crystal violet (CV). The modeling results indicated that the response surface models performed well. It is noted that the correlation coefficients (R2 and R2 adjusted) were 96.58% and 92.6%. Furthermore, the model exhibited highly significant statistical validity (p < 0.005).
The results of this work indicated that PC bio-coagulants have promising potential in wastewater treatment and may be a viable alternative to chemical coagulants. ER adsorbents are also promising adsorbents for cationic dyes due to their biodegradability, low toxicity, and abundance. These materials could help reduce environmental pollution and health hazards.

Author Contributions

Conceptualization, O.B., A.B. and K.D., methodology, O.B., A.B., K.D, I.A. and Q.E.G.; formal analysis, A.B and A.P.; investigation, O.B. and A.B.; data curation, O.B., A.B., K.D., A.K. and A.P.; writing—original draft preparation, O.B., A.B., K.D. and A.P.; writing—review and editing, O.B., K.D. and A.B.; supervision, K.D., A.K. and A.P.; project administration, K.D. All authors have read and agreed to the published version of the manuscript.

Funding

This research received no external funding.

Data Availability Statement

The data presented in this study are available on request from the corresponding author.

Acknowledgments

This work was supported by the National Polytechnic School of Constantine (Algeria).

Conflicts of Interest

The authors declare no conflicts of interest.

Abbreviations

PCspine cones
PCPpine cone powder
PCEpine cone extract
PCERpine cone extract residue
CVcrystal violet
FTIRFourier-transform infrared spectrophotometry
SEM scanning electron microscopy
BETBrunauer–Emmett–Teller
BBDBox–Behnken design
RSMresponse surface method
CODchemical oxygen demand
NTUnephelometric turbidity unit
pHhydrogen potential
TSStotal suspended solids
PH pzcthe point of zero charge

References

  1. Koul, B.; Bhat, N.; Abubakar, M.; Mishra, M.; Arukha, A.P.; Yadav, D. Application of Natural Coagulants in Water Treatment: A Sustainable Alternative to Chemicals. Water 2022, 14, 3751. [Google Scholar] [CrossRef]
  2. Emin Argun, M.; Dursun, Ş. Activation of Pine Bark Surface with NaOH for Lead Removal. Int. Environ. Appl. Sci. 2007, 2, 5–10. [Google Scholar]
  3. Asgharnejad, H.; Khorshidi Nazloo, E.; Madani Larijani, M.; Hajinajaf, N.; Rashidi, H. Comprehensive Review of Water Management and Wastewater Treatment in Food Processing Industries in the Framework of Water-Food-Environment Nexus. Compr. Rev. Food Sci. Food Saf. 2021, 20, 4779–4815. [Google Scholar] [CrossRef] [PubMed]
  4. Shahedi, A.; Darban, A.K.; Taghipour, F.; Jamshidi-Zanjani, A. A Review on Industrial Wastewater Treatment via Electrocoagulation Processes. Curr. Opin. Electrochem. 2020, 22, 154–169. [Google Scholar] [CrossRef]
  5. Malik, S.N.; Ghosh, P.C.; Vaidya, A.N.; Mudliar, S.N. Hybrid Ozonation Process for Industrial Wastewater Treatment: Principles and Applications: A Review. J. Water Process Eng. 2020, 35, 101193. [Google Scholar] [CrossRef]
  6. Aguilar, J.R.P.; Cabriales, J.J.P.; Vega, M.M. Identification and Characterization of Sulfur-Oxidizing Bacteria in an Artificial Wetland That Treats Wastewater from a Tannery. Int. J. Phytoremediat. 2008, 10, 359–370. [Google Scholar] [CrossRef] [PubMed]
  7. Daneshvar, E.; Zarrinmehr, M.J.; Koutra, E.; Kornaros, M.; Farhadian, O.; Bhatnagar, A. Sequential Cultivation of Microalgae in Raw and Recycled Dairy Wastewater: Microalgal Growth, Wastewater Treatment and Biochemical Composition. Bioresour. Technol. 2019, 273, 556–564. [Google Scholar] [CrossRef]
  8. Hadadi, A.; Imessaoudene, A.; Bollinger, J.C.; Bouzaza, A.; Amrane, A.; Tahraoui, H.; Mouni, L. Aleppo Pine Seeds (Pinus halepensis Mill.) as a Promising Novel Green Coagulant for the Removal of Congo Red Dye: Optimization via Machine Learning Algorithm. J. Environ. Manag. 2023, 331, 117286. [Google Scholar] [CrossRef]
  9. Laggoun, Z.; Khalfaoui, A.; Benalia, A.; Ghomrani, A.F.; Bouchareb, R.; Mahfouf, A.; Pizzi, A.; Panico, A.; Derbal, K. Application of Response Surface Design for Optimization of Direct Red Dye Biosorption onto Cockleshells. Appl. Sci. 2023, 13, 12333. [Google Scholar] [CrossRef]
  10. Cheruiyot, G.K.; Wanyonyi, W.C.; Kiplimo, J.J.; Maina, E.N. Adsorption of Toxic Crystal Violet Dye Using Coffee Husks: Equilibrium, Kinetics and Thermodynamics Study. Sci. Afr. 2019, 5, e00116. [Google Scholar] [CrossRef]
  11. Talarposhti, A.M.; Donnelly, T.; Anderson, G.K. Colour Removal from a Simulated Dye Wastewater Using a Two-Phase Anaerobic Packed Bed Reactor. Water Res. 2001, 35, 425–432. [Google Scholar] [CrossRef] [PubMed]
  12. Asad, S.; Amoozegar, M.A.; Pourbabaee, A.A.; Sarbolouki, M.N.; Dastgheib, S.M.M. Decolorization of Textile Azo Dyes by Newly Isolated Halophilic and Halotolerant Bacteria. Bioresour. Technol. 2007, 98, 2082–2088. [Google Scholar] [CrossRef]
  13. Swelam, A.A.; Sherif, S.S.; Hafez, A.I. Removal Comparative Study for Cd(II) Ions from Polluted Solutions by Adsorption and Coagulation Techniques Using Moringa oleifera Seeds. Egypt. J. Chem. 2019, 62, 1499–1517. [Google Scholar] [CrossRef]
  14. Alazaiza, M.Y.D.; Albahnasawi, A.; Ali, G.A.M.; Bashir, M.J.K.; Nassani, D.E.; Al Maskari, T.; Abu Amr, S.S.; Abujazar, M.S.S. Application of Natural Coagulants for Pharmaceutical Removal from Water and Wastewater: A Review. Water 2022, 14, 140. [Google Scholar] [CrossRef]
  15. Dayarathne, H.N.P.; Angove, M.J.; Aryal, R.; Abuel-Naga, H.; Mainali, B. Removal of Natural Organic Matter from Source Water: Review on Coagulants, Dual Coagulation, Alternative Coagulants, and Mechanisms. J. Water Process Eng. 2021, 40, 101820. [Google Scholar] [CrossRef]
  16. Owodunni, A.A.; Ismail, S. Revolutionary Technique for Sustainable Plant-Based Green Coagulants in Industrial Wastewater Treatment—A Review. J. Water Process Eng. 2021, 42, 102096. [Google Scholar] [CrossRef]
  17. Hadadi, A.; Imessaoudene, A.; Bollinger, J.C.; Cheikh, S.; Assadi, A.A.; Amrane, A.; Kebir, M.; Mouni, L. Parametrical Study for the Effective Removal of Mordant Black 11 from Synthetic Solutions: Moringa oleifera Seeds’ Extracts Versus Alum. Water 2022, 14, 4109. [Google Scholar] [CrossRef]
  18. Iwuozor, K.O.; Adeniyi, A.G.; Emenike, E.C.; Ojeyemi, T.; Egbemhenghe, A.U.; Okorie, C.J.; Ayoku, B.D.; Saliu, O.D. Prospects and Challenges of Utilizing Sugarcane Bagasse as a Bio-Coagulant Precursor for Water Treatment. Biotechnol. Rep. 2023, 39, e00805. [Google Scholar] [CrossRef]
  19. Ramavandi, B.; Farjadfard, S. Removal of Chemical Oxygen Demand from Textile Wastewater Using a Natural Coagulant. Korean J. Chem. Eng. 2014, 31, 81–87. [Google Scholar] [CrossRef]
  20. Bouchareb, R.; Derbal, K.; Benalia, A. Optimization of Active Coagulant Agent Extraction Method from Moringa oleifera Seeds for Municipal Wastewater Treatment. Water Sci. Technol. 2021, 84, 393–403. [Google Scholar] [CrossRef] [PubMed]
  21. Rmsr, M.; Rahayu, M.J.; Hashim, A.M. Efficiency of Moringa oleifera Seeds for Treatment of Laundry Wastewater. MATEC Web Conf. 2017, 103, 06001. [Google Scholar]
  22. Okuda, T.; Baes, A.U.; Nishijima, W.; Okada, M. Improvement of extraction method of coagulation active components from moringa oleifera seed. Water Res. 1999, 33, 3373–3378. [Google Scholar] [CrossRef]
  23. Zaid, A.Q.; Ghazali, S.B.; Mutamim, N.S.A.; Olalere, O.A. Experimental Optimization of Moringa oleifera Seed Powder as Bio-Coagulants in Water Treatment Process. SN Appl. Sci. 2019, 1, 1–5. [Google Scholar] [CrossRef]
  24. Benalia, A.; Derbal, K.; Panico, A.; Pirozzi, F. Use of Acorn Leaves as a Natural Coagulant in a Drinking Water Treatment Plant. Water 2018, 11, 57. [Google Scholar] [CrossRef]
  25. Choudhary, M.; Ray, M.B.; Neogi, S. Evaluation of the Potential Application of Cactus (Opuntia ficus-Indica) as a Bio-Coagulant for Pre-Treatment of Oil Sands Process-Affected Water. Sep. Purif. Technol. 2019, 209, 714–724. [Google Scholar] [CrossRef]
  26. Bouatay, F.; Mhenni, F. Use of the Cactus Cladodes Mucilage (Opuntia ficus Indica) As an Eco-Friendly Flocculants: Process Development and Optimization Using Stastical Analysis. Int. J. Environ. Res. 2014, 8, 1295–1308. [Google Scholar]
  27. Nharingo, T.; Zivurawa, M.T.; Guyo, U. Exploring the Use of Cactus Opuntia ficus Indica in the Biocoagulation–Flocculation of Pb(II) Ions from Wastewaters. Int. J. Environ. Sci. Technol. 2015, 12, 3791–3802. [Google Scholar] [CrossRef]
  28. Benalia, A.; Chaibraa, W.; Djeghar, S.; Derbal, K.; Khalfaoui, A.; Mahfouf, A.; Bouchareb, R.; Panico, A.; Pizzi, A. Use of Extracted Proteins from Oak Leaves as Bio-Coagulant for Water and Wastewater Treatment: Optimization by a Fractional Factorial Design. Water 2023, 15, 1984. [Google Scholar] [CrossRef]
  29. Abidin, Z.Z.; Ismail, N.; Yunus, R.; Ahamad, I.S.; Idris, A. A Preliminary Study on Jatropha Curcas as Coagulant in Wastewater Treatment. Environ. Technol. 2011, 32, 971–977. [Google Scholar] [CrossRef]
  30. Abidin, Z.Z.; Mohd Shamsudin, N.S.; Madehi, N.; Sobri, S. Optimisation of a Method to Extract the Active Coagulant Agent from Jatropha Curcas Seeds for Use in Turbidity Removal. Ind. Crops Prod. 2013, 41, 319–323. [Google Scholar] [CrossRef]
  31. Zainal, S.F.F.S.; Aziz, H.A.; Omar, F.M.; Alazaiza, M.Y.D. Influence of Jatropha curcas Seeds as a Natural Flocculant on Reducing Tin (IV) Tetrachloride in the Treatment of Concentrated Stabilised Landfill Leachate. Chemosphere 2021, 285, 131484. [Google Scholar] [CrossRef]
  32. Dawood, S.; Sen, T.K. Removal of Anionic Dye Congo Red from Aqueous Solution by Raw Pine and Acid-Treated Pine Cone Powder as Adsorbent: Equilibrium, Thermodynamic, Kinetics, Mechanism and Process Design. Water Res. 2012, 46, 1933–1946. [Google Scholar] [CrossRef]
  33. Kadri, N.; Khettal, B.; Aid, Y.; Kherfellah, S.; Sobhi, W.; Barragan-Montero, V. Some Physicochemical Characteristics of Pinus (Pinus halepensis Mill., Pinus pinea L., Pinus pinaster and Pinus canariensis) Seeds from North Algeria, Their Lipid Profiles and Volatile Contents. Food Chem. 2015, 188, 184–192. [Google Scholar] [CrossRef] [PubMed]
  34. Argun, M.E.; Dursun, S.; Karatas, M.; Gürü, M. Activation of Pine Cone Using Fenton Oxidation for Cd(II) and Pb(II) Removal. Bioresour. Technol. 2008, 99, 8691–8698. [Google Scholar] [CrossRef] [PubMed]
  35. Hussain, S.; Ghouri, A.S.; Ahmad, A. Pine Cone Extract as Natural Coagulant for Purification of Turbid Water. Heliyon 2019, 5, e01420. [Google Scholar] [CrossRef] [PubMed]
  36. Kebaili, M.; Djellali, S.; Radjai, M.; Drouiche, N.; Lounici, H. Valorization of Orange Industry Residues to Form a Natural Coagulant and Adsorbent. J. Ind. Eng. Chem. 2018, 64, 292–299. [Google Scholar] [CrossRef]
  37. Vieira, A.P.; Santana, S.A.A.; Bezerra, C.W.B.; Silva, H.A.S.; Chaves, J.A.P.; de Melo, J.C.P.; da Silva Filho, E.C.; Airoldi, C. Kinetics and Thermodynamics of Textile Dye Adsorption from Aqueous Solutions Using Babassu Coconut Mesocarp. J. Hazard. Mater. 2009, 166, 1272–1278. [Google Scholar] [CrossRef]
  38. Al-Maliky, E.A.; Gzar, H.A.; Al-Azawy, M.G. Determination of Point of Zero Charge (PZC) of Concrete Particles Adsorbents. OP Conf. Ser. Mater. Sci. Eng. 2021, 1184, 012004. [Google Scholar] [CrossRef]
  39. Bouteflika, A. Limit Values for the Parameters of Discharges of Industrial Liquid Effluents. Off. J. People’s Democr. Repub. Alger. 2006, 26, 1–27. [Google Scholar]
  40. Dubois, M.; Gilles, K.A.; Hamilton, J.K.; Rebers, P.A.; Smith, F. Colorimetric Method for Determination of Sugars and Related Substances. Anal. Chem. 1955, 28, 350–356. [Google Scholar] [CrossRef]
  41. Tawaha, K.; Alali, F.Q.; Gharaibeh, M.; Mohammad, M.; El-Elimat, T. Antioxidant Activity and Total Phenolic Content of Selected Jordanian Plant Species. Food Chem. 2007, 104, 1372–1378. [Google Scholar] [CrossRef]
  42. Bradford, M.M. A Rapid and Sensitive Method for the Quantitation of Microgram Quantities of Protein Utilizing the Principle of Protein-Dye Binding. Anal. Biochem. 1976, 72, 248–254. [Google Scholar] [CrossRef]
  43. Khalfaoui, A.; Meniai, A.H. Application of Chemically Modified Orange Peels for Removal of Copper(II) from Aqueous Solutions. Theor. Found. Chem. Eng. 2012, 46, 732–739. [Google Scholar] [CrossRef]
  44. Louhıchı, G.; Bousselmı, L.; Ghrabı, A.; Khounı, I. Process Optimization via Response Surface Methodology in the Physico-Chemical Treatment of Vegetable Oil Refinery Wastewater. Environ. Sci. Pollut. Res. 2019, 26, 18993–19011. [Google Scholar] [CrossRef]
  45. Ayat, A.; Arris, S.; Abbaz, A.; Bencheikh-Lehocine, M.; Meniai, A.H. Application of Response Surface Methodology for Modeling and Optimization of a Bio Coagulation Process (Sewage Wastewater Treatment Plant). Environ. Manag. 2021, 67, 489–497. [Google Scholar] [CrossRef]
  46. Chen, W.H.; Chiu, G.L.; Chyuan Ong, H.; Shiung Lam, S.; Lim, S.; Sik Ok, Y.; Kwon, E.E. Optimization and Analysis of Syngas Production from Methane and CO2 via Taguchi Approach, Response Surface Methodology (RSM) and Analysis of Variance (ANOVA). Fuel 2021, 296, 120642. [Google Scholar] [CrossRef]
  47. Shakoor, S.; Nasar, A. Utilization of Punica Granatum Peel as an Eco-Friendly Biosorbent for the Removal of Methylene Blue Dye from Aqueous Solution. J. Appl. Biotechnol. Bioeng. 2018, 5, 242–249. [Google Scholar] [CrossRef]
  48. Benalia, A.; Derbal, K.; Khalfaoui, A.; Pizzi, A.; Medjahdi, G. The Use of Aloe Vera as Natural Coagulant in Algerian Drinking Water Treatment Plant. J. Renew. Mater. 2022, 10, 625–637. [Google Scholar] [CrossRef]
  49. Benalia, A.; Derbal, K.; Khalfaoui, A.; Bouchareb, R.; Panico, A.; Gisonni, C.; Crispino, G.; Pirozzi, F.; Pizzi, A. Use of Aloe Vera as an Organic Coagulant for Improving Drinking Water Quality. Water 2021, 13, 2024. [Google Scholar] [CrossRef]
  50. Lawson, D.H. Atomic Force Microscopy and Raman Spectroscopy Study of Tantala Films. Master’s Thesis, University of Glasgow, Glasgow, UK, 2014. [Google Scholar]
  51. Choong Lek, B.L.; Peter, A.P.; Qi Chong, K.H.; Ragu, P.; Sethu, V.; Selvarajoo, A.; Arumugasamy, S.K. Treatment of Palm Oil Mill Effluent (POME) Using Chickpea (Cicer arietinum) as a Natural Coagulant and Flocculant: Evaluation, Process Optimization and Characterization of Chickpea Powder. J. Environ. Chem. Eng. 2018, 6, 6243–6255. [Google Scholar] [CrossRef]
  52. Djema, R.; Rahma, F.; Benalia, A.; Derbal, K.; Khalfaoui, A.; Pizzi, A. Extraction and Purification of The Active Substance Contained in The Aloe Vera for Their Use as a Natural Flocculant. All Sci. Abstr. 2023, 1, 2023. [Google Scholar] [CrossRef]
  53. Khalfaoui, B.; Meniai, A.H. Removal of Copper from Industrial Wastewater by Raw Charcoal Obtained from Reeds. J. Chem. Technol. Biotechnol. 1995, 64, 153–156. [Google Scholar] [CrossRef]
  54. Khalfaoui, A.; Khelifi, M.N.; Khelfaoui, A.; Benalia, A.; Derbal, K.; Gisonni, C.; Crispino, G.; Panico, A. The Adsorptive Removal of Bengal Rose by Artichoke Leaves: Optimization by Full Factorials Design. Water 2022, 14, 2251. [Google Scholar] [CrossRef]
  55. Khalfaoui, A.; Bendjamaa, I.; Bensid, T.; Meniai, A.H.; Derbal, K. Effect of Calcination on Orange Peels Characteristics: Application of an Industrial Dye Adsorption. Chem. Eng. Trans. 2014, 38, 361–366. [Google Scholar] [CrossRef]
  56. Subramonian, W.; Wu, T.Y.; Chai, S.P. A Comprehensive Study on Coagulant Performance and Floc Characterization of Natural Cassia Obtusifolia Seed Gum in Treatment of Raw Pulp and Paper Mill Effluent. Ind. Crops Prod. 2014, 61, 317–324. [Google Scholar] [CrossRef]
  57. Yin, C.Y. Emerging Usage of Plant-Based Coagulants for Water and Wastewater Treatment. Process Biochem. 2010, 45, 1437–1444. [Google Scholar] [CrossRef]
  58. Benalia, A. Extraction and Valorization of Active Products from Natural Plants as Biocoagulants Useful in Water Quality Improvement; University of Constantine 3: The New City, Algeria, 2023. [Google Scholar]
  59. Dao, M.T.; Nguyen, V.C.N.; Tran, T.N.; Nguyen, X.D.; Vo, D.T.; Nguyen, V.K.; Hoang, L.T.T.T. Pilot-Scale Study of Real Domestic Textile Wastewater Treatment Using Cassia Fistula Seed-Derived Coagulant. J. Chem. 2021, 2021, 7608856. [Google Scholar] [CrossRef]
  60. Abujazar, M.S.S.; Karaağaç, S.U.; Ramadan, H.; Amr, S.S.A.; Alazaiza, M.Y.D. Application of Pinecones Powder as a Natural Coagulants for Sustainable Treatment of Industrial Wastewater. Desalination Water Treat. 2022, 269, 57–64. [Google Scholar] [CrossRef]
  61. Bahrodin, M.B.; Zaidi, N.S.; Kadier, A.; Hussein, N.; Syafiuddin, A.; Boopathy, R. A Novel Natural Active Coagulant Agent Extracted from the Sugarcane Bagasse for Wastewater Treatment. Appl. Sci. 2022, 12, 7972. [Google Scholar] [CrossRef]
  62. Muniz, G.L.; da Silva, T.C.F.; Borges, A.C. Assessment and Optimization of the Use of a Novel Natural Coagulant (Guazuma ulmifolia) for Dairy Wastewater Treatment. Sci. Total Environ. 2020, 744, 140864. [Google Scholar] [CrossRef]
  63. Zhao, Y.; Zhang, L.Y.; Ni, F.; Xi, B.; Xia, X.; Peng, X.; Luan, Z. Evaluation of a Novel Composite Inorganic Coagulant Prepared by Red Mud for Phosphate Removal. Desalination 2011, 273, 414–420. [Google Scholar] [CrossRef]
  64. Jiang, J.Q.; Graham, N.J.D. Pre-Polymerised Inorganic Coagulants and Phosphorus Removal by Coagulation—A Review. Water SA 1998, 24, 237–244. [Google Scholar]
  65. Moise, D.D. Coagulation and Flocculation Mechanisms of Dilute Clay Suspensions Encountered in Water Treatment; Paul Sabatier University: Toulouse, France, 2007. [Google Scholar]
  66. Fox, D.I.; Pichler, T.; Yeh, D.H.; Alcantar, N.A. Removing Heavy Metals in Water: The Interaction of Cactus Mucilage and Arsenate (As (V)). Environ. Sci. Technol. 2012, 46, 4553–4559. [Google Scholar] [CrossRef]
  67. Jeon, J.R.; Kim, E.J.; Kim, Y.M.; Murugesan, K.; Kim, J.H.; Chang, Y.S. Use of Grape Seed and Its Natural Polyphenol Extracts as a Natural Organic Coagulant for Removal of Cationic Dyes. Chemosphere 2009, 77, 1090–1098. [Google Scholar] [CrossRef]
  68. Putra, R.S.; Amri, R.Y.; Ayu, M. Turbidity Removal of Synthetic Wastewater Using Biocoagulants Based on Protein and Tannin. AIP Conf. Proc. 2020, 2242, 040028. [Google Scholar] [CrossRef]
  69. Kifuani, K.M.; Kifuani Kia Mayeko, A.; Noki Vesituluta, P.; Ilinga Lopaka, B.; Ekoko Bakambo, G.; Mbala Mavinga, B.; Muswema Lunguya, J. Adsorption of a Basic Dye, Methylene Blue, in Aqueous Solution, on a Biosorbent from Agricultural Waste of Cucumeropsis Mannii Naudin. Int. J. Biol. Chem. Sci. 2018, 12, 558. [Google Scholar] [CrossRef]
  70. Mittal, A.; Mittal, J.; Malviya, A.; Kaur, D.; Gupta, V.K. Adsorption of Hazardous Dye Crystal Violet from Wastewater by Waste Materials. J. Colloid Interface Sci. 2010, 343, 463–473. [Google Scholar] [CrossRef]
  71. Neupane, S.; Ramesh, S.T.; Gandhimathi, R.; Nidheesh, P.V. Pineapple Leaf (Ananas comosus) Powder as a Biosorbent for the Removal of Crystal Violet from Aqueous Solution. Desalination Water Treat. 2015, 54, 2041–2054. [Google Scholar] [CrossRef]
  72. Ahmad, R. Studies on Adsorption of Crystal Violet Dye from Aqueous Solution onto Coniferous Pinus Bark Powder (CPBP).). J. Hazard. Mater. 2009, 171, 767–773. [Google Scholar] [CrossRef]
  73. Shoukat, S.; Bhatti, H.N.; Iqbal, M.; Noreen, S. Mango Stone Biocomposite Preparation and Application for Crystal Violet Adsorption: A Mechanistic Study. Microporous Mesoporous Mater. 2017, 239, 180–189. [Google Scholar] [CrossRef]
Figure 1. Stages of the study.
Water 16 00260 g001
Figure 3. Chemical structure of crystal violet.
Water 16 00260 g003
Figure 4. (a) FTIR spectra of bio-coagulant PCP; (b) FTIR spectra of bio-adsorbent PCER.
Water 16 00260 g004
Figure 5. Pine cone powder (PCP) SEM at different magnitudes: (a) 100 µm, (b) 10 µm, and (c) 5 µm. Bio-adsorbent (PCER) SEM at different magnitudes: (d) 100 µm, (e) 10 µm, and (f) 5 µm.
Water 16 00260 g005
Figure 6. Effect of coagulant dosage on (a) turbidity removal, (b) COD removal, (c) phosphate removal, (d) zeta potential, and (e) final pH. Initial pH of 7.4 and settling time of 30 min.
Water 16 00260 g006
Figure 7. Effect of initial pH on (a) turbidity removal, (b) COD removal, (c) phosphate removal, (d) zeta potential, and (e) final pH. Coagulant dosage was 200 mg /L for PC powder, 200 mg/L for PC-DW, and 60 mg /L for PC-NaCl, and settling time was 30 min.
Water 16 00260 g007aWater 16 00260 g007b
Figure 8. Point of zero charge of PCER adsorbent.
Water 16 00260 g008
Figure 9. Main effects plot of pH, stirring time, concentration of CV, and adsorbent dosage on removal of CV using the PCER adsorbent.
Water 16 00260 g009
Figure 10. Surface plots for CV removal as a function of pH, stirring time (min), concentration of CV (mg/L), and adsorbent dosage (mg/L) ((a): constant concentration of CV and constant adsorbent Dosage; (b): constant Stirring Time and constant adsorbent Dosage; (c): constant Stirring Time and constant concentration of CV; (d): constant pH and constant adsorbent Dosage; (e): Constant pH and constant concentration of CV; (f): constant pH and constant Stirring Time).
Water 16 00260 g010aWater 16 00260 g010b
Table 1. Raw water characterization.
ParametersUnitValues
Industrial Tomato WastewaterAlgerian
Standards [39]
Temperature °C2030
pH/7.46.5–8.5
Salinity g/L2.9/
Conductivityms/cm6.68/
TurbidityNTU24720
TSSmg/L410–42835
CODmg/L1185.36120
Phosphate (PO43−)mg/L47.51/
Zeta potentialmV–0.1/
Table 2. Physicochemical characteristics of the dye, crystal violet.
ParametersValues
Molecular weight407.98
Molecular formulaC25H30N3Cl
Synonyms IUPAC nameBasic Violet 3, Gentian Violet N-[4-[Bis [4-dimethylamino)-phenyl]-methylene]-2,5-cyclo hexadien-1-ylidine]-N-methyl-methanaminium chloride
ʎmax589–594 nm
Table 3. Experimental range and levels of the independent factor.
Coded ValuesFactorCoded Level
−101
X1pH4710
X2Stirring time (min)2070120
X3Concentration of CV (mg/L)204570
X4Adsorbent dosage (mg/L)20110200
Table 4. Textural analysis of the bio-coagulant (PCP) and bio-adsorbent (PCER).
ParametersUnitPCPPCER
Surface area (SBET)m2/g50.01655.800
Pore volume (Vp)cc/g0.8570.396
Pore radius (dp)Å61.56461.893
Table 5. Characterization of pine cone extract.
pHProtein
mg/g
Polysaccharide
mg/g
Total Phenolic mg/g
Pine cones (DW)75.8833.623.29
Pine cones (NaCl 1 M)6.327.1829.115.48
Table 6. Results of BBD in terms of CV removal efficiency.
Standard RunpH
X1
Stirring Time (min)
X2
Concentration of CV (mg/L)
X 3
Adsorbent Dosage (mg/L)
X4
Removal of Crystal Violet (%)
14204511065.38
210204511070.87
341204511070.12
4101204511099.99
5770202068.82
6770702040.94
77702020065.37
87707020076.80
9470452049.79
101070452097.98
114704520086.71
1210704520080.22
137202011036.28
1471202011085.46
157207011036.4
1671207011044.34
174702011058.64
1810702011099.56
194707011069.90
2010707011058.77
21720452045.96
227120452057.48
237204520051.39
2471204520085.12
257704511057.29
267704511057.41
277704511057.55
Table 7. Analysis of variance (ANOVA) for the fitted quadratic polynomial model of CV removal.
Source of VarianceDegree of FreedomSum of Square (SS)Mean Square (MS)F-Valuep-Value
Model148685.62620.4024.230.000
Linear 43725.47931.3736.380.000
X11951.13951.1337.150.000
X211546.601546.6060.410.000
X31630.55630.5524.630.000
X41597.19597.1923.330.000
Square42452.38613.1023.950.000
X1211731.871731.8767.640.000
X22118.6918.690.730.410
X32142.1142.111.640.224
X421152.77152.775.970.031
2-Way Interaction 62507.77417.9616.330.000
X1X21148.60148.605.800.033
X1X31677.00677.0026.440.000
X1X41747.31747.3129.190.000
X2X31425.12425.1216.600.002
X2X41123.38123.384.820.049
X3X41386.35386.3515.090.002
Error12307.2325.60
Lack-of-fit10307.2030.21845.990.001
Pure Error20.030.02
Total268992.85
Table 8. Optimal values for removal of CV.
VariablesUnitOptimum Values
pH-10
Stirring timemin120
Concentration of CVmg/L20
Adsorbent dosagemg/L20
Disclaimer/Publisher’s Note: The statements, opinions and data contained in all publications are solely those of the individual author(s) and contributor(s) and not of MDPI and/or the editor(s). MDPI and/or the editor(s) disclaim responsibility for any injury to people or property resulting from any ideas, methods, instructions or products referred to in the content.

