Article

Application and Parameter Optimization of Electro-Kinetic Geosynthetics Electrodes Based on the Wild Horse Optimizer in Horizontal Electric Field Sludge Dewatering

1
Key Laboratory of Urban Stormwater System and Water Environment, Ministry of Education, Beijing University of Civil Engineering and Architecture, Beijing 100044, China
2
Beijing Key Laboratory of Municipal Solid Waste Detection Analysis and Evaluation, Beijing Municipal Institute of City Management, Beijing 100028, China
3
CAUPD (Beijing) Planning & Design Consultants Co., Ltd., Beijing 100044, China
*
Author to whom correspondence should be addressed.
Water 2024, 16(4), 545; https://doi.org/10.3390/w16040545
Submission received: 8 January 2024 / Revised: 3 February 2024 / Accepted: 6 February 2024 / Published: 9 February 2024

Abstract

:
This study systematically compared the performance of five corrosion-resistant electrode materials for electro-dewatering. Through a comprehensive analysis of dewatering efficiency, energy consumption, and corrosion resistance, conductive plastic composite electrodes (EKG) were selected as the optimal electrode material for experimentation. Additionally, the impact of electric field strength and electrode spacing on the efficiency and energy consumption of electro-dewatering (EDW) was investigated. The results showed that the increase in electric field intensity could improve the solid content and dewatering efficiency of the sediments, but the corresponding energy consumption also increased. The increased spacing of the plates reduced the dehydration effect and increased the energy consumption. By employing the Wild Horse Optimization algorithm, empirical and multifactorial response models for the dewatering solidification process were established, aimed at predicting the dewatering performance and energy consumption. The study concludes that for the remediation of heavy metals, the electric field strength should not exceed 10 V/cm to avoid excessive heavy metal migration and potential adverse chemical reactions.

Graphical Abstract

1. Introduction

The potential health risks of large amounts of dredged sludge have become an important worldwide issue. And it receives and then accommodates many contaminants (e.g., heavy metals, organic xenobiotics, bacteria, and viruses) from communal/industrial wastewater, agriculture, shipping, and atmospheric deposition [1]. Because of a more stringent legislation, the cost of disposing of this sludge is increasing [2]. Consequently, finding an effective method to deal with the sludge is vitally important [3].
Sludge is a highly compressible hydrophilic fluid. Sludge contains four types of water: free water (about 70%), interstitial water (about 20%), adsorbed water (about 7%), and binding water (about 3%) [4]. Because of sludge’s complex structure and water distribution, it is difficult to dewater it using any mechanical method. Conventional mechanical dewatering equipment can reduce the sludge water content only to about 75% [5].
At present, the treatment approaches for sludge dehydration mainly focus on the following: physical dehydration, geotextile bag, ultrasonic treatment, chemical dehydration, coagulation sedimentation, and biological methods [6]. Additionally, several studies have shown that electro-dewatering can be an effective method for improving sludge dewatering efficiency [3]. They used a vertical electric field for sludge electro-dewatering and applied pressure on the anode plate to perform a pressurized electro-dewatering process [7,8,9].
The mechanical–electrical dewatering process of sludge can be divided into five processes [10]. First, mechanical pressure removes most of the free water in the sludge. Second, the sludge flocs migrate to the anode. Next, when sludge cake is formed, the sludge flocs will stop migrating. The electrochemical reaction on the electrodes will then maintain the sludge system; the charge balance maintains the dewatered state. Finally, when the moisture phase is no longer continuous, the resistance of the entire system increases to generate a large amount of ohmic heat, and the entire dewatering process ends [11]. However, using a vertical electric field can lead to two problems. First, the moisture content of the sludge attached to the anode declines continually while the sludge is being dewatered. Secondly, the gas generated by the electrode reaction will concentrate between the sludge and the anode. These two phenomena will greatly increase the resistance of this system, and they will consume most of the voltage drop of the entire facility. In an attempt to solve this problem, one study applied an alternating electric field, but this approach failed to achieve the desired result [12].
Recently, some researchers have explored electro-dewatering in a horizontal electric field. Compared with widely used electro-dewatering methods operating under a vertical electric field, this approach had some benefits: simplicity of construction, efficiency, and ease of operation [13,14,15].
Previous research has investigated the use of a horizontal electric field with external pressure for dewatering, such as the study conducted by Citeau et al. [16]. Another approach, developed by Zhou et al. [17], used a relatively simple device that operates without external pressure.
The material of the electrode plate and the electric field strength could influence the electro-dewatering efficiency [18,19]. Some studies have found that inert electrode materials such as titanium have better corrosion resistance than activated metal electrodes, producing a more satisfying performance in sludge dewatering [20].
In recent years, a new material—Electro-kinetic Geosynthetics (EKG)—has been proposed for use in electro-dewatering [21]. It has been compared with some other widely used electrode materials in this field in obtaining a more practical electrode material for dewatering. Previous studies have also focused on improving the efficiency of electric power dehydration and reducing energy consumption [22,23,24]. Clearly, there is a need to construct a model of the consumption in the dewatering process in order to optimize the utilization of the electrical energy.
Our research examined the effects of electric field intensity and electrode spacing on the efficiency and energy consumption of electro-dewatering processes. The findings revealed that increasing the electric field intensity improved the solid content and dewatering efficiency of sludge, albeit with a proportional increase in energy consumption. Additionally, a greater electrode spacing resulted in decreased dewatering efficiency and higher energy consumption. Subsequently, leveraging the Wild Horse Optimization algorithm, introduced in 2021 as a novel swarm intelligence algorithm known for its simplicity [25], optimization capability, and search precision, we constructed empirical and multi-factor response models for the dewatering solidification process. Utilizing Matlab software (MATLA2018a), we fitted the moisture content curve of sludge over time, enabling the real-time prediction of sludge moisture content. It was ultimately determined that the electric field intensity for heavy metal remediation should be maintained below 10 V/cm. In conclusion, our study effectively addresses the issues of anode corrosion and energy consumption in electro-dewatering separately.

2. Materials and Methods

2.1. Sample Collection and Pretreatment

The sludge samples used in this study were sourced from Tanghe Sewage Reservoir, located in Hebei, China. Four distinct locations were identified for sample collection: #1 (115.666760° E, 38.796865° N), #2 (115.666791° E, 38.796857° N), #3 (115.666959° E, 38.796930° N), and #4 (115.66777° E, 38.796939° N). The primary characteristics of the original sludge samples are detailed in Table 1.
Before initiating the experiments, we undertook a thorough preparation process for the sediment samples. First, the samples were filtered using a 10-mesh sieve to remove larger particles, such as stones and plant fibers. Following this, we air-dried the samples for several hours until no additional water could be drained. This step was crucial to ensuring the smooth operation of the subsequent electro-dewatering process.
Once dried, the sludge samples were mixed proportionally to maintain consistency throughout our experiments. As the final step in our sample preparation, the samples were stored at a temperature of 4 °C until the time of testing.

2.2. Experimental Procedures

In this study, we adopted the latter approach, utilizing a horizontal electric field dewatering facility without external pressure. The schematic of this setup is shown in Figure 1a, and the structure of the sludge tank is depicted in Figure 1b. The tank was 20 cm long, 10 cm wide, and 10 cm high. It had 28 round holes, each with a 5 cm radius, located under the cathode area. A water-receiving funnel was positioned at the bottom of the opening, and electrode plate slots were arranged every 4 cm along the length of the tank.
To intercept soil particles, a 300-mesh filter cloth was placed at the cathode. An electronic balance recorded the mass of the water removed, which was collected in a water storage bottle. Due to the high rate of electrodynamic dewatering, we recorded the water removal quality, sediment temperature, and current intensity at various intervals: every 1 min during the first 30 min, every 5 min from 30 to 60 min, every 10 min from 60 to 120 min, and every 20 min from 120 to 240 min.
To maintain a consistent contact area between the sample and the electrode plate across the different electrode plate spacing experiments, we added a consistent amount of samples—37.5 g per cm of electrode plate spacing.
For the part of the study investigating electrode materials, we set the electrode space at 4 cm and the voltage at 30 V. We selected the EKG electrode for the studies based on the influence of electric field strength (which we discuss in detail in Section 3.2). The electrode plate spacing was fixed at 2 cm, and the voltage gradient was set to four different values: 20 V, 30 V, 40 V, and 50 V, corresponding to electric-field strengths of 10 V/cm, 15 V/cm, 20 V/cm, and 25 V/cm, respectively.
Upon completion of the dewatering process, we calculated the water content of the sludge based on the mass of the water removed. We also calculated the energy consumption of the electric dewatering of the sludge, based on the change in current.

2.3. Analysis Method for Experimental Results

The dependent variables in our study—final dry solid content, energy consumption, and dehydration yield of electro-dynamic dewatering—are expressed as functions of independent variables (referred to as response functions) and are described by Equation (1). The variance evaluation of each dependent variable is segmented into linear, quadratic, and interactive parts. Furthermore, the responses of all experimental regions were anticipated using a binary nonlinear fitting function [26,27]:
z = a + b x + c y + d x 2 + e y 2 + f x y
In Equation (1), z represents the predicted response (dry solids content, energy consumption, and dehydration yield); a is the intercept; b and c are the linear-term coefficients; d, e, and f are the quadratic-term coefficients; and x and y represent the voltage and plate spacing variables, respectively.
Determining the coefficient is essentially a process of solving an optimization problem—that is, identifying a suitable set of coefficients to minimize the mean square error (MSE) between the predicted response and the actual value.
This is where the Wild Horse Optimizer [28] plays a pivotal role. Introduced in 2021, the Wild Horse Optimizer is a novel swarm intelligence algorithm known for its outstanding simplicity, optimization capability, and search accuracy. Its advantages over earlier particle swarm optimization algorithms and simulated annealing algorithms underscore its innovative contribution to this field.
In our study, we used the MSE [29] as the fitness function (described by Equation (2)), and employed the Wild Horse Optimizer to fine-tune the parameters, thereby enhancing the model’s fitting accuracy.
M S E = 1 n i = 1 n Y i Y ^ i
In Equation (2), MSE represents the Mean Square Error, n is the number of samples, i is the sum of the errors of all the samples, Yi is the actual value, and Y ^ i is the predicted value.

3. Results and Discussion

3.1. Effect of Different Electrode Materials on Dewatering Efficiency

The changes in dehydration mass over time during the electroosmotic dewatering process with different electrode materials are shown in Figure 2a. Based on previous research [14], the electroosmotic dewatering process can be divided into three stages: rapid dehydration, slow dehydration, and minimal dehydration. As can be seen from Figure 2a, in this experiment, Stage I (0–30 min) corresponds to the rapid dehydration phase, Stage II (30–140 min) represents the slow dehydration phase, and Stage III (140–240 min) indicates the minimal dehydration phase, except for the Ti electrode.
This anomaly with the Ti electrode can be attributed to the characteristic nature of Ti as a threshold metal. When an electrical field is present, a dense metal oxide film rapidly forms on its anode, hindering further corrosion of the inner metal layer. Simultaneously, its resistance quickly increases, resulting in a rapid rise in the anode voltage drop. Consequently, the voltage drop used for the sludge cake decreases rapidly—an occurrence not conducive to dehydration.
After a comprehensive comparison of the dehydration effects of the five electrode materials, the final water removal quality was ranked as follows: EKG > Ir2O3/Ta2O5-Ti > RuO2/Ir2O3-Ti > Graphite > Ti. Compared to metal oxide-coated electrodes, the EKG electrode demonstrates a comparable, and slightly superior, dehydration performance. The Graphite electrode ranks next in efficiency, while the Ti electrode exhibits the least effective dehydration results.
Figure 2b illustrates the time-dependent changes in sludge temperature during the dehydration process with different anode materials. Irrespective of the material type, the sludge temperature saw a rapid rise within the initial 30 min after power activation, peaking between 15 and 25 min—a phase that aligns with earlier studies.
Following this initial phase, a consistent decrease in temperature was observed. This can be attributed to the low resistance of the sediment at the onset, leading to high heat production rates and a rapid temperature rise. As dehydration proceeded, the sediment’s moisture content dropped, resistance increased, and the rate of heat production slowed, causing a consequent decrease in sludge temperature.
Interestingly, the peak temperature for the electrode with the Ti-based coating occurred earlier and was higher than for the other materials. Conversely, the graphite electrode displayed the lowest peak temperature, accompanied by significant fluctuations around the peak. The EKG electrode’s peak temperature was slightly delayed compared to those observed for the other electrodes, with the highest temperature lower than that of the Ti-coated electrode.
Prior research suggests that even though a temperature rise in the sediment can lead to greater energy consumption, it facilitates water removal [30]. The increased temperature reduces soil viscosity to a certain extent, accelerating water molecule movement.
During the slow dehydration phase following the initial 30 min, the sludge temperature under the EKG electrode was consistently higher than that under the other electrodes. Upon examining Figure 2a, it can be seen that the EKG electrode also maintained a higher dehydration rate than the other electrodes during this stage, and it achieved the greatest volume of water removal by the end of the slow dehydration stage. These findings not only reaffirm that an increase in temperature facilitates water removal; they also demonstrate the superior effectiveness of the EKG electrode in electroosmotic dewatering.
Figure 2c presents the variation in current during the dewatering process for the four types of electrodes. Notably, barring the Ti anode, an initial brief increase in current was observed in the process, followed by a swift decline after peaking.
This initial surge in current can be primarily attributed to the fact that the voltage was predominantly applied to the sludge cake at the process’s inception. At this stage, polar water molecules and electrolyte ions were moving rapidly. Concurrently, moisture was accumulating on the cathode, while it had not yet dissipated at the anode.
Such conditions led to a decrease in the resistance between the electrode plate and the soil. Consequently, the sludge cake’s temperature skyrocketed, and the thermal motion of water molecules and other ions accelerated. This, in turn, reduced the sludge cake’s resistance, causing a short-term increase in the current [31,32].
As the process continued, the moisture content of the mud cake decreased. This led to a drastic increase in resistance near the anode within the sludge, and the current consequently dropped significantly.
Figure 2d illustrates the energy consumption per unit mass of water removed after electroosmotic dewatering using the different electrode materials. The energy consumption for the Ti, RuO2/Ir2O3-Ti, EKG, Ir2O3/Ta2O5-Ti, and Graphite electrodes per unit mass of water removed were 0.299 kWh/kgH2O, 0.359 kWh/kgH2O, 0.346 kWh/kgH2O, 0.359 kWh/kgH2O, and 0.379 kWh/kgH2O, respectively. A lower energy consumption indicates a higher energy utilization efficiency.
Therefore, the relative energy utilization efficiencies of the five types of electrodes during the electroosmotic dewatering process are as follows: Ti > RuO2/Ir2O3-Ti > EKG > Ta2O5-Ti > Graphite. Excluding the Ti electrode, the RuO2/Ir2O3-Ti and EKG electrodes demonstrated superior performance, followed by the Ir2O3/Ta2O5-Ti electrode, with the Graphite electrode performing the worst.
In the present study, we conducted a fitting of the energy consumption and water removal quantity during the dehydration process for the different electrode materials. This resulted in obtaining both actual change curves and fitting curves for dehydration energy consumption and dehydration quality for each electrode material.
Figure 3 presents these findings. Impressively, the curves for all five test groups demonstrate a linear relationships, which can be expressed as (Equation (3)):
y = ax + b
where “a” and “b” are fitting coefficients. These coefficients are influenced by the electrode material and the physicochemical properties of the underlying mud.
In the context of this study, the voltage applied directly to the two sides of the soil for electrical dehydration is defined as the effective voltage (Ve). Given the existence of an interface resistance between the polar plate and the soil, the expression for the effective voltage is given by (Equation (4)):
Ve = V0 − Vc − Vd
Here, V0, Vc, and Vd represent the power supply output voltage, the anode potential drop, and the cathode potential drop, respectively.
During the electrical dehydration process, the slope of the fitted curve is inversely proportional to the energy consumption utilization rate. According to Equation (2), if the effective voltage (Ve) increases while the power supply output voltage (V0) remains unchanged, a smaller anode potential drop (Vc) would indicate a more stable electrode.
The fitting results shown in Figure 3 reveal that the order of the slopes of the curve is RuO2/Ir2O3-Ti < EKG < Ir2O3/Ta2O5-Ti < Graphite < Ti. Therefore, the RuO2/Ir2O3-Ti and EKG electrodes exhibited the greatest stability.
Figure 4 provides a visual representation of the corrosion observed in several anode anti-corrosion electrodes after being energized for 240 min. Notably, the Ti electrode underwent a considerable color change on its surface. This alteration was attributed to the formation of an oxide film [33], which effectively prevented internal corrosion. In contrast, the RuO2/Ir2O3-Ti– and Ir2O3/Ta2O5-Ti–coated electrodes demonstrated negligible corrosion. This observation underscores the superior anti-corrosion properties of these electrodes, a characteristic that has earned them frequent use in the field of electrochemistry. However, the graphite electrodes displayed a significantly higher degree of corrosion. Evidence of extensive pitting was apparent, likely due to fluctuating current during the dehydration process. Last but not least, the EKG materials showed no discernible corrosion on the electrode. These electrodes are made of polymers such as polyethylene (PE) and polypropylene (PP) to make a grooved substrate on both sides, and materials such as graphite and carbon black are added to the polymer to make it conductive. They will not corrode as fast as regular electrodes since they are coated with an inert polymer. Though covering the metallic filaments in a somewhat inert polymer might increase resistance, the difference is not significant.

3.2. Influence of Electric Field Strength on EDW

Analysis of Figure 5 suggests a tripartite division of the dewatering process into distinct stages of rapid dehydration, slow dehydration, and minimal dehydration. The rate of dehydration, denoted by the curve’s slope, progressively diminishes, culminating in a plateau of water removal and a stabilization of the final dehydration effect. Concurrently, the electric current exhibits a transient initial increase followed by a swift decrease, eventually tapering off to zero. The temperature profile is characterized by a rapid ascendancy, subsequent decline, and ultimate stabilization around ambient conditions.
A close examination of the trend across these three parameters reveals a noteworthy alignment between the rapid dehydration stage and the periods of swift temperature surge and current decline in the sludge. The transition to the slow dehydration phase coincides with the temperature peaking, mirrored by a slower decrement in the electric current. As dehydration enters the negligible stage, both the temperature and the current approach a state of stability. The primary factor contributing to sludge cracking is the removal of moisture from the sludge. As the dewatering process enters its final stage, the sludge undergoes rapid and slow dewatering phases. Following electrolysis and heating, the inherent water content of the sludge is significantly reduced. The cracking of the sludge results in increased cake resistance, leading to a decrease in current and a slower rate of heat generation.
We can see from Figure 6a that with an increase in voltage, the initial rate of the electrodynamic dehydration stage also rose. When the voltages were 20 V, 30 V, 40 V, and 50 V, the times required to reach the basic non-dehydration stage were 100 min, 80 min, 55 min, and 100 min, respectively. The final moisture contents of the four groups of experimental samples were 60.3%, 50.16%, 48.05%, and 47.12%. It can be seen that as the voltage increased, the final moisture content of the sediment decreased, indicating that larger electric field strength contributed to the final electrodynamic dehydration and curing effect. As the voltage increased from 20 V to 30 V, the rate of dewatering increased by 10.14%. However, when the voltage increased from 30 V to 40 V and from 40 V to 50 V, the rate of dehydration increased by 2.11% and 0.93%, respectively. According to the experimental results depicted in Figure 6a, during the dewatering process, if the voltage continued to increase at the higher voltages, the improvement in dehydration rate gradually decreased, perhaps because the sludge layer near the anode dried and cracked under the large electric field strength. One possible explanation for this result is that a high voltage could lead to excessive current, which might cause a large amount of gas near the anode drying electrode to increase the resistance. Another possibility is that the cracking of the sludge near the anode led to a reduction in the contact area between the sludge cake and the electrode plate.
Figure 6b shows the temperature variation curve for the sediment in the electric dehydration process. The times required to reach the highest temperature, for the four groups of experimental samples, were 17 min, 14 min, 10 min, and 7 min. The highest temperatures reached were 84.3 °C, 93.9 °C, 99.1 °C, and 99.5 °C. It can be seen that it took more time to reach the peak temperature when the voltage was higher. The peak temperature itself also rose with the voltage. When the voltage increased from 20 V to 30 V, the peak temperature increased by 9.6 °C, while when the voltage increased from 30 V to 40 V and from 40 V to 50 V, the peak temperatures increased by 5.2 °C and 0.4 °C, respectively. It can be concluded, then, that “40 V” was the extreme point in this experiment. After this point, the temperature increased less as the voltage rose. As mentioned above, dewatering occurred mainly in the rapid dehydration stage, as expected for the rapid temperature rise. The increase in temperature was beneficial to the removal of water. The experiment also showed that as the voltage increases, the temperature drops more sharply from its peak value, and the improvement in the dehydration rate decreases. The higher voltage improves the dehydration effect as the water content decreases, but the drying out of the anode then causes the soil to crack, increasing the resistance [24,32].
Figure 6c outlines the variation in the loop current over time under different voltage settings. The initial currents for the voltages of 20 V, 30 V, 40 V, and 50 V were 1.34 A, 2.50 A, 3.35 A, and 3.38 A, respectively. This indicates a direct relationship between voltage and initial current, with the latter escalating as the voltage increases. In the first 60 min of the experiment, a rapid decrease in the current was observed across all groups, particularly in the first half hour. Beyond the 60 min mark, the currents for all four groups was stabilized, gravitating toward 0.01 A. However, a deviation was observed during the initial 60 min period at different voltages. The initial current values were higher at 40 V and 50 V, but these also experienced a sharper decline. This rapid decrease was especially pronounced at 50 V, where the accelerated dewatering process caused the sediments around the anode to dry out quickly, leading to significant soil cracking. This soil cracking increased the sediment resistance, which subsequently resulted in a decrease in the loop current. Thus, it can be concluded that as the voltage increased, the current decayed more quickly.
We employed MATLAB software (MATLAB2018a) and incorporated the Wild Horse Algorithm to fit the curve representing the change in sediment moisture content over time in the electrodynamic sediment dewatering test. After several iterations, an effective fit was achieved using both exponential and Gaussian functions. The results of this fitting process are shown in Table 2.
Upon analysis, it was evident that the degree of fit (R2) for the two-dimensional Gaussian function was higher than the exponential function across all groups in the dewatering experiment tests conducted at various voltages. This observation suggests that the relationship between water content and time during the process of the electrodynamic dehydration of the sediment better aligns with the two-dimensional Gaussian function. The empirical model for this relationship is presented in Equation (5), where a1, b1, a2, and b2 are empirical constants.
Water   content = a 1 e T b 1 c 1 2 + a 2 e T b 2 c 2 2
Leveraging this equation, we were able to obtain real-time predictions of the sediment’s water content. These findings not only highlight the effectiveness of our approach but also provide useful insights for future investigations in this area.
Several previous studies have found a linear relationship between the dehydration rate and the current [33,34]. Consistent with this, [35] discovered that the electrodynamic dehydration effect was more pronounced at higher applied current densities.
In our study, the observation of Figure 7 reveals an obvious trend: the degree of curve fitting increases with the voltage. A closer look at the four fitting curves demonstrates that the actual flow rate near the current 0.5 A exceeds the midpoint of the fitting curve. When we juxtapose this with Figure 5, it becomes apparent that a current of 0.5 A corresponds to the peak temperature of the sediment.
Based on these observations, we conjectured that the dehydration rate is influenced not just by the current density, but also by the temperature of the sediment.
Figure 8a illustrates the total energy consumption and the specific energy consumption for the removal of a unit mass of water during 240 min of dewatering at different voltages. At a voltage of 20 V, the total energy consumed is 9.32 Wh; at 30 V, it is 11.64 Wh; at 40 V, it rises to 16.31 Wh; and at 50 V, it reaches 20.49 Wh. It is apparent that the total energy consumption for dewatering is greatly influenced by the applied voltage, indicating that the electric field strength is a critical factor affecting the energy consumption of electro-dewatering processes.
Given a constant plate spacing, an increase in voltage benefits the dehydration process. However, it also results in elevated energy consumption. Thus, in line with the findings of [33], the selection of an appropriate voltage requires a careful balance between energy consumption and the effectiveness of dehydration.
Scholars have determined that the minimum energy consumption for thermal drying corresponds to the latent heat of evaporation of water [33], which is approximately 0.617 kWh/kgH2O. In industrial equipment, the energy consumption for thermal drying can reach 1.2 kWh/kg [36,37].
Observing Figure 4, Figure 5, Figure 6, Figure 7 and Figure 8, the specific energy consumption for the removal of a unit mass of water by electrode watering at voltages of 20 V, 30 V, 40 V, and 50 V are 0.32 kWh/kgH2O, 0.30 kWh/gH2O, 0.41 kWh/kgH2O, and 0.51 kWh/kgH2O, respectively. The energy consumption for electrode watering is lower at low and medium voltages. When comparing the operational costs of electro-dewatering and thermal drying processes, the energy cost of the electro-dewatering process is significantly lower than that of the thermal drying process. From 20 V to 50 V, the energy consumption for electro-dewatering is 17.34–51.38% lower than the minimum energy consumption for thermal drying processes.

3.3. Influence of Inter-Plate Distance on EDW

Figure 9a depicts the variation of sludge moisture content over time during the electro-dewatering process at different plate spacings. It can be observed from the graph that, under the same electric field strength of 5 V/cm, varying plate spacings result in distinctly different dewatering outcomes. After a dewatering duration of 240 min, the final moisture contents of the sludge at plate spacings of 4 cm, 6 cm, and 8 cm were 59.24%, 67.42%, and 68.07%, respectively. It is evident that larger plate spacings correspond to higher final moisture contents, indicating a decline in dewatering efficiency. The times taken for the sludge to reach a moisture content of 70% in the three experimental setups were 55 min, 100 min, and 160 min, respectively. Therefore, at a constant electric field strength, increasing plate spacing leads to a slower dewatering rate and a reduced final dewatering efficiency.
Figure 9b illustrates a consistent temperature trend for sludge at different electrode spacings, where the temperature initially increases before decreasing, with peak temperatures for all test groups reached within 60–80 min. Under an electric field strength of 5 V/cm, the peak temperatures corresponding to electrode spacings of 4 cm, 6 cm, and 8 cm were 58.1 °C, 66.5 °C, and 78.8 °C, respectively. In general, during the dewatering process at a constant electric field strength, a larger electrode spacing results in a higher sludge temperature, indicating increased heat generation and consequently higher thermal energy consumption.
An observation of Figure 9c reveals that irrespective of the electrode spacing, there is an initial transient increase in current at the onset of electrification, followed by a de-cline, and, eventually, the current stabilizes. The graph indicates that larger electrode spacings correspond to higher initial current values, with spacings of 4 cm, 6 cm, and 8 cm associated with initial currents of 0.72 A, 0.79 A, and 0.96 A, respectively. During the first 100 min, the larger the electrode spacing, the higher the current value observed. After 100 min, the current values for spacings of 4 cm and 6 cm show minimal differences, and beyond 200 min, the current values for the three electrode spacings are approximately consistent. The times taken for the current to drop to 0.1 A for electrode spacings of 4 cm, 6 cm, and 8 cm are 90 min, 100 min, and 180 min, respectively.
Figure 9d presents a bar chart depicting the specific energy consumption for the removal of a unit mass of water and the thermal drying energy consumption at the end of the dewatering process for different electrode spacings. At an electrode spacing of 4 cm, the energy consumption after 240 min of dewatering is 0.25 kWh/kgH2O. This value increases to 0.32 kWh/kgH2O for a spacing of 6 cm and further to 0.44 kWh/kgH2O for an 8 cm spacing. It is evident that the specific energy consumption for sludge dewatering escalates with increasing electrode spacing, with the effect becoming more pronounced at larger spacings. For instance, an increase in electrode spacing from 4 cm to 6 cm results in a 28% rise in energy consumption, while a further increase from 6 cm to 8 cm leads to a 37.5% increment, equivalent to a 0.34-fold increase. Nevertheless, these values remain below the minimum energy consumption for thermal drying, with the three experimental setups exhibiting 28.7–59.5% lower energy consumption compared to thermal drying.

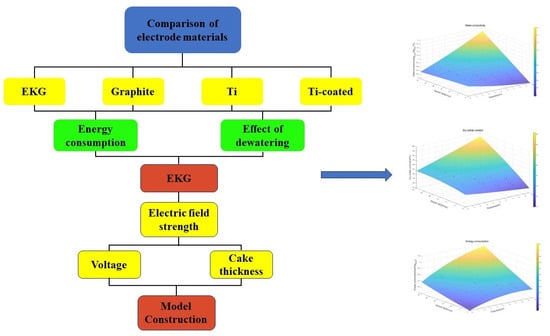
3.4. Construction of Prediction Model

In the field of sludge dewatering, controlling and optimizing operational conditions is essential to enhance efficiency and achieve desirable results. In this context, we established a response model that accounts for two key variables: electric field strength and plate spacing.
The electric field strength, in our model ranges from 0 to 25 V/cm, and the plate spacing varies from 2 to 8 cm. These ranges were determined based on our experimental setup and the constraints of our equipment.
We implemented the Wild Horse Algorithm in our model to predict the response interval. This algorithm, known for its robustness and accuracy, helps us understand the impact of changing operational conditions on the final solid content capacity and dewatering yield.
To ensure the validity of our model, we conducted a model verification process. This involved comparing the model’s predictions against actual experimental results in order to ascertain the model’s predictive capability.
We also carried out a significance analysis to ascertain the statistical significance of our findings and to help us ensure that the observed effects were not merely due to chance.
Drawing on insights from the response model, we can optimize the operational conditions for electrodynamic sediment dewatering. By adjusting the electric field strength and plate spacing according to the model’s predictions, we can maximize the final solid content capacity and dewatering yield.
This approach not only improves the efficiency of the dewatering process but also provides a methodological framework that other researchers can use to optimize similar systems. Beyond its immediate application, this model serves as a valuable contribution to the broader field of sediment management and environmental engineering.
Figure 10a illustrates the variation curve of the final solid content and the electric-field intensity at different plate spacings. It becomes evident that with a specific plate spacing, the final solid content of the sediments undergoing electrical dewatering increases with the electric field intensity. This relationship, however, is not linear.
In the initial stages, substantial increases in final solid content are observed with increments in electric field intensity. For instance, when the electric field intensity is increased from 10 V/cm to 15 V/cm, the dry solid content is boosted from 39.7% to 49.84%, marking an increase of 25.54%.
However, beyond an electric field intensity of 10 V/cm, further increases in the field intensity result in relatively smaller increments in the final solid content. As an example, a rise in electric field strength to 20 V leads to a mere 4.23% increase in dry solid content (49.84% to 51.95%).
This indicates, as supported by [15], that the impact of increasing electric field strength on the final solid content is significant at a low electric field strength but diminishes as the field strength increases beyond a certain point. It reaffirms the necessity of optimizing electric field intensity to achieve efficient sediment dewatering.
Figure 10b shows the response model of the final solid content affected by the electric field intensity and plate spacing, and its functional relationship is shown in Equation (6):
Z = 36.4273017 − 1.9873478x + 0.80859633y + 0.03050157x2 − 0.01622y2 + 0.2038898xy
(R2 = 0.9286947, MSE = 3.7321915)
where x and y represent plate spacing and electric field strength, respectively, and Z represents the final solid content. From Equation (6), it can be found that without considering the expression of quadratic and interaction terms, Z is negatively correlated with x and positively correlated with X, indicating that the final solid content is negatively correlated with plate spacing and positively correlated with electric field intensity. Therefore, increasing plate spacing is not conducive to improving the final solid content, but increasing electric field intensity is.
As depicted in Figure 10c, the relationship between energy consumption per unit mass of water and electric field intensity is demonstrated at different plate spacings. For a given plate spacing, the energy consumption of electro-dynamic dehydration for sediment escalates with increasing electric field intensity. Similarly, at a constant electric field intensity, the energy consumption of electro-dynamic dehydration rises with an increase in plate spacing.
The practicality of electro-dynamic dehydration predominantly hinges on the cost of power. When energy consumption becomes too high, the technology loses its practicality, rendering it an inefficient solution. Consequently, the application of a low electric field intensity holds practical significance for enhancing the cost efficiency of electrodynamic dehydration.
This observation aligns with the findings of [37], who established that the appropriate application of electric fields can result in significant energy savings. Therefore, by optimizing the electric field intensity and plate spacing, we can strike a balance between operational efficiency and energy consumption, thereby improving the overall cost efficiency of sediment dewatering processes.
Figure 10d shows the response model of dehydration energy consumption affected by electric field intensity and plate spacing, and its functional relationship is shown in Equation (7):
Z = 0.00102 + 0.07226473x + 0.0098334y − 0.0045783x2 + 8.1675 × 10⁻⁵y2 + 0.0016057xy
(R2 = 0.7174657, MSE = 0.0012978)
where x and y represent plate spacing and electric field intensity, respectively, and Z represents the energy consumption per unit mass of water removed. From Equation (7), it can be found that without considering the expression of quadratic and interaction terms, Z and x are positively correlated, indicating that the final solid content is positively correlated with plate spacing and electric field intensity. Therefore, increasing plate spacing and electric field intensity will increase energy consumption, which is not conducive to energy saving or consumption reduction.
The rate of water yield is defined as the mass unit of filtrate (kgH2O/(kg·h) per kilogram of solid content per hour. The relationship between water yield and electric field strength under different plate spacings is shown in Figure 9e, which is similar to Figure 10a. It can be seen that the higher the electric field strength, the higher the rate of dehydration. After the electric field strength rose above 10 V/cm, the dehydration yield grew more slowly with the increase in electric field strength. Therefore, increasing the electric field strength at a low electric field intensity (<10 V/cm) was more effective for improving the dehydration yield.
Figure 10f shows the response model of water loss rate affected by electric field intensity and plate spacing, and its function relationship is shown in Equation (8):
Z = 0.5 − 0.0763388x − 0.0042212y + 0.0023774 x2 − 3.361 × 10⁻⁵ y2 + 0.0066174xy
(R2 = 0.9304939, MSE = 0.0009287)
where x and y represent plate spacing and electric field intensity, respectively, and Z is the dehydration rate. It can be found from Equation (8) that when quadratic and interactive expressions are not considered, Z is negatively correlated with x and positively correlated with y, which indicates that the water removal rate is negatively correlated with plate spacing and positively correlated with electric field intensity. Therefore, neither increasing plate spacing nor reducing electric field intensity is conducive to improving the water removal rate.

3.5. Discussion on Material and Energy Consumption of Electro-Dewatering

The application of electro-dewatering on river sediment was investigated using a cake thickness of 4 cm and a voltage of 30 V. This procedure involved five types of electrode materials: EKG, Ti, RuO2/Ir2O3-Ti, Graphite, and Ir2O3/Ta2O5-Ti, all tested over a period of 4 h. The experimental findings demonstrate that the EKG electrode performs exceptionally well in terms of stability during the dewatering process and energy consumption. Zhang, Mahmoud et al. [37,38] have also researched materials for electro-dewatering, utilizing active electrodes such as iron, copper, and aluminum. During the electro-dewatering process, the electrolysis of water occurs at both the anode and cathode, with oxygen evolving at the anode, leading to a lower pH near the anode. This acidic environment tends to cause corrosion of the metal electrodes, resulting in the formation of oxides with high electrical resistance, which increases energy consumption and decreases dewatering efficiency. Additionally, the corrosion may lead to secondary contamination with metal ions. Furthermore, metal electrodes are comparatively expensive, adding to the cost. Therefore, EKG electrodes offer significant advantages in terms of dewatering rate, energy consumption, and corrosion resistance, showing promising prospects for development in the field of electro-dewatering research.
To further explore the impact of electric field strength and electrode spacing on sludge dewatering parameters, a predictive model using EKG electrodes was established and detailed studies were conducted. Experimental results indicate that an increase in electric field strength can enhance the solid content and dewatering efficiency of the sludge, but it also increases energy consumption. Increasing the electrode spacing decreases the dewatering effectiveness and additionally increases energy consumption. Wu, P et al. reviewed the influence of process parameters and their interactions on electro-dewatering performance, but they did not pinpoint a specific threshold for electric field intensity. Apparently, there is a need to construct a model of the consumption in the dewatering process in order to optimize the utilization of the electrical energy. Using sludge cake samples with thicknesses of 2 cm, 4 cm, 6 cm, and 8 cm, treated under electric fields of 20 V, 30 V, 40 V, and 50 V, we constructed a response model for electric field strength and electrode spacing using the Wild Horse Optimization algorithm. The findings revealed that the models for final solid content, energy consumption, and dewatering yield had R-squared values of 0.9286947, 0.7174657, and 0.9304939, respectively, indicating high model significance. The final solid content and energy consumption are more influenced by electric field strength, whereas the dewatering yield is affected more by electrode spacing. To enhance dewatering effectiveness and reduce energy consumption, the electric field strength should be <10 V/cm.

4. Conclusions

In our study, four conventional electrode materials—titanium (Ti), titanium coated with a mixture of ruthenium dioxide and iridium oxide (RuO2/Ir2O3-Ti), graphite, and titanium coated with a mixture of iridium oxide and tantalum pentoxide (Ir2O3/Ta2O5-Ti)—were evaluated against expanded graphite (EKG) electrodes in electro-dewatering applications. The comparative experiments substantiated the superior dewatering efficiency and energy consumption profile of the EKG electrodes. Further experiments utilizing EKG as the electrode material investigated the influence of electric field strength and electrode spacing on the efficiency of electro-dewatering. The results indicated that electric field strength is a critical parameter affecting electro-dewatering efficiency.
Subsequently, a response function modeling the influence of electric field strength and electrode spacing on the final solids content was developed using the Wild Horse Optimization algorithm within the MATLAB software (MATLAB2018a) environment. This model identified a critical operational threshold for electric field strength at 10 V/cm to maximize dewatering effects without incurring unnecessary energy expenditure.
In summary, EKG electrodes have emerged as the material of choice for electro-dewatering applications, offering an optimal balance between dewatering performance and cost efficiency.

Author Contributions

Conceptualization, Y.S., Y.K. and D.Y.; methodology, Y.S., S.W., J.W., C.Z., Y.K. and D.Y.; formal analysis, Y.S., S.W., C.Y., C.W., Y.K. and D.Y.; investigation, Y.S.; writing—original draft, Y.S.; writing—review & editing, S.W., C.Y., C.W., Y.K. and D.Y.; funding acquisition, D.Y. All authors have read and agreed to the published version of the manuscript.

Funding

This work was supported by the National Natural Science Foundation of China (52170097), Beijing Natural Science Foundation (9222017), the Project of Construction and Support for high-level Innovative Teams of Beijing Municipal Institutions (BPHR20220108), the Open Research Fund of State Environmental Protection Key Laboratory for Lake Pollution Control (2022HPYB-06), and the Fundamental Research Funds for the Central Public-interest Scientific Institution (2022YSKY-02).

Data Availability Statement

Data are contained within the article.

Conflicts of Interest

Author Jiazhuo Wang, Chen Wang, Chunyang Zhang were employed by the company of China Urban Planning and Design Institute Beijing Company. The remaining authors declare that the research was conducted in the absence of any commercial or financial relationships that could be construed as a potential conflict of interest.

References

  1. Li, Y.; Yang, F.; Miao, S.; Wang, D.; Li, Z.; Yuan, X.; Yuan, L.; Liu, Q. Achieved deep-dewatering of dredged sediments by Fe(II) activating persulfate pretreatment: Filtrating performance and mechanistic insights. Chem. Eng. J. 2021, 405, 126847. [Google Scholar] [CrossRef]
  2. Chu, X.; Ni, Y.; Wang, X.; Chu, Z. A win-win situation for environment and economy: Analysis of maximizing benefits in municipal sludge treatment plants. J. Clean. Prod. 2023, 419, 138271. [Google Scholar] [CrossRef]
  3. Sun, X.; Ma, D.; Lin, S.; Wang, Y.; Liu, Q. Research on push-type sludge electro-dewatering equipment with fixed-plate electrodes. Sep. Purif. Technol. 2021, 267, 118612. [Google Scholar] [CrossRef]
  4. Yuan, H.; Zhu, N. Progress of improving waste activated sludge dewaterability: Influence factors, conditioning technologies and implications and perspectives. Sci. Total Environ. 2023, 912, 168605. [Google Scholar] [CrossRef] [PubMed]
  5. Vorobiev, E. Predictive model of constant rate expression for dewatering of semi-solid materials. Chem. Eng. Sci. 2023, 272, 118588. [Google Scholar] [CrossRef]
  6. Wei, Q.; Liu, X.; Zhang, Y.; Zhang, K.; Li, Z.; Shen, Z.; Chow, C.W.K. Effect of tannic acid on the dewaterability of dredged sediment and the conditioning mechanism. J. Environ. Chem. Eng. 2021, 9, 104899. [Google Scholar] [CrossRef]
  7. Zhang, Y.; Lian, G.; Dong, C.; Cai, M.; Song, Z.; Shi, Y.; Wu, L.; Jin, M.; Wei, Z. Optimizing and understanding the pressurized vertical electro-osmotic dewatering of activated sludge. Process Saf. Environ. Prot. 2020, 140, 392–402. [Google Scholar] [CrossRef]
  8. Sha, L.; Wu, Z.; Ling, Z.; Liu, X.; Yu, X.; Zhang, S. Dewaterability and energy consumption of electro-dewatered sludge near the anode and the cathode during electro-dewatering process. J. Environ. Chem. Eng. 2021, 9, 105729. [Google Scholar] [CrossRef]
  9. Li, C.; Zhao, M.; Ma, D.; Jia, X.; Zhang, F. Optimization of electro-dewatering performance of oily sludge by voltage control and coal-powdered activated carbon (CPAC) addition. J. Clean. Prod. 2023, 426, 139111. [Google Scholar] [CrossRef]
  10. Liu, W.-H.; Zhang, H.; Zhang, Y.-L.; Sun, P.; Zeng, Y.-P.; Gao, Y.-Y.; Wang, H.-F.; Zeng, R.J. Beyond filterability: Understanding the complexities of sludge dewatering through typical coagulation and advanced oxidation. J. Clean. Prod. 2023, 429, 139520. [Google Scholar] [CrossRef]
  11. Li, Y.; Liu, L.; Li, X.; Xie, J.; Guan, M.; Wang, E.; Lu, D.; Dong, T.; Zhang, X. Influence of alternating electric field on deep dewatering of municipal sludge and changes of extracellular polymeric substance during dewatering. Sci. Total Environ. 2022, 842, 156839. [Google Scholar] [CrossRef]
  12. Yoshida, H.; Kitajyo, K.; Nakayama, M. Electroosmot1c Dewatering under A. C. Electric Field with Periodic Reversals of Electrode Polarity. Dry. Technol. 1999, 17, 539–554. [Google Scholar] [CrossRef]
  13. Guo, X.; Wang, Y.; Wang, D. Permanganate/bisulfite (PM/BS) conditioning–horizontal electro-dewatering (HED) of activated sludge: Effect of reactive Mn(III) species. Water Res. 2017, 124, 584–594. [Google Scholar] [CrossRef] [PubMed]
  14. Wu, P.; Shi, Y.; Wang, Z.; Xiong, Z.; Liu, D.; Gerson, A.R.; Pi, K. Effect of electric field strength on electro-dewatering efficiency for river sediments by horizontal electric field. Sci. Total Environ. 2019, 647, 1333–1343. [Google Scholar] [CrossRef] [PubMed]
  15. Rao, B.; Pang, H.; Fan, F.; Zhang, J.; Xu, P.; Qiu, S.; Wu, X.; Lu, X.; Zhu, J.; Wang, G.; et al. Pore-scale model and dewatering performance of municipal sludge by ultrahigh pressurized electro-dewatering with constant voltage gradient. Water Res. 2021, 189, 116611. [Google Scholar] [CrossRef] [PubMed]
  16. Xue, Z.; Tang, X.; Yang, Q. Influence of voltage and temperature on electro-osmosis experiments applied on marine clay. Appl. Clay Sci. 2017, 141, 13–22. [Google Scholar] [CrossRef]
  17. Guo, X.; Qian, X.; Wang, Y.; Zheng, H. Magnetic micro-particle conditioning–pressurized vertical electro-osmotic dewatering (MPEOD) of activated sludge: Role and behavior of moisture and organics. J. Environ. Sci. 2018, 74, 147–158. [Google Scholar] [CrossRef] [PubMed]
  18. Zhang, Y.; Cao, M.; Lv, H.; Wei, J.; Gu, Y.; Liu, D.; Zhang, W.; Ryan, M.P.; Wu, X. Electrodeposited nanometer-size IrO2/Ti electrodes with 0.3 mg IrO2 cm−2 for sludge dewatering electrolysers. Electrochim. Acta 2018, 265, 507–513. [Google Scholar] [CrossRef]
  19. Martin, L.; Alizadeh, V.; Meegoda, J. Electro-osmosis treatment techniques and their effect on dewatering of soils, sediments, and sludge: A review. Soils Found. 2019, 59, 407–418. [Google Scholar] [CrossRef]
  20. Zhang, Q.; Cui, G.; He, X.; Wang, Z.; Tang, T.; Zhao, Q.; Liu, Y.-S. Effects of voltage and pressure on sludge electro-dewatering process and the dewatering mechanisms investigation. Environ. Res. 2022, 212, 113490. [Google Scholar] [CrossRef]
  21. Deng, W.; Lai, Z.; Hu, M.; Han, X.; Su, Y. Effects of frequency and duty cycle of pulsating direct current on the electro-dewatering performance of sewage sludge. Chemosphere 2020, 243, 125372. [Google Scholar] [CrossRef] [PubMed]
  22. Ma, D.; Su, M.; Qian, J.; Wang, Q.; Meng, F.; Ge, X.; Ye, Y.; Song, C. Heavy metal removal from sewage sludge under citric acid and electroosmotic leaching processes. Sep. Purif. Technol. 2020, 242, 116822. [Google Scholar] [CrossRef]
  23. Citeau, M.; Larue, O.; Vorobiev, E. Influence of salt, pH and polyelectrolyte on the pressure electro-dewatering of sewage sludge. Water Res. 2011, 45, 2167–2180. [Google Scholar] [CrossRef] [PubMed]
  24. Zhou, J.; Liu, Z.; She, P.; Ding, F. Water Removal from Sludge In a Horizontal Electric Field. Dry. Technol. 2001, 19, 627–638. [Google Scholar] [CrossRef]
  25. Shoesmith, E.; Box, G.E.P.; Draper, N.R. Empirical Model-Building and Response Surfaces; Wiley: Hoboken, NJ, USA, 1988; Volume 37, p. 82. [Google Scholar]
  26. Mahmoud, A.; Olivier, J.; Vaxelaire, J.F.; Hoadley, A. Electro-dewatering of wastewater sludge: Influence of the operating conditions and their interactions effects. Water Res. 2011, 45, 2795–2810. [Google Scholar] [CrossRef] [PubMed]
  27. Naruei, I.; Keynia, F. Wild horse optimizer: A new meta-heuristic algorithm for solving engineering optimization problems. Eng. Comput. 2021, 38, 3025–3056. [Google Scholar] [CrossRef]
  28. Hodson, T.O. Root-mean-square error (RMSE) or mean absolute error (MAE): When to use them or not. Geosci. Model Dev. 2022, 15, 5481–5487. [Google Scholar] [CrossRef]
  29. Weber, K.; Stahl, W.P.D. Improvement of filtration kinetics by pressure electrofiltration. Sep. Purif. Technol. 2002, 26, 69–80. [Google Scholar] [CrossRef]
  30. Reddy, K.R.; Urbanek, A.; Khodadoust, A. Electroosmotic dewatering of dredged sediments: Bench-scale investigation. J. Environ. Manag. 2006, 78, 200–208. [Google Scholar] [CrossRef]
  31. Glendinning, S.; Mok, C.K.; Kalumba, D.; Rogers, C.D.F.; Hunt, D.V.L. Design Framework for Electrokinetically Enhanced Dewatering of Sludge. J. Environ. Eng. 2010, 136, 417–426. [Google Scholar] [CrossRef]
  32. Olivier, J.; Conrardy, J.-B.; Mahmoud, A.; Vaxelaire, J.F. Electro-dewatering of wastewater sludge: An investigation of the relationship between filtrate flow rate and electric current. Water Res. 2015, 82, 66–77. [Google Scholar] [CrossRef]
  33. Yu, W.; Yang, J.; Wu, X.; Gu, Y.; Xiao, J.; Yu, J.; Shi, Y.; Wang, J.; Liang, S.; Liu, B.; et al. Study on dewaterability limit and energy consumption in sewage sludge electro-dewatering by in-situ linear sweep voltammetry analysis. Chem. Eng. J. 2017, 317, 980–987. [Google Scholar] [CrossRef]
  34. Mahmoud, A.; Hoadley, A.; Citeau, M.; Sorbet, J.M.; Olivier, G.; Vaxelaire, J.F.; Olivier, J. A comparative study of electro-dewatering process performance for activated and digested wastewater sludge. Water Res. 2018, 129, 66–82. [Google Scholar] [CrossRef] [PubMed]
  35. Mahmoud, A.; Hoadley, A.; Conrardy, J.-B.; Olivier, J.; Vaxelaire, J.F. Influence of process operating parameters on dryness level and energy saving during wastewater sludge electro-dewatering. Water Res. 2016, 103, 109–123. [Google Scholar] [CrossRef] [PubMed]
  36. Gazbar, S.; Abadie, J.; Colin, F. Combined action of electro-osmotic drainage and mechanical compression on sludge de-watering. Water Sci. Technol. 1994, 30, 169–175. [Google Scholar] [CrossRef]
  37. Mahmoud, A.; Olivier, J.; Vaxelaire, J.F.; Hoadley, A. Electrical field: A historical review of its application and contributions in wastewater sludge dewatering. Water Res. 2010, 44, 2381–2407. [Google Scholar] [CrossRef] [PubMed]
  38. Zhang, Y.; Chu, G.; Dong, P.; Xiao, J.; Meng, Q.; Baumgartel, M.; Xu, B.; Hao, T. Enhanced electrokinetic remediation of lead- and cadmium-contaminated paddy soil by composite electrolyte of sodium chloride and citric acid. J. Soils Sediments 2018, 18, 1915–1924. [Google Scholar] [CrossRef]
Figure 1. (a) Physical picture of electrokinetic dewatering and heavy metal remediation. (b) Three views of the upper part (left) and lower part (right) of the electro-dewatering tank.
Water 16 00545 g001
Figure 2. (a) Change in water mass with time during the dewatering of the different electrode materials; (b) Variation of sediment temperature with time during the electro-dewatering of the different electrode materials; (c) Current over time for the different electrode materials; (d) Energy consumption per unit mass of water removed for electro-dewatering of the different electrode materials.
Water 16 00545 g002
Figure 3. Curves and fitting curves of energy consumption and dewatering water mass of different electrode materials.
Water 16 00545 g003
Figure 4. Corrosion of the different electrode materials: (a) Ti electrode, (b) RuO2/Ir2O3-Ti electrode, (c) Ir2O3/Ta2O5-Ti electrode, (d) Graphite electrode, (e) EKG electrode.
Water 16 00545 g004
Figure 5. Curves of water quality, current, and temperature over time under different voltages; (a) Change of water mass, current and temperature with time during dewatering at 20 V, (b) Change of water mass, current and temperature with time during dewatering at 30 V, (c) Change of water mass, current and temperature with time during dewatering at 40 V, (d) Change of water mass, current and temperature with time during dewatering at 50 V.
Water 16 00545 g005
Figure 6. (a) Change in water content with time during dewatering at different voltages; (b) Change in sediment temperature with time during dewatering at different voltages; (c) Change in current with time during dewatering at different voltages.
Water 16 00545 g006
Figure 7. Fitting curve of filtrate flow rate and loop current during dewatering at different voltages; (a) Fitting curve of filtrate flow rate and loop current during dewatering at 20 V, (b) Fitting curve of filtrate flow rate and loop current during dewatering at 30 V, (c) Fitting curve of filtrate flow rate and loop current during dewatering at 40 V, (d) Fitting curve of filtrate flow rate and loop current during dewatering at 50 V.
Water 16 00545 g007
Figure 8. (a) Change in energy consumption over time during dewatering at different voltages; (b) Energy consumption for electro-dewatering (EDW) and thermal drying (TD) at different voltages.
Water 16 00545 g008
Figure 9. (a) Variation of sediment water content with time during dewatering with different plate spacings. (b) Variation of sediment temperature with time during dewatering with different plate spacings. (c) Variation of loop current with time during dewatering with different plate spacings. (d) Energy consumption of electro-dewatering and thermal drying under different plate spacings.
Water 16 00545 g009aWater 16 00545 g009b
Figure 10. Construction of multi-factor response model; (a) Dry soilds content changes with electric field strength at different plate spacings, (b)The final dry solids content is a function model of the mutual influence of electric field strength and plate spacing, (c) Water productivity changes with electric field strength at different plate spacings, (d) Dewatering productivity is a function model of the mutual influence of electric field strength and palte spacing, (e) Energy consumption changes with electric field strength at different plate spacings, (f) Energy consumption is a function model of the mutual influence of electric field strength and plate spacing. Red dot shows all the results.
Water 16 00545 g010aWater 16 00545 g010b
Table 1. Main characteristics of the original sludge.
ParametersValue
Water content (wt%)75.55
Organic content (wt%)31.07
pH7.27
Conductivity (ms/cm)9.07
Particle size (D50/μm)21.9
Permeability coefficient (cm/s)1.07 × 10−8
Table 2. Fitting curve of moisture content and time under different voltages.
Voltage Strength (v)ExponentialGuassian
f x = a e b x + c e d x R2 f x = a 1 e ( x b 1 ) / c 1 ) 2 + a 2 e ( x b 2 ) / c 2 ) 2 R2
20 f x = 18.41 e 0.03116 x + 58.41 e 0.0001685 x 0.9857 f x = 78.62 e ( x + 102.3 ) / 89.05 ) 2 + 60.82 e ( x 171.3 ) / 569 ) 2 0.9912
30 f x = 28.67 e 0.07742 x + 49.56 e 0.00007798 x 0.9860 f x = 25.71 e ( x + 4.607 ) / 16.89 ) 2 + 54.56 e ( x + 700.1 ) / 3061 ) 2 0.9983
40 f x = 31.7 e 0.09031 x + 46.86 e 0.000146 x 0.9815 f x = 26.79 e ( x + 2.336 ) / 13.36 ) 2 + 51.1 e ( x + 616.8 ) / 3201 ) 2 0.9966
50 f x = 27.23 e 0.1175 x + 49.55 e 0.0002632 x 0.9952 f x = 105.1 e ( x + 27.61 ) / 23.34 ) 2 + 54.09 e ( x + 531.2 ) / 1938 ) 2 0.9925
Disclaimer/Publisher’s Note: The statements, opinions and data contained in all publications are solely those of the individual author(s) and contributor(s) and not of MDPI and/or the editor(s). MDPI and/or the editor(s) disclaim responsibility for any injury to people or property resulting from any ideas, methods, instructions or products referred to in the content.

