
Autostereoscopic 3D Display System for 3D Medical Images


1
Department of Electronic and Electrical Engineering, Hongik University, Seoul 04066, Korea
2
Department of Emergency Medicine, Samsung Medical Center, Samsung Advanced Institute for Health Science and Technology, Sungkyunkwan University School of Medicine, Seoul 06351, Korea
3
Department of Software Convergence, Kyung Hee University, Yongin-si 17104, Korea
*
Author to whom correspondence should be addressed.
Appl. Sci. 2022, 12(9), 4288; https://doi.org/10.3390/app12094288
Submission received: 31 March 2022
/
Revised: 20 April 2022
/
Accepted: 22 April 2022
/
Published: 24 April 2022
(This article belongs to the Collection Virtual and Augmented Reality Systems)
Abstract
:Recent advances in autostereoscopic three-dimensional (3D) display systems have led to innovations in consumer electronics and vehicle systems (e.g., head-up displays). However, medical images with stereoscopic depth provided by 3D displays have yet to be developed sufficiently for widespread adoption in diagnostics. Indeed, many stereoscopic 3D displays necessitate special 3D glasses that are unsuitable for clinical environments. This paper proposes a novel glasses-free 3D autostereoscopic display system based on an eye tracking algorithm and explores its viability as a 3D navigator for cardiac computed tomography (CT) images. The proposed method uses a slit-barrier with a backlight unit, which is combined with an eye tracking method that exploits multiple machine learning techniques to display 3D images. To obtain high-quality 3D images with minimal crosstalk, the light field 3D directional subpixel rendering method combined with the eye tracking module is applied using a user’s 3D eye positions. Three-dimensional coronary CT angiography images were volume rendered to investigate the performance of the autostereoscopic 3D display systems. The proposed system was trialed by expert readers, who identified key artery structures faster than with a conventional two-dimensional display without reporting any discomfort or 3D fatigue. With the proposed autostereoscopic 3D display systems, the 3D medical image navigator system has the potential to facilitate faster diagnoses with improved accuracy.
1. Introduction
Medical imaging is an invaluable tool for the diagnosis and treatment of various abnormalities. Three-dimensional (3D) volumetric medical images composed of multiple two-dimensional (2D) images are being increasingly utilized for identifying complex organ structures and diagnosing abnormalities. Recent developments of 3D imaging techniques, such as computed tomography (CT), ultrasonography (US), positron emission tomography (PET), single photon emission computed tomography (SPECT), and magnetic resonance imaging (MRI) have heightened the demand for 3D medical imaging displaying systems. Furthermore, the rapid evolution of 3D graphics techniques has increased the availability of high-quality 3D medical volume rendering and offers a better look at detailed anatomic and pathologic information, which can be missed by 2D techniques such as multiplanar reformations (MPR) [1,2,3,4]. However, at present, medical images with complex 3D structures are displayed on two-dimensional (2D) screens, with 3D contents projected onto the 2D plane.
Three-dimensional displays provide realistic visual experiences with an enhanced sense of image depth [5,6,7]. Presently, 3D displays are readily and widely available in many industries to show visual contents, such as 3D movies at cinema facilities and 3D head-up displays (HUDs) at assistive driving systems to create a more engaging viewing experience. In particular, augmented reality (AR) 3D HUDs via stereoscopic displays are an emerging technology for next-generation vehicles, which can overlay 3D virtual information directly on top of the physical road ahead via combiners placed on the windshield, to reduce the visual disparities between virtual contents and real-world objects [8,9]. Exsoscope in surgery also offers stereoscopic 3D visualization for shared viewing using special 3D glasses and a 3D monitor. Exoscope has been introduced as an alternative to conventional operating microscopes by providing shared high resolution 3D displays, which shows magnified and illuminated surgical fields. The benefits of 3D exoscope usage in the operating room in surgery compared to conventional microscopes has increased interests rapidly in recent years [10,11]. However, many stereoscopic displays require the viewer to wear special 3D glasses that are unsuitable for clinical environments.
The past decade has witnessed several advances in the development of 3D autostereoscopic 3D displays. Glasses-free 3D autostereoscopic displays have provided immersive visual experiences with quality depth of various image applications, which almost matches the 3D quality exhibited by 3D displays requiring 3D glasses (≤10% 3D crosstalk) [12,13,14,15,16]. Multiview autostereoscopic 3D displays can offer natural 3D images using directional pixels with optical layers such as parallax barriers or lenticular lenses [12,13,14,15,16]. However, Multiview 3D displays have some limitations such as a decrease in image resolution owing to the number of 3D viewpoints and limited 3D viewing zones. The autostereoscopic 3D display technique based on eye tracking, which overcomes these limitations by focusing pixel resources on a single user, provides higher 3D image resolution contents and seamless 3D experiences without restricted positions to avoid 3D crosstalk artifacts [17,18,19]. The eye tracking-based autostereoscopic 3D displays can be obtained by the same form factors as flat panel displays and provide motion parallax by tracking the user’s eye positions. From the user’s eye position by real-time pupil localization and tracking algorithms, the directional subpixel rendering method [17,18,19] not only optimizes pixel resources to reduce crosstalk but also enables real-time rendering based on eye position.
Various consumer applications utilize eye tracking-based 3D autostereoscopic display techniques, such as game consoles [20], smartphones [21], tablets [17], HUDs [22], and personal computer monitors [17] including medical image diagnosis displays [23]. In previous studies, we published several attractive applications of eye tracking-based autostereoscopic 3D displays such as personal computer monitors, tablets, and HUDs [17,24,25,26,27,28,29,30]. In contrast, processes for diagnosing medical images that utilize the 3D depth perception provided by stereoscopic 3D displays remain a rarity and require further research and development. To date, only a few studies have attempted to create 3D medical display systems [31,32].
In this paper, we interviewed physicians across various medical departments of the Samsung Medical Center (SMC) to ascertain their requirements for autostereoscopic 3D display technology. By analyzing the collected opinion samples, we developed an autostereoscopic medical 3D display system based on eye tracking. We have previously described a preliminary study of glasses-free autostereoscopic 3D display systems in the medical research community and discuss its feasibility as a 3D display for clinical applications [31], validated on a few cases. In this work, we describe an improved autostereoscopic 3D display method based on eye tracking for medical images, which were validated on more various medical images. The proposed system seeks to deliver improved diagnostic accuracy and enable faster diagnoses for physicians handling cardiac CT data (Figure 1) as well as other medical image modalities and applications.
2. Methods
Our new glasses-free display system utilizes eye tracking and a slit-barrier system with a backlight unit (BLU). The performance of the proposed glasses-free cardiac CT 3D navigator system was evaluated using 3D cardiac CT data.
2.1. Autostereoscopic 3D Display System
The proposed 3D display consists of a 2D display panel, an optical unit for processing 3D images, and a RGB stereo camera. Additionally, the liquid crystal display (LCD) panel is displayed in 4K resolution. The optical unit controls the light direction passing through the panel, and the display system is built on the slit-barrier technology. Through the slits in the barrier, there can only be pixels from the left image passing to the left eye position and pixels from the right image passing to the right eye position. Figure 2 shows where the slit barrier is located: in front of the BLU and behind the LCD panel.
The camera performs eye tracking, with eye movements processed by an eye tracking algorithm based on multiple machine learning techniques. With this eye tracking algorithm, the viewer is not limited to an optimal viewing position for 3D images and can view the images from any position within the range of the tracking capabilities. In the display panel, the subpixel values for left and right views are adjusted according to the 3D coordinates for the viewer’s pupil.
2.2. Light Field 3D Subpixel Rendering
A 3D light-ray image is created by applying a 3D rendering algorithm, which utilizes information on the global parameters of the 3D display and eye positions. Many prior works have been investigated to achieve 3D rendering [33,34,35]. Most of these methods assumed a fixed viewpoint, which is not suitable to support changing eye positions in real time. Therefore, our method employs a direct rendering method based on lumigraph [28]. The basic idea of this method is as follows.
- All light rays passing through the slit (lens) are represented as lines in ray space.
- All light rays passing through the eye pupil are also represented as lines in ray space.
- The light ray we see is the intersection of these two straight lines.
We can reconstruct light fields sampled by 3D display on ray space using global parameters of the device. A set of lines on the ray spaces which pass the slits (lens) and each line can be represented as:
where means the world coordinate of n-th slit (lens), and is the distance of s–t and u–v planes (Figure 3). Likewise, A set consists of lines on the ray space that shows the rays passing through the eyes and is defined as:
where, means the world coordinate of the eyes. In this study, we assigned values of 1 and 2 for the left and right eyes, respectively. We also define as the intersected point of line and on ray space (Figure 4), where and are an index of lines passing through slits and eyes, respectively. The 3D light-ray image is rendering a 2D image, of which pixels are from the same location of either the left or right image. This problem can be simplified as whether to select each pixel value of the rendering image from the left or the right image. We can determine which eye is closest to the pixel that passed the slit by finding the nearest intersected points as:
where means the value of the pixel at on the left, right, and 3D rendering image. The advantage of our method is that each pixel value is independently calculated through a simple operation, which can be processed in parallel, thereby ensuring real-time rendering.
2.3. Eye Tracking
The 3D image quality and 3D crosstalk of the proposed 3D medical display system depend on the precision and speed of the eye tracker [17]. With faster and more accurate eye center position tracking, 3D images with higher 3D resolution and lower 3D crosstalk can be displayed in real-time in our autostereoscopic 3D display system. The development of accurate and fast eye tracking systems using RGB cameras remains a challenge due to various light conditions including low light in medical investigation rooms, eye occlusion, eyeglasses reflection, fast head movements, head poses, and limited system computing resources.
Our real-time machine learning-based eye tracking systems aims to provide fast, accurate, robust, and small model sized methods for medical display commercial use. Our proposed eye tracking system classifies human faces into faces with clear eyes and eye-occluded faces such as thick eyeglasses with reflection, wearing hats, sunglasses, and hair occlusion. Depending on user eye shape clearness conditions, corresponding eye landmark point detection methods are applied based on image classification. The eye tracking system switches model designs between two tracking modes. Each eye tracking mode has different machine learning models, and the basic components can be divided into three main stages: (1) eye-nose region detection from RGB webcam images, (2) eye center position tracking from the detected eye-nose region with eye position refinement, and (3) tracker-checker for fast tracking (Figure 5). Our eye-nose region detection was developed by the error-based learning (EBL) method [25], where the cascaded Adaboost classifier [36] with local binary features (LBP) [37] is simple and practical with the use of a conventional CPU in a PC or mobile tablets with limited GPU resources. The EBL method trains only a small part of training face image DBs with a large size. The EBL offers higher accuracy in much shorter training times through multiple stages to find the most difficult training image DB subsets.
If eye-nose region detection is successful, the eye center position tracking mode runs depending on the user eye image condition classification, until tracking mode fails with the tracker-checker module. For clear eye faces, a coarse-to-fine strategy was developed to infer pupil center location using the Supervised Descent Method (SDM) [38] with Scale-Invariant Feature Transform (SIFT) [39] with pupil position refinement by pupil segmentation module [26]. Specifically, 11 landmark points encompassing the eyes, nose, and mouth are used to perform the SDM-based shape alignments [22,23]. The pupil segmentation method was developed as an iris regression module, where pupil boundaries are regressed to refine pupil center positions [25,26].
For eye occluded faces due to wearing thick eyeglasses, sunglasses, and hair occlusion, we adopted a Convolutional Neural Network (CNN)-based facial keypoint alignment method, the Practical Facial Landmark Detector (PFLD) network [40], which uses MobileNet v2 [41] to improve the alignment speed when using only CPU resources. We revised the PFLD network by adding a re-weight network module to handle eye occlusion problems [26,27]. To infer the eye pupil position, we utilized 98 whole face feature points, which can handle the eye occlusion cases. While the original PFLD method has the same importance in whole face points, our revised PFLD method with the re-weight sub-network module revises the importance of different feature map positions and then the occluded part can be inferred by non-occluded parts. The proposed re-weight method infers the pixel confidence on the feature map using both the landmark appearance and the graphical structure between landmarks, and the network can be trained end-to-end. The proposed revised PFLD network is shown in Figure 6.
3. Results and Discussion
The proposed 3D cardiac CT navigator software and the autostereoscopic 3D display system were used to analyze a coronary CTA image dataset. The complete specifications of the proposed system and prototype are summarized in Table 1 and Figure 9.
3.1. Experimental Results on Light Field 3D Subpixel Rendering
We performed a visual quality evaluation using light field 3D subpixel rendering with eye positions. To validate the visual quality of a human, we set up a stereo camera for quantitative validation and attached a printed image of a human face to make the camera lens look like the iris of the eyes. We then moved the stereo camera to different positions within a distance range of 300 to 600 mm.
In this experiment, we use extrinsic crosstalk as the metric of visual quality. We encoded each view using colors, e.g., red to the left and blue to the right image. If rendered ideally, only red pixels are visible on the left eye and blue pixels are visible on the right eye. In contrast, the users see an image of each color being mixed; the image with this effect is referred to as extrinsic crosstalk, defined as:
We captured 100 images at four positions of different distances with the 3D rendered image displayed in two ways, one that takes eye position into account and one that does not. Figure 10 shows the left and right captured image at different camera positions. When using the proposed rendering method, the left and right views are obviously separated. The visual quality evaluation results are summarized in Table 2. The average external crosstalk value of the proposed rendering method was 8.32%, which is within an acceptable range for a two-view autostereoscopic display [42].
3.2. Experimental Results on Eye Tracking
The proposed eye tracker show that our method achieves high accuracy and speed, approximately 1.5 mm and 6.5 mm error for clean and occluded faces, respectively, at more than 100 fps speed on an Intel Core i7-10700, 2.90 GHz CPU (Figure 11). The mean precision error was calculated as the pixel distance between the ground truth pupil centers by manual annotations and the pupil centers tracked by the algorithm. The physical pixel distances were obtained from pixel distances with an assumption of 65 mm inter-pupil distance (IPD). A RGB stereo camera with an image resolution of 640 × 480 pixels with a capturing frame speed of 60 fps was utilized for the real-time proposed eye tracking algorithm. We evaluated on our own captured image datasets, where annotations were labeled by ourselves. The evaluation datasets were recorded with the stereo RGB camera located in front of the users at a distance of 1 m on average inside a normal lighting conditioned office environment (300–400 lux). The test image datasets consist of 20,000 clean faces and 5000 eye-occluded faces by thick eyeglasses with reflection, wearing hats, sunglasses, and hair. The eye tracking algorithm evaluation results are summarized in Table 3. The evaluation results demonstrated that our eye tracking method is capable of handling clean faces as well as eye-occluded faces in real time (<10 ms) with only CPU consumption. Eye tracking modes for occluded faces had reduced precision (5 mm more error from 1.5 mm) and slower speed (6 ms down from 4 ms) compared to one for clean faces due to adoption of the CNN based facial keypoint alignment method, PFLD [40]. However, our modified re-weight network method outperformed (precision 6.5 mm) the original PFLD algorithm (precision 8 mm). Furthermore, our method achieved a higher speed (<10 ms) and comparable accuracy to state-of-the-art neural network methods such as CFSS [43] (40 ms), DVLN (15 ms) [44], and LAB (2.6 s) [45].
3.3. Experimental Results on Autostereoscopy Visualization Systems for 3D Cardiac CT
For running the cardiac software, we used a Windows 10 personal computer equipped with a 2.90 GHz Intel Core i7-10700 CPU and a NVIDIA GeForce RTX 2060 GPU. Three-dimensional light-field rendering of the cardiac CT 3D volume was performed using the light field 3D subpixel rendering method. All processes ran in real time without suffering delays. The proposed autostereoscopic 3D display system’s crosstalk averaged 8.32%, comparable to those of 3D displays requiring the viewer to wear glasses. By adjusting the disparity between the stereo images, a depth of 20 cm was achieved using the dynamic light-field rendering method (Figure 12). If the left and right images are not separated, they exhibit 3D crosstalk, which results in users seeing double images (Figure 13).
We have received no complaints regarding any discomfort or 3D fatigue from the expert reader after evaluating our 3D autostereoscopy. Using our 3D autostereoscopy system, the reader comfortably identified the 3D heart structure, including the four chambers, aorta, and main coronary arteries (LAD, LCX, and RCA). Assisted by the proposed 3D autostereoscopic display, the reader could discern more geometric information, such as overlapping coronary structures, relative to conventional 2D displays. This is because the proposed 3D display contains two different image views from different angles, allowing the user to see two distinct sets of information simultaneously (Figure 13). Figure 14 shows an enlarged region of interest (red box, 1st row), which clearly shows the morphology of different coronary arteries: the arteries are separated in the left image, while the right image shows overlapping information.
Although the performance evaluation by the expert reader was limited to a single clinical example, they reported that the 3D structure identification process was faster and easier using the proposed system. Nevertheless, it is clear that our 3D autostereoscopic display system must undergo further investigation and quantitative evaluation before being widely adopted in clinical settings. Significantly, our 3D display can function with any other medical image modality that is compatible with images captured as multiple 3D slices. Examples of such modalities are shown in Figure 15. In addition, surgical training and planning can be improved with our eye tracking based autostereoscopic 3D display method, by providing accurate depth perception without special 3D glasses. From a clinical standpoint, it is essential for virtual reality and 3D display systems to have adequate mobility, vision, usability, immersion, and accurate depth of field [46,47]. Our proposed method fulfills the mobility, vision, and usability in the surgical field by providing a wide viewing range through the proposed eye tracking algorithm. Our method also reconstructs low 3D crosstalk images without special 3D glasses, which provides a comforTable 3D experience for long periods of time of training and planning use. Furthermore, our light field 3D subpixel rendering techniques without 3D glasses provide an immersive 3D experience with accurate depth perception.
4. Conclusions
In conclusion, we proposed a novel 3D heart CT navigator system based on a 3D autostereoscopy method based on an eye tracking algorithm which does not require wearing special 3D glasses. The proposed system enables enhanced medical image diagnosis via 3D autostereoscopy and facilitates rapid and accurate visualization of complex 3D anatomical structures. Our proposed light field 3D subpixel rendering method combined with the machine learning based eye tracking algorithm provided higher 3D resolution with lower 3D crosstalk (≤10% 3D crosstalk) compared to previous glasses-free medical 3D display approaches. Importantly, the proposed 3D autostereoscopic system is extremely versatile and can be applied to any 3D volumetric medical images for not only clinical practice usage but also medical education and a shared decision between medical doctors and patients.
Author Contributions
Conceptualization, D.K.; methodology, D.K., J.-H.C. and H.H.; software, D.K. and H.H.; validation, D.K. and J.-H.C. and H.H.; formal analysis, D.K. and H.H.; investigation, D.K. and H.H.; resources, D.K. and J.-H.C.; data curation, D.K. and J.-H.C.; writing—original draft preparation, D.K.; writing—review and editing, D.K., J.-H.C. and H.H.; visualization, D.K. and H.H.; supervision, D.K. and H.H.; project administration, D.K. and H.H.; funding acquisition, D.K. All authors have read and agreed to the published version of the manuscript.
Funding
This work was supported by 2022 Hongik University Research Fund; The National Research Foundation of Korea (NRF) grant funded by the Korea government (MSIT) (No. 2021K2A9A1A01102122).
Institutional Review Board Statement
Not applicable.
Informed Consent Statement
Informed consent was obtained from all subjects involved in the study.
Data Availability Statement
Not applicable.
Conflicts of Interest
The authors declare no conflict of interest.
References
- Chan, S.; Conti, F.; Salisbury, K.; Blevins, N.H. Virtual reality simulation in neurosurgery: Technologies and evolution. Neurosurgery 2013, 72, 154–164. [Google Scholar] [CrossRef] [PubMed]
- Ferroli, P.; Tringali, G.; Acerbi, F.; Schiariti, M.; Broggi, M.; Aquino, D.; Broggi, G. Advanced 3-dimensional planning in neurosurgery. Neurosurgery 2013, 72, 54–62. [Google Scholar] [CrossRef] [PubMed]
- Langdon, W.B.; Modat, M.; Petke, J.; Harman, M. Improving 3D medical image registration CUDA software with genetic programming. In Proceedings of the 2014 Annual Conference on Genetic and Evolutionary Computation, New York, NY, USA, 12 July 2014; pp. 951–958. [Google Scholar]
- Höhne, K.H. 3D Imaging in Medicine: Algorithms, Systems, Applications; Springer Science & Business Media: Berlin/Heidelberg, Germany, 2012; Volume 60. [Google Scholar]
- Urey, H.; Chellappan, K.V.; Erden, E.; Surman, P. State of the art in stereoscopic and autostereoscopic displays. Proc. IEEE 2011, 99, 540–555. [Google Scholar] [CrossRef]
- Holliman, N.S.; Dodgson, N.A.; Favalora, G.E.; Pockett, L. Three-dimensional displays: A review and applications analysis. IEEE Trans. Broadcasting 2011, 57, 362–371. [Google Scholar] [CrossRef]
- Yang, L.; Dong, H.; Alelaiwi, A.; Saddik, A.E. See in 3D: State of the art of 3D display technologies. Multimed. Tools Appl. 2016, 75, 17121–17155. [Google Scholar] [CrossRef]
- Cho, D.Y.H.; Nam, D.K. Content Visualizing Device and Method. U.S. Patent 10 573 063 B2, 25 February 2019. [Google Scholar]
- Martinez, L.A.V.G.; Orozoco, L.F.E. Head-Up Display System Using Auto-Stereoscopy 3D Transparent Electronic Display. U.S. Patent 2016 073 098, 10 March 2016. [Google Scholar]
- Montemurro, N.; Scerrati, A.; Ricciardi, L.; Trevisi, G. The Exoscope in Neurosurgery: An Overview of the Current Literature of Intraoperative Use in Brain and Spine Surgery. J. Clin. Med. 2022, 11, 223. [Google Scholar] [CrossRef] [PubMed]
- Amoo, M.; Henry, J.; Javadpour, M. Beyond magnification and illumination: Preliminary clinical experience with the 4K 3D ORBEYE™ exoscope and a literature review. Acta Neurochir. 2021, 163, 2107–2115. [Google Scholar] [CrossRef]
- Dodgson, N.A. Autostereoscopic 3D displays. Computer 2005, 38, 31–36. [Google Scholar] [CrossRef]
- Wang, J.; Zhao, X.; Li, D.; Wen, Y.; Wang, W.; Wang, B.; Xu, X.; Bai, H.; Liu, W. Autostereoscopic-Raman Spectrometry-Based Three-Dimensional Metrology System for Measurements, Tracking and Identification in a Volume. Appl. Sci. 2022, 12, 3111. [Google Scholar] [CrossRef]
- Barré, R.D.l.; Bartmann, R.; Jurk, S.; Kuhlmey, M.; Duckstein, B.; Seeboth, A.; Lötzsch, D.; Rabe, C.; Frach, P.; Bartzsch, H.; et al. Time-sequential working wavelength-selective filter for flat autostereoscopic displays. Appl. Sci. 2017, 7, 194. [Google Scholar] [CrossRef] [Green Version]
- Dodgson, N.A. Analysis of the viewing zone of multiview autostereoscopic displays. In Stereoscopic Displays and Virtual Reality Systems IX; SPIE: Bellingham, WA, USA, 2002; Volume 4660, pp. 254–265. [Google Scholar]
- Chen, F.; Qiu, C.; Liu, Z. Investigation of Autostereoscopic Displays Based on Various Display Technologies. Nanomaterials 2022, 12, 429. [Google Scholar] [CrossRef] [PubMed]
- Lee, S.; Park, J.; Heo, J.; Kang, B.; Kang, D.; Hwang, H.; Lee, J.; Choi, Y.; Choi, K.; Nam, D. Autostereoscopic 3D display using directional subpixel rendering. Opt. Express 2018, 26, 20233. [Google Scholar] [CrossRef] [PubMed]
- Lee, S.; Park, J.; Heo, J.; Kang, B.; Kang, D.; Hwang, H.; Lee, J.; Choi, Y.; Choi, K.; Nam, D. Eye tracking based glasses-free 3D display by dynamic light field rendering. In Digital Holography and Three-Dimensional Imaging; Optical Society of America: Heidleberg, Germany, 2016; p. DM3E-6. [Google Scholar]
- Park, J.; Nam, D.; Sung, G.; Kim, Y.; Park, D.; Kim, C. 61.4: Active Crosstalk Reduction on Multi-View Displays Using Eye Detection. In SID Symposium Digest of Technical Papers; Blackwell Publishing Ltd.: Oxford, UK, 2011; Volume 42, pp. 920–923. [Google Scholar]
- Sakurai, M.; Kodaira, S.; Machino, T. Computer-Readable Storage Medium Having Stored Therein Stereoscopic Display Control Program, Stereoscopic Display Control System, Stereoscopic Display Control Apparatus, and Stereoscopic Display Control Method. U.S. Patent US9050532B2, 9 June 2015. [Google Scholar]
- Suzuki, D.; Hayashi, S.; Hyodo, Y.; Oka, S.; Koito, T.; Sugiyama, H. A wide view auto-stereoscopic 3D display with an eye-tracking system for enhanced horizontal viewing position and viewing distance. J. Soc. Inf. Disp. 2016, 24, 657–668. [Google Scholar] [CrossRef]
- Matsumoto, T.; Kusafuka, K.; Hamagishi, G.; Takahashi, H. P-87: Glassless 3D Head up Display using Parallax Barrier with Eye Tracking Image Processing. In SID Symposium Digest of Technical Papers; The Society for Information Display: Los Angeles, CA, USA, 2018; Volume 49, pp. 1511–1514. [Google Scholar]
- Hwang, H.; Kang, D. User-friendly inter-pupillary distance calibration method using a single camera for autostereoscopic 3D displays. In Proceedings of the 2018 IEEE International Conference on Consumer Electronics (ICCE), Las Vegas, NV, USA, 12–14 January 2018; pp. 1–3. [Google Scholar] [CrossRef]
- Lee, S.; Kang, D.; Kang, B.M.; Nam, D.K.; Park, J.; Heo, J. Method and Apparatus for Generating Three-Dimensional Image. U.S. Patent 10,419,736, 17 September 2019. [Google Scholar]
- Kang, D.; Heo, J. Content-Aware Eye Tracking for Autostereoscopic 3D Display. Sensors 2020, 20, 4787. [Google Scholar] [CrossRef] [PubMed]
- Kang, D.; Ma, L. Real-Time Eye Tracking for Bare and Sunglasses-Wearing Faces for Augmented Reality 3D Head-Up Displays. IEEE Access 2021, 9, 125508–125522. [Google Scholar] [CrossRef]
- Kang, D.; Chang, H.S. Low-Complexity Pupil Tracking for Sunglasses-Wearing Faces for Glasses-Free 3D HUDs. Appl. Sci. 2021, 11, 4366. [Google Scholar] [CrossRef]
- Hwang, H.; Chang, H.S.; Kweon, I.S. Local Deformation Calibration for Autostereoscopic 3D Display. Opt. Express 2017, 25, 10801–10814. [Google Scholar] [CrossRef] [PubMed]
- Hwang, H. Automated Calibration Method for Eye-Tracked Autostereoscopic Display. Sensors 2018, 18, 2614. [Google Scholar] [CrossRef] [Green Version]
- Hwang, H.; Chang, H.S.; Nam, D.; Kweon, I.S. 3D Display Calibration by Visual Pattern Analysis. IEEE Trans. Image Process. 2017, 26, 2090–2102. [Google Scholar] [CrossRef] [Green Version]
- Kang, D.; Lee, S.; Hwang, H.; Park, J.; Heo, J.; Kang, B.; Lee, J.-H.; Choi, Y.; Choi, K.; Nam, D. Feasibility of Eye-tracking based Glasses-free 3D Autostereoscopic Display Systems for Medical 3D Images. In Proceedings of the 9th International Joint Conference on Biomedical Engineering Systems and Technologies (BIOSTEC 2016)—Volume 2: BIOIMAGING, Rome, Italy, 21–23 February 2016; pp. 134–138. [Google Scholar]
- Narita, Y.; Tsukagoshi, S.; Suzuki, M.; Miyakita, Y.; Ohno, M.; Arita, H.; Saito, Y.; Kokojima, Y.; Watanabe, N.; Moriyama, N.; et al. Usefulness of a glass-free medical three-dimensional autostereoscopic display in neurosurgery. Int. J. Comput. Assist. Radiol. Surg. 2014, 9, 905–911. [Google Scholar] [CrossRef]
- Jeong, Y.J.; Chang, H.S.; Hwang, H.; Nam, D.; Kuo, C.J. Uncalibrated multiview synthesis. Opt. Eng. 2017, 56, 043103. [Google Scholar] [CrossRef]
- Jiao, S.; Wang, X.; Zhou, M.; Li, W.; Hong, T.; Nam, D.; Lee, J.-H.; Wu, E.; Wang, H.; Kim, J.-Y. Multiple ray cluster rendering for interactive integral imaging system. Opt. Express 2013, 21, 10070–10086. [Google Scholar] [CrossRef] [PubMed]
- Fehn, C. Depth-image-based rendering (DIBR), compression, and transmission for a new approach on 3D-TV. In Stereoscopic Displays and Virtual Reality Systems XI; International Society for Optics and Photonics: Bellingham, WA, USA, 2004; Volume 5291, pp. 93–104. [Google Scholar]
- Viola, P.; Michael, J. Rapid object detection using a boosted cascade of simple features. In Proceedings of the 2001 IEEE Computer Society Conference on Computer Vision and Pattern Recognition, CVPR, Kauai, HI, USA, 8–14 December 2001. [Google Scholar]
- Zhang, L.; Chu, R.; Xiang, S.; Liao, S.; Li, S.Z. Face detection based on multi-block LBP representation. In Proceedings of the International Conference on Biometrics, Seoul, Korea, 27–29 August 2007; pp. 11–18. [Google Scholar]
- Xiong, X.; De la Torre, F. Supervised Descent Method and its Applications to Face Alignment. In Proceedings of the IEEE Conference on Computer Vision and Pattern Recognition, Portland, OR, USA, 23–28 June 2013; pp. 532–539. [Google Scholar]
- Lowe, D.G. Distinctive image features from scale-invariant keypoints. Int. J. Comput. Vis. 2004, 60, 91–110. [Google Scholar] [CrossRef]
- Guo, X.; Li, S.; Yu, J.; Zhang, J.; Ma, J.; Ma, L.; Liu, W.; Ling, H. PFLD: A practical facial landmark detector. arXiv 2019, arXiv:1902.10859. [Google Scholar]
- Sandler, M.; Howard, A.; Zhu, M.; Zhmoginov, A.; Chen, L.C. Mobilenetv2: Inverted residuals and linear bottlenecks. In Proceedings of the IEEE Conference on Computer Vision and Pattern Recognition, Salt Lake City, UT, USA, 18–23 June 2018; pp. 4510–4520. [Google Scholar]
- Huang, K.C.; Chou, Y.H.; Lin, L.C.; Lin, H.Y.; Chen, F.H.; Liao, C.C.; Chen, Y.H.; Lee, K.; Hsu, W.H. Investigation of designated eye position and viewing zone for a two-view autostereoscopic display. Opt. Express 2014, 22, 4751–4767. [Google Scholar] [CrossRef]
- Zhu, S.; Li, C.; Change Loy, C.; Tang, X. Face alignment by coarse-to-fine shape searching. In Proceedings of the IEEE Conference on Computer Vision and Pattern Recognition, Boston, MA, USA, 7–12 June 2015; pp. 4998–5006. [Google Scholar]
- Wu, W.; Yang, S. Leveraging intra and inter-dataset variations for robust face alignment. In Proceedings of the IEEE Conference on Computer Vision and Pattern Recognition Workshops, Honolulu, HI, USA, 21–26 July 2017; pp. 150–159. [Google Scholar]
- Wu, W.; Qian, C.; Yang, S.; Wang, Q.; Cai, Y.; Zhou, Q. Look at boundary: A boundary-aware face alignment algorithm. In Proceedings of the IEEE Conference on Computer Vision and Pattern Recognition, Salt Lake City, UT, USA, 18–23 June 2018; pp. 2129–2138. [Google Scholar]
- Mishra, R.; Narayanan, M.D.K.; Umana, G.E.; Montemurro, N.; Chaurasia, B.; Deora, H. Virtual Reality in Neurosurgery: Beyond Neurosurgical Planning. Int. J. Environ. Res. Public Health 2022, 19, 1719. [Google Scholar] [CrossRef]
- Pelargos, P.E.; Nagasawa, D.T.; Lagman, C.; Tenn, S.; Demos, J.V.; Lee, S.J.; Bui, T.T.; Barnette, N.E.; Bhatt, N.S.; Ung, N.; et al. Utilizing virtual and augmented reality for educational and clinical enhancements in neurosurgery. J. Clin. Neurosci. 2017, 35, 1–4. [Google Scholar] [CrossRef]
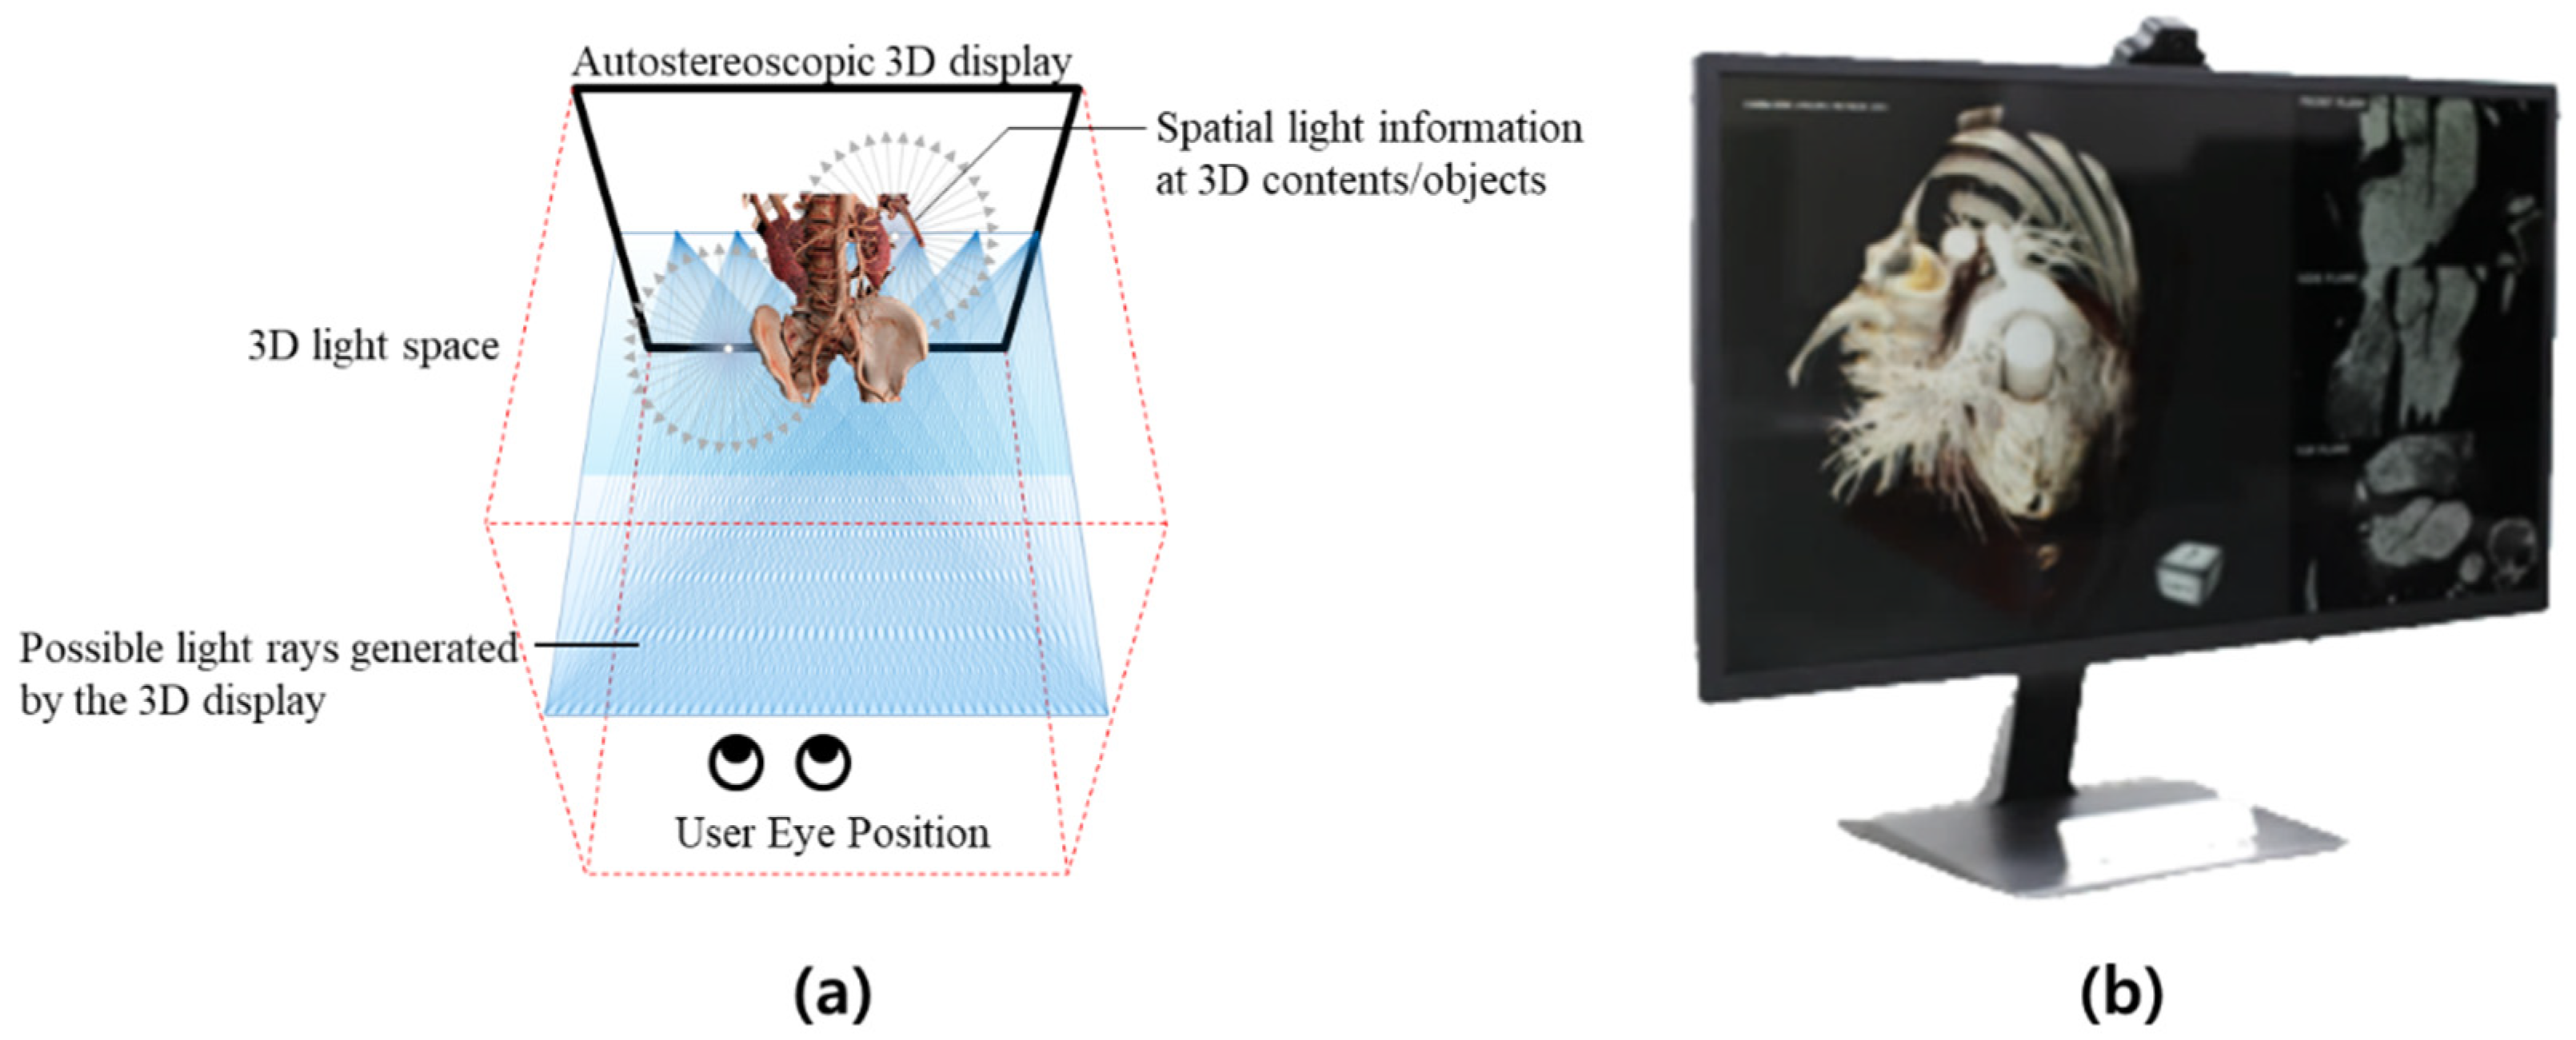
Figure 1.
(a) Eye tracking-based light-field 3D display concept, showing the generation and modeling of directional light rays. (b) 3D display prototype for medical applications: 3D cardiac CT navigator.
Figure 1.
(a) Eye tracking-based light-field 3D display concept, showing the generation and modeling of directional light rays. (b) 3D display prototype for medical applications: 3D cardiac CT navigator.

Figure 2.
Autostereoscopic 3D display concept: (1) Directional light is generated by liquid crystal display (LCD) panels; (2) the 3D light field is modeled; and (3) 3D light rendering is performed according to user eye position, as determined by eye tracking algorithms.
Figure 2.
Autostereoscopic 3D display concept: (1) Directional light is generated by liquid crystal display (LCD) panels; (2) the 3D light field is modeled; and (3) 3D light rendering is performed according to user eye position, as determined by eye tracking algorithms.

Figure 3.
Parameterization of a light ray in the 3D display environment.

Figure 4.
A horizontal 2D slice of light field in the 3D display. (a) Real-world setting, (b) equivalent representation in the ray space. Greyscale lines represent light rays passing through slits (lens), red and blue lines represent light rays passing through the left and right eye respectively. Square boxes are intersected points.

Figure 5.
Illustration of the proposed eye tracking method, which includes pupil segmentation modules. The left image shows an extracted subregion (red box) including the eyes and nose of the subject. The middle image shows the 11 landmark points (green dots) used to inform the Supervised Descent Method (SDM)-based shape alignments. In the right image, the green circles around the red points on the eyes indicate the pupil segmentation modules, which increase the accuracy of the eye tracking.

Figure 6.
Eye center positions are refined with our proposed re-weight algorithm for eye occluded faces. From the MobileNet v2 based PFLD method (the upper row), the re-weight subnet infers the pixel confidence on the feature map from both the structure between landmarks and landmark appearance as shown in the bottom row.

Figure 7.
Three-dimensional cardiac CT navigator software prototype. The images show the volume rendered original CT images without any pre-processing (1st row), a segmented whole heart (2nd row), and segmented coronary arteries (3rd row).
Figure 7.
Three-dimensional cardiac CT navigator software prototype. The images show the volume rendered original CT images without any pre-processing (1st row), a segmented whole heart (2nd row), and segmented coronary arteries (3rd row).

Figure 8.
Three-dimensional cardiac CT navigator usage examples. The 3D display serves as a 3D navigator for identifying coronary lesion candidates within complex coronary artery structures. The candidates can then be examined in detail using 2D modes with 2D cardiac CT images.
Figure 8.
Three-dimensional cardiac CT navigator usage examples. The 3D display serves as a 3D navigator for identifying coronary lesion candidates within complex coronary artery structures. The candidates can then be examined in detail using 2D modes with 2D cardiac CT images.

Figure 9.
Proposed implemented prototypes of an autostereoscopic 3D display system for 3D medical images ((left) 31.5”, (middle) 18.4”, (right) 10.1”). In the 31.5” monitory prototype (left), the light field 3D subpixel rendering is processed with a GPU and the eye tracking algorithm is processed with only CPU computations in Windows PC. In the 18.4” (middle) and the 10.1” (right) tablet display prototypes, the light field 3D subpixel rendering and eye tracking are processed in the FPGA board.

Figure 10.
Examples of the two-view image captured at different distances: (a) captured images of rendering without eye positions, (b) captured images using the proposed 3D light field rendering method with eye positions.
Figure 10.
Examples of the two-view image captured at different distances: (a) captured images of rendering without eye positions, (b) captured images using the proposed 3D light field rendering method with eye positions.

Figure 11.
Illustration of the proposed eye tracking method with pupil segmentation modules. The green circles around the red points on the eyes indicate the pupil segmentation modules, which increase the accuracy of the eye tracking. The left side shows the left camera image from a stereo webcam, while the right side shows the image captured by the right camera. The left and right images were combined to calculate the 3D eye position via stereo image matching based on triangular interpolation.

Figure 12.
Stereo images from the volume rendered 3D coronary arteries from a coronary CT angiography image dataset. Left view image (left) and right view image (right).
Figure 12.
Stereo images from the volume rendered 3D coronary arteries from a coronary CT angiography image dataset. Left view image (left) and right view image (right).

Figure 13.
Unclear left- and right-view separation resulting from failed eye tracking. The resulting 3D crosstalk manifests as overlapping double images and 3D fatigue for the user.
Figure 13.
Unclear left- and right-view separation resulting from failed eye tracking. The resulting 3D crosstalk manifests as overlapping double images and 3D fatigue for the user.

Figure 14.
Example of the augmented morphological information provided by the proposed 3D display system. The 1st row shows the left and right views from the 3D display prototype. The 2nd row shows an enlarged region of interest (red box, 1st row), and clearly highlights the improvement provided by the proposed system with respect to deciphering the morphology of coronary arteries: the left image shows separate arteries, whereas the right image shows overlapping information. The user receives both images to both eyes; therefore, they experience enhanced 3D depth perception and access more morphological information compared to 2D displays.

Figure 15.
Examples of the proposed 3D display system being applied to other modalities; namely, abdomen CT and head CT. The inset camera images show the real-time eye tracking results for the proposed autostereoscopic 3D display.
Figure 15.
Examples of the proposed 3D display system being applied to other modalities; namely, abdomen CT and head CT. The inset camera images show the real-time eye tracking results for the proposed autostereoscopic 3D display.


Table 1.
Complete specifications of the proposed autostereoscopic 3D display system prototype based on eye tracking for medical 3D image applications.
Table 1.
Complete specifications of the proposed autostereoscopic 3D display system prototype based on eye tracking for medical 3D image applications.
| Monitor | Mobile Tablet 1 | Mobile Tablet 2 | |
|---|---|---|---|
| Screen Size | 31.5” | 18.4” | 10.1” |
| 3D Optical Module | Barrier-type BLU (3D) | Dual-layer BLU (2D/3D) | Single-layer BLU (2D/3D) |
| 3D Processing | Light Field Subpixel Rendering | Light Field Subpixel Rendering | Light Field Subpixel Rendering |
| 3D Viewing Angle | H60°, V40° | H60°, V40° | H60°, V40° |
| 3D Resolution | FHD | QHD | QHD |
| Total Viewing Number | Continuous Parallax | Continuous Parallax | Continuous Parallax |
| Display Driving HW | PC, Windows | FPGA, Androids | FPGA, Androids |
Table 2.
Extrinsic crosstalk evaluation results.
| Distance (mm) | 3D Crosstalk by 3D Rendering W/O Eye Positions | 3D Crosstalk (Ours) |
|---|---|---|
| 300 | 77.59 | 7.90 |
| 400 | 85.79 | 8.07 |
| 500 | 91.10 | 8.52 |
| 600 | 88.20 | 8.79 |
| average | 85.67 | 8.32 |
Table 3.
Evaluation results of the proposed eye tracking algorithm.
| Performance on Clean Faces | Performance on Occluded Faces | |
|---|---|---|
| Illumination condition | 300~400 lux | |
| Distance to users from camera | 1 m | |
| Detection accuracy | 99.80% | 99.80% |
| Tracking precision (mm) | 1.5 mm | 6.5 mm |
| Speed (fps) | 250 fps | 100 fps |
| Testing DB number | 20,000 | 5000 |
Publisher’s Note: MDPI stays neutral with regard to jurisdictional claims in published maps and institutional affiliations. |
© 2022 by the authors. Licensee MDPI, Basel, Switzerland. This article is an open access article distributed under the terms and conditions of the Creative Commons Attribution (CC BY) license (https://creativecommons.org/licenses/by/4.0/).
Share and Cite
MDPI and ACS Style
Kang, D.; Choi, J.-H.; Hwang, H. Autostereoscopic 3D Display System for 3D Medical Images. Appl. Sci. 2022, 12, 4288. https://doi.org/10.3390/app12094288
AMA Style
Kang D, Choi J-H, Hwang H. Autostereoscopic 3D Display System for 3D Medical Images. Applied Sciences. 2022; 12(9):4288. https://doi.org/10.3390/app12094288
Chicago/Turabian StyleKang, Dongwoo, Jin-Ho Choi, and Hyoseok Hwang. 2022. "Autostereoscopic 3D Display System for 3D Medical Images" Applied Sciences 12, no. 9: 4288. https://doi.org/10.3390/app12094288
Note that from the first issue of 2016, this journal uses article numbers instead of page numbers. See further details here.