
A Design Language for Prototyping and Storyboarding Data-Driven Stories

Computer and Software Engineering Department, Polytechnique Montreal, Montreal, QC H3T 1J4, Canada
*
Author to whom correspondence should be addressed.
Appl. Sci. 2024, 14(4), 1387; https://doi.org/10.3390/app14041387
Submission received: 24 November 2023
/
Revised: 23 January 2024
/
Accepted: 4 February 2024
/
Published: 8 February 2024
(This article belongs to the Special Issue Recent Applications of Information Visualization and Graphics)
Abstract
:Data-driven stories (DDS) are digital forms of storytelling that arrange data and visualizations to communicate a narrative of information to an audience. They have been growing rapidly over the past decades. As a result, a great degree of versatility appears in the forms of published DDS. The recent structures of DDS are more complex, respecting their arrangement, composition, features, and inner parts. In the current academic research, neither storytelling techniques nor any taxonomies suggest visual mechanisms to distinguish between different layouts, compositions, and arrangements. The lack of an expressive visual solution that integrates different parts of DDS under one structure prevents the authors from trying more alternative design paths in the story design process. In this proposed work, we unify all the constructing parts of DDS to define the narrative structure as a visually structured representation of the DDS narrative, which is formed and designed by their constructing elements. This solution proposes a design language consisting of a set of design rules that integrate the visual elements to represent the DDS narrative structure. Our evaluation of the audit process out of 100 DDS examples confirms that the design language is comprehensive, expressive, and versatile. Additionally, we developed DataStoryDesign, a system that incorporates this visual solution to facilitate prototyping and storyboarding DDS for a team of DDS authors. The preliminary result of the exploratory evaluation indicates that such a solution is effective in prototyping and storyboarding DDS. In addition, our findings confirmed that the existence of our design language improves the visual communication between different personas in the DDS production workflow.
1. Introduction
Data-driven stories (DDS), also known as narrative visualizations, are digital forms of storytelling that arrange data and visualizations to communicate a narrative of information to an audience. DDS have been experiencing rapid growth over the past decade, driven by increasing demand [1,2]. DDS are evolving with new forms and increased versatility as DDS authors (the term “DDS authors” refers to all different personas involved in DDS production) explore more complex data, including large datasets, and various storytelling and visualization techniques, to enrich their narratives. These new changes create the necessity for a deeper understanding of DDS and their structure. In this paper, we propose a visual representation and definition for the DDS narrative called DDS narrative structure as a unified structured representation for the DDS narrative, formed by their constructing elements.
DDS studies traditionally explain DDS structure by constructing parts like layouts, path structures, components, and transitions. Some studies propose visual representations of these parts separately. The current DDS studies do not propose any visual mechanism to represent the whole DDS structure that unifies their constructing elements. The lack of such a representation becomes a problem for more complex forms of DDS since they offer complex layouts intertwined with visualization within the narrative. This gap has remained unexplained, although the demand for such a solution has become evident.
The visual communication in DDS production between different personas becomes affected without such a visual mechanism. Consequently, DDS authors usually fixate on one or very few design pathways [3,4]. Also, this problem causes DDS authoring tools to prevent authors from having a more detailed and customized prototyping and storyboarding experience specifically for more complex forms of DDS. Professional journalists in the news industry encounter more situations where the data and story implications require a comprehensive solution, yet current models do not hold the newsroom standards.
Motivation and Contributions
Unifying the details of the DDS narrative structure under one ultimate visual solution has been questioned by current DDS studies. Our primary motivation is to provide a better understanding of more complex forms of DDS. A visual representation of the DDS narrative structure fills the gap in DDS studies and authoring tools by providing an expressive mechanism that entails different parts of DDS. Our work follows a dual approach of prototyping and storyboarding standpoints, specifically as a practice interlaced with story design, storyboarding, and brainstorming. We have been inspired by storyboarding practice, which has a simple yet effective visual communicative language [5]. Our contributions are the following:
- Proposing a solution for visualizing DDS narrative structure, called the design language;
- Evaluating the effectiveness of the design language by showing its versatility, comprehensiveness, and expressiveness through the audit of 100 curated DDS examples from notable journals;
- Evaluating the effectiveness of the design language as a prototyping and storyboarding device in an authoring environment called DataStoryDesign through a team of DDS authors in a real media newsroom (Le Devoir, a French-language independent newspaper published in Quebec and throughout Canada, founded by journalist and politician Henri Bourassa in 1910);
- Validating the hypothesis that the proposed design language improves the visual communication between different personas in the DDS production workflow.
To achieve a representation of the DDS structure, we unified various methods of visualizing, representing, prototyping storyboarding, and structuring the DDS narrative from the previous studies. In addition, we followed a user-centered design approach by collecting knowledge from professionals in the journalism industry to understand their expectations and requirements in prototyping and storyboarding applications in the design phase of DDS.
Looking ahead, we see the design language not just to be confined to DataStoryDesign but as a key part of future authoring tools for DDS. In this paper, we implemented DataStoryDesign to express this idea, showcasing its potential as an essential component in upcoming design systems for DDS. DDS production practices can vary in different newsrooms, considering factors like size and the roles involved. Figure 1 illustrates precisely where the design language and its complementary system fit into the DDS production process. This figure demonstrates that the design language can be a part of authoring systems and the production chain to facilitate the ideation process as a prototyping and storyboarding device. Embedding such a language into these systems totally changes the structure of these tools as the authors’ communication is completely effected. In this paper, we limited the use case of the design language to the ideation phase, but this could go beyond ideation by using the design language as a part of DDS authoring systems or integrating ideation and authoring into one comprehensive system and workflow.
2. Related Studies
2.1. DDS Narrative Structure
Understanding and formulating storytelling has been a subject of long-standing historical interest [2]. Since DDS has emerged, studies have endeavored to comprehend and structure the fundamental components of DDS. As a digital journalism product, DDS combines text and data portrayed as visualization in a narrative format [1,2,6]. Recently, the longer formats of digital journalism, also called long-form journalism, are increasingly used by online media as a powerful way of storytelling [6]. Among them, a specific form of long-form journalism is called scrollytelling, a combination of storytelling and scrolling [7,8]. Figure 2 shows different examples of DDS.
The current studies encompass various facets of DDS studies, addressing elements such as scenes, layout, timeline, path structure, modality, and parallelism individually. Notably, graph-based and prototypical representations aim to offer a comprehensive structure for DDS; however, their practical utility in DDS design processes is hindered by a lack of detail in specific areas. These representations are more commonly applied within the realm of DDS research rather than practical design scenarios. In contrast, our objective is to infuse such a structure with the flexibility to adeptly capture the intricate details of DDS in diverse design contexts, including prototyping and storyboarding.
2.1.1. DDS Scene and Layout
Audiences consume a published DDS through different media screens depending on their preferences. Regardless of the complexity of DDS, every DDS scenario spreads the story through a series of scenes or shots forming its narrative structure. The number of visual elements may vary in a single scene. Kim refers to these frames as a snapshot of an individual visualization of some of the data [9]. Hullman et al. adapt the term state in DDS as an informationally distinct scene [10]. Marcelino et al. name this sequence of segments a visual storyline [11]. The elements of each scene may change through a stream of consecutive states while having their own separate storylines. Multiple levels of abstraction apply to visual storylines. On the highest level of abstraction, the authors consider the whole elements within a single scene as one unit. However, authors may further break down a visual scene into sub-elements to assign roles to these inner parts.
DDS layouts create segmentation and partitioning of each DDS scene. The concept of layout compositions draws inspiration from data comics where Bach et al. and Zhao et al. extend this concept for DDS [12,13]. Bach et al. propose a design space that offers different layout compositions, like linear, branched, network, parallel, grid, grouped, tiled, annotated, and large panel [12]. Figure 3 shows the panel layout variations proposed by Bach et al. [12]. As we move on the spectrum of nonlinear to linear, the encompassing panels gradually shift to a highly partitioned style. Zhao et al. introduce encapsulation in data comics, where a structure is divisible into smaller structures on multiple levels [13]. The micro level is also encapsulated with smaller segments through layouting or partitioning. Furthermore, the final content and graphs are also divisible into parallel or overlaying compositions, as this paper calls it, the inner-narrative structure. In conclusion, to describe the DDS structure visually, it is crucial to use the DDS scene as a building block.
2.1.2. DDS Path Structure
Several studies talk about the existence of a macro-framed and a micro-framed structure in the story [10,14,15]. The DDS macro-structure refers to the sequence of DDS scenes, while the DDS micro-structure breaks each scene further by referring to their components. Depending on the story, the audience goes through different sequences between DDS scenes to traverse the DDS structure. The narrative of events in the story primarily determines these pathways, as we call them, the path structure of DDS. These events direct the readers to a new scene or the same scene with different visual elements. Several studies have suggested different path structures for DDS with different terminologies. Table 1 shows the path structures in different studies by their terminologies and the correspondence between them. One problem regarding the current classifications is the lack of a procedure or guidelines to visually connect the macro level to the inner parts of DDS on the micro level. In other words, these studies do not distinguish what is a visual scene and how elements in the scene combine to create a different path in the story.
2.1.3. Graph-Based Representation
Graph-based representation explains DDS structures in different use cases, including path structure and transitions. Hullman et al. apply a simpler form of graph-based visualization to demonstrate transitions [10]. To explain a transition, the initial and final stages are connected with an arrow to point out the change direction. Each complex transition is divisible into a sequence of simpler sub-transitions in a process called staging [20,21]. Weber uses nodes and line connections to represent a graph visualization for the path structure of a story [18]. Godulla and Wolf use a similar demonstration using a directed graph with arrows and rectangles as a replica for visual scenes [16]. Through experiment, Norambuena et al. also showcase the usage of directed graph structure in presenting DDS scenes [22].
The scenes’ direction and connections are the most important aspects of a path structure, since they demonstrate all the paths within the story. In this regard, graph-based representation is an effective way to demonstrate all the paths of DDS on macro-level DDS. Graph-based representation is based on minimizing the details in a visual scene; therefore, the result will not adequately encompass the main visual elements of the micro-scale and inner-narrative structure of the DDS.
2.1.4. DDS Modality
DDS encompass a collection of multimedia content. Researchers in the field of long-form journalism refer to the incorporation of multimedia features as multimodality [6]. Several studies describe different DDS formats with multimedia features [6,7,16]. Some DDS articles show up to seven different types of multimedia content, especially in recent years with the breakthrough of the Internet [7]. Seyser and Zeiller highlight that in most cases, scrollytelling articles start with a full-screen photograph or video. They emphasize the role of text in image-centric scrollytelling in addition to other content, such as photos, graphics, and animations [7]. Zhao and Elmqvist name audio, music, image, video, graph, anime, and text as the media components of DDS. They also name another group of components called data components, e.g., map, textvis, etc. [23]. In conclusion, multimedia content, or multimodality, plays a central role, offering a diverse range of media components that enrich the DDS narrative structure.
2.1.5. Visual Parallelism in DDS
The concept of parallelism is adopted from linguistics and literature by Corbett and Connors as a rhetorical tool for expressing a series of similar or equivalent concepts [24]. Some studies adopt the same concept for visual analytics as a technique to show the equal importance of two concepts, linguistic statements, or visual features side-by-side [10,24,25]. In the context of DDS, parallelism is defined as the practice of merging two elements at the same time. On the macro level, parallelism appears in the path structure of DDS to show two simultaneous paths at the same time. On the micro level, parallelism appears in the layout panels as well as the element transitions. Furthermore, on a deeper level of inner-narrative, parallelism appears in the story’s narrative.
Since a variety of parallelism exists on different levels, each has unique features regarding the number of elements, the number of scenes, and the simultaneousness of the occurrences. Some studies [7,16] interpret the term parallelism differently compared to Tong et al. [17]. These studies represent parallelism on the path structure level of DDS as parallel structure [7,16]. Hullman et al. point to transition parallelism as a syntactic structure repeated in a text to relate two narrative statements in one DDS scene [10]. Another form of parallelism, called layout parallelism, exemplifies aligned partitioned content when two visual elements appear with synchronized timing. Figure 4 shows different variations of parallelism as follows: parallel narrative, parallel transition, parallel path structure, and parallel layout. In conclusion, parallelism in data-driven stories manifests itself across various levels, influencing the presentation of similar or equivalent concepts and elements. This multi-faceted concept of parallelism encompasses the path structure, layouting, transitioning, and inner-narrative of DDS.
2.1.6. Prototypical Representation
In UX (user experience) design, prototypes are primitive depictions of the final products. Similarly, prototyping in DDS aims to provide an early representation of the final story. Some studies demonstrate some notions of prototyping long-form DDS without providing any practical strategy [6,16]. Hiippala demonstrates segmenting a page based on the content modality, referring to this composite as page-flow [6]. In the same direction, Van Der Nat et al. provide more detail on interactive narratives, using experimental visual prototypes of five different DDS examples. Their visual prototypes are not based on WYSIWYG design in which the design resembles the final product. Their representation provides a detailed flow diagram of DDS entities and audience activities [27]. Their work mainly focuses on analysis rather than providing a method of representing the DDS narrative structure. Godulla and Wolf illustrate prototyping with more versatility. On the micro level, they do this by reproducing the layout segmented by its elements with a minimal depiction. They specify an alphabet letter to determine the modality of the content. They sometimes incorporate using an arrow alongside their model to demonstrate the flow direction of the document. Godulla and Wolf’s prototyping solution supports overlapped segmentation to represent the content’s actual layout. Their representation serves as a skeleton of the original content with symbols depicting the media types of the story [16]. Their representation is based on WYSIWYG through a wireframe structure [28].
Although the prototypes proposed by some authors [6,16] are good options for the story’s segmentation, they still lack expressiveness in arrangements and motions. In their works, the inner elements of a whole layout are disconnected. In the case of animations and motions, their models fail to represent the final state, the quality of change, and the dynamic with other elements. They also share the same problem with graph-based visualizations for representing inner-narrative elements and arrangements [6,16]. Figure 5 presents the prototyping representation by Godulla and Wolf [16].
2.2. Collaborative Process for Producing DDS
2.2.1. Visual Literacy
Visual literacy relies on collective knowledge and familiarity with visual elements, such as dots, lines, shapes, etc., to extract meaning, identify patterns, and make informed interpretations. Dondis considers dots, lines, direction, and primary 2D shapes as fundamental elements for visual literacy, emphasizing their effectiveness in visual communications [29]. Some studies also propose point, line, and area as the basic yet important visual marks or graphical symbols [30,31]. Arrows, in particular, have been extensively studied and are widely recognized for their ability to indicate change, movement, causality, and linkage [32,33,34]. These elements serve as effective means for conveying directionality, guiding viewers through complex information, with easy recognition and eliminating distraction [32,35].
2.2.2. Collaborative Process
In the production of modern DDS, various collaborative practices are employed to facilitate the generation of DDS narratives. Since fixation to one solution limits the exploration of alternative possibilities, iterative approaches, like parallel prototyping, allow for the refinement and improvement of ideas through repeated cycles of exploration and analysis [3,10,36]. These collaborative practices do not enforce any strict visual structure in DDS production [37]. Sketching and storyboarding let the participants engage in visual communication as thinking aids to structure their thoughts [5]. With their ambiguous, rudimentary nature, sketches especially allow for multiple interpretations, re-interpretations, and the generation of new ideas [5]. Similarly, storyboards provide a visual framework for organizing and rethinking ideas, facilitating the exploration of different narrative possibilities [5].
2.2.3. Storyboarding
Storyboarding represents a descrambled version of the story by providing the flow of information comprehensively [5]. Storyboarding, similar to data comics, combines text and visual elements to represent a flow of information [12]. Walker et al. describe the principles of storyboarding in the context of visual analytics, including viewpoint, composition, interaction, annotation, transition, and separability. The composition follows a storyboard template, featuring empty boxes for sketches, lines for text descriptions, and space for associated details, such as titles. The transition between storyboards involves the progression and arrangement of frames, often positioned side-by-side, with annotations and descriptions enhancing understanding. The placement of these panels is important to determine how the order is organized. Often, the storyboard panels are positioned side-by-side [38].
Conventional UX and film storyboarding tools do not align with the needs of DDS, often necessitating separate panels and rigid structures. We propose a more adaptive solution that merges storyboarding with WYSIWYG prototyping within the DDS narrative structure, combining the benefits of reusability and flexibility. In some cases, storyboarding, prototyping, and sketching converge, all underpinned by collaborative brainstorming. Inspired by these practices, our goal is to unite visual elements into an integrated DDS narrative structure.
2.2.4. DDS Authoring Tools
epSpread by Walker et al. provides storyboarding in visual analytics with empty panels and annotation. It does not provide more customization for DDS, making it ineffective for current newsrooms requirements [38]. Gratzl et al. provide a tool that starts from data analysis to exporting a story. Vistory, as they call it, is an interactive presentation style of stories that progress with audience interactions [39]. The use case of their tool is closely related to data analysis and annotating visualization. Therefore, it lacks any visual solution regarding structuring the DDS narrative. DataToon, on the other hand, gives complete freedom to the user by letting them have full control over the content on the canvas, interactions, and the design. Inspired by data comics, DataToon focuses on storyboarding in its essence; it lets the audience provide their sketching with a pen, touch gestures, and the right dose of entertainment. The users are able to create their storyboards and customize them with their data and annotations. To involve other personas in the story design process, they need to fundamentally understand the DDS narrative structure. The results of their storyboards are close to data comics or infographics [40].
Conlen et al. put rapid prototyping as the main objective by combining notebooks and literate programming. Their proposed product, Idyll Studio, supports a specific markup language that generates DDS with custom styling. The representation of the DDS narrative in their work is based on a WYSIWYG strategy since they have an edit in the place feature. Since they represent the DDS structure by a markup language, the first concern arises from a lack of specific knowledge regarding this tool. Their result shows their markup language is more adaptable than current basic web technologies like CSS or JavaScript. Although the range of different narrative structures seems to satisfy newsroom standards, the lack of visual communication devices in their tool limits the number of personas that can contribute to story design [41,42].
Similarly, Satyanarayan and Heer propose Ellipsis, offering a domain-specific language for authoring DDS with a graphical interface. They define the concept of scene and sub-scene, linking them through user-driven events. They bind data changes to these events as the DDS progress. Their model lacks any representation of DDS narrative structure, supporting a specific type of directed storytelling [43].
VizFlow is another tool that targets rapid prototyping by providing a quick templating system for layouts with a text-chart link structure. These layouts include side-by-side, snippets over a chart, pinned charts, long charts, long form, and snapshots. Their tool supports text editing, replacing visualizations, and sequencing these different layouts. However, their tool lacks any mechanism to support authors in their early story design process. In other words, since they do not provide a visual structure for DDS narrative without any content, VizFlow cannot provide visual communication in the storyboarding process and ideas generation. Although their paper provides a schematic depiction of these layouts, their tool only utilizes this representation as icons [44]. Although we support the idea of providing ready-to-go templates to see the result faster, in some cases, the lack of any flexibility toward DDS story direction prevents the DDS authors from exploring more alternatives.
Morth et al. propose ScrollyVis Editor, a tool for storyboarding sequenced scene (shots) style DDS that supports a logic-based nonlinear structure. They indicate that they target scrollytelling, where the audience only progresses through scrolling and clicking. Their tool contributes specifically to medical science to facilitate storytelling for non-technical users. Therefore, the inadequacy of providing a structure for the DDS narrative remains a significant challenge among newsroom professional authors. Zhao et al. propose ChartStory, a tool for creating interactive portioned infographic DDS. Inspired by a study on layouting and partitioning [12], they provide rich interactive visualizations to ensure their exported DDS can convey many different storytelling scenarios. However, with a lack of story flow and smooth scrolling experience, today’s industry expectations will be compromised [45].
In another study, Brehmer et al. provide an authoring tool to make various timeline visualizations in a storytelling format. Their work does not support different DDS narrative structures but differentiates between the concepts of a timeline and a storyline [46,47]. Finally, Obie et al. propose a tool for rapid data analysis and visualization with the help of a graph structure that combines visualization nodes with a wide list of interactions to provide better visualization sense-making. Gravity++ follows a previous version of the same tool [48,49].
The first problem regarding the current prototyping and storyboarding solutions in DDS is that these tools do not provide a semantic connection between dynamically changed elements. In other words, if a visualization changes to a static image, these visual effects are not intelligible through their system. The second problem is they do not provide any structured scaffolding to start prototyping when the content is not ready yet. This gap remains unaddressed since a visual representation of the DDS narrative structure has not been proposed. In this paper, we aim to provide fundamental and integral knowledge of the DDS narrative structure, linking it to the prototyping and storyboarding process.
3. Proposed Design Language
In the pursuit of establishing a foundation for the DDS narrative structure design language, we undertook a three-step process. Initially, we conducted a thorough review of related studies described in the previous Section, extracting insights in the form of tags (codes) that primarily pertained to the visual features of the DDS narrative structure. Subsequently, we scrutinized prototyping and storyboarding solutions through DDS narrative taxonomies and examined the authoring tools discussed in related studies, extracting pronounced design directives. The key insights gleaned from this literature review defined the original foundation of the DDS narrative structure.
The third step involved a thematic analysis, where we delved into the findings from the literature review and brainstorming sessions. Three brainstorming sessions were held with four DDS authors in the news industry to gauge the practicality of the insights obtained from the literature. These sessions, conducted through online meetings lasting one to two hours each, not only added an empirical layer to the thematic analysis but also provided valuable insights into the requirements and expectations of industry professionals from a prototyping and storyboarding standpoint. This step placed priority on user-centered design in shaping our overall design process.
The insights from our initial brainstorming sessions, while valuable, had limitations as they were based on a limited group of industry professionals and newsrooms. To gain a more comprehensive understanding of DDS production workflows and their requirements, we needed to involve a broader range of personas from various newsrooms.
In the last step, we analyzed the collected tags from the previous steps, we grouped the tags and put the similar subordinate entities in a mutual group in no specific order. We structured these collected tags into a multi-dimensional taxonomy to complete the deductive coding process. The result presents a corpus of the essential tags for proposing a comprehensive narrative structure. We then used this taxonomy in an iterative thinking process and design activity to derive the design rules for our proposed DDS narrative structure. The results of this analysis can be found in Figure 6. As well as comprehensive coverage, the entities of Figure 6 also logically progress from the macro-scale spectrum to sub-scene level features. We named and defined the group of entities as follows:
- Goal: Goal shows the big frame directions toward defining the design language.
- Compatibility: Compatibility relates to the compatibility of the design language with current studies regarding various path structures, layouts, narrative patterns, design spaces, and best practices.
- Basis: Basis defines the fundamental strategies with which the design language should align.
- Arrangement: Arrangement defines the strategies for arranging and composing different elements in the design language.
- Transition: Transition defines the strategies for representing a transition in the design language.
- Scene: Scene defines the detailed functionalities related to the scene content of a DDS in the design language.
3.1. Design Language of DDS Narrative Structure
The design language comprises three distinct layers (macro, micro, and inner-narrative). Among these layers, we define several visual elements on the micro level of the DDS narrative structure. The combination of these layers introduces an integrated narrative structure for DDS. We propose the following definitions for the layers of the DDS narrative structure:
- Macro Structure: The macro structure represents the DDS narrative structure on the level of DDS path structures. This level is the highest level of DDS representation, encompassing all DDS scenes and their constructing elements.
- Micro Structure: The micro structure represents the DDS narrative structure on the level of DDS scenes. The micro structure is a descendant of the macro structure. In other words, each plot (path) is divisible into multiple episodes (scenes). This level further breaks down DDS scenes into smaller components called placeholders (Section 3.1).
- Inner-Narrative Structure: The inner-narrative structure represents the DDS narrative structure on the level of placeholders. We define this layer after proposing the same terminology in Section 2.1.1, where the story’s content is no longer divisible into smaller parts that independently communicate meaningful data.
In addition, We propose the following definitions for the visual elements of the DDS narrative structure. These elements exist on the micro level of the DDS narrative structure.
- Placeholder: A placeholder is a schematic depiction of visual content. This visual element represents either a portion or an entire visual scene. The representation of a placeholder is an empty frame marked with a symbol of its modality (content type) in the center. On the theoretical level, a placeholder is an encapsulated entity. It can encompass one to many (n) placeholders. These new descendant placeholders represent their own modality separately. A placeholder’s size proportionally resembles its counterpart’s original content size, although authors may ignore the precision for rapid prototyping and storyboarding. A long graphic with a higher length than the visual frame results in long proportional placeholders. Placeholders depending on their position and their arrangements, come in different types, including primary, overlaid, affixed, stacked, and grouped types (Section 3.1). Figure 7 shows a placeholder representation. This representation shows a schematic figure of the actual content in the DDS narrative structure. Two main factors for this representation (size and modality) change depending on the corresponding contents of the DDS narrative structure.
- Storyline: A storyline is a unidirectional arrangement of placeholders in chronological order based on precedence in appearance. The storyline axis represents progression in the events of the DDS.
- Block: A block is a parallel formation of storylines to divide stories into smaller parallel parts. A single storyline with no other parallel elements counts as a separate block.
Figure 7.
Placeholder representation.

3.1.1. Design Rules for DDS Narrative Structure
The design rules of the narrative structure encompass four main categories as follows: expression, replication, narration, and connection. These design rules exist on the micro level of the DDS narrative structure. With these rules, authors can replicate a wireframe prototype called replica for the entire story. With this model, presenting a schematic version of the story precedes the process of prototyping to the early stages of the design process, with placeholders representing the content modality. In this regard, spaces, scales, ratios, and lengths are adjustable to the viewer’s perspective. Authors incorporate these rules while avoiding unrecommended collisions and visual clutter. Table 2 shows the classification of these design rules. The classification presented in Table 2 encompasses the four main categories of expression, replication, narration, and connection. These design rule categories are further broken down into specific design rules. These classification and design rules are:
- Expression: These design rules refer to the rules associated with the visual expression of the content and the behavior of each individual placeholder.
- -
- Modality: The modality of a placeholder varies; e.g., text, image, visualization, video, map, raw data (including data tables), input, and data video. The modality symbol is not mandatory but is recommended for representing the content role. Figure 8 shows different modality types in our design language.
- -
- Expressive Symbols: Each placeholder may have one to many (n) expressive symbols positioned to express different features of the visual element. The symbols indicate the visual element’s inner-narrative property, including interactivity, effect, carousel, and floating symbols. Figure 9 shows these expressive symbols.
- Replication: Replication refers to all the design rules associated with the primary placeholder’s structure and the positioning of their related elements (Figure 10). A primary placeholder is a placeholder that dictates the positioning of all the related elements associated with it. A particular type of primary placeholder is the full-screen placeholder that expands in both directions to fill the entire viewport. The rules of replication include affixing, overlaying, and stacking. These rules introduce new types of placeholders related to primary placeholders.
- -
- Affixing: Every placeholder is divisible into one to many (n) affixed descendants. The affixed placeholders are not divisible further. They attach to the surface of an outer encompassing placeholder, e.g., annotations and small visual cues. An affixed placeholder has a relative aspect ratio representing its surface compared to its parent. The representation of an affixed placeholder is an empty frame marked with a symbol of its modality positioned over the surface of its parent element.
- -
- Overlaying: Each primary placeholder may be followed by one to many (n) aligned placeholders called overlaid placeholders. They come to the scene by crossing over elements. They are the subsequent placeholders, sliding over their precedent placeholders. The representation of an overlay placeholder is an empty frame smaller than its primary placeholder, marked with a symbol of its modality, positioned following its parent element. Overlaid placeholders are visually separated from their precedent element.
- -
- Stacking: Each placeholder may stack multiple layers of visual elements. In this case, they are also stacked placeholders. To visualize them, instead of one frame, two stacked frames should be used that are slightly shifted against each other. A stacked placeholder cannot be divided further. Since stacking items puts some of them out of visual sight, stories need more interaction from the user. This concern is explicitly stressed in author-driven stories as a contradiction.
- Narration: The narration describes all the design rules associated with the arrangement and movement of different placeholders in combination with each other. We further separated the narration into four design rules as follows: storyline foundation, block formation, group composition, and frame fixation.
- -
- Storyline Foundation: To create a storyline, placeholders should first be aligned in one direction by their precedence in appearance. The length of a storyline is determined by its first and last placeholders. A degree of a storyline is a pair of numbers (i, j) called i to j, showing the number of the overlaid placeholder (i) crossing over to the number of placeholders (j) through the whole thread of the storyline. For example, a degree of (1, 2) means two placeholders cross over one primary placeholder. A storyline may have multiple degrees of storyline as the layout changes through the story. Figure 11a presents a demonstration of a storyline foundation.
- -
- Group Composition: A group composition is a united arrangement of multiple placeholders. A group composition indicates how the visual elements in the same group appear, progress, or move together. To present grouped placeholders, their connection and frame fixation (Section 3.1) must be simultaneous. The grouped placeholders are suitable options to present partitioned layouts, e.g., data comic style, juxtaposition, and separated shots. Figure 12 shows the group composition in both directions.
- -
- Block Formation: To form a block, equally distanced storylines (n) should be placed against each other. The degree of a block is the number of parallel storylines per block. The degree of a block can be single (n = 1), double (n = 2), triple (n = 3), etc. The position of a placeholder is relative to the opposite counterpart, depending on their precedence in appearance. Parallel occurrence means two placeholders appear almost simultaneously in the narrative. A placeholder against a long graphic seeks to accurately present its position compared to framed graphics since its visual element targets a specific location on the longer side. Each block breaks where the number of concurrent storylines changes. Each DDS consists of multiple consecutive blocks. Therefore, in each story, there may be multiple combinations of storyline foundations and block formations in different sections. Figure 11b provides a demonstration of block formation.
- -
- Frame Fixation: A frame fixation is a portion of a storyline that sticks to the viewport to prevent progression in the narrative flow by scrolling or other interactions. With each fixation, the normal flow of DDS interrupts and then continues. A fixated area can grow in both directions using the block formation and storyline foundation to align placeholders. Each fixation has starting and finishing points that indicate the fixated area’s beginning and end. For DDS with separated sequenced scenes (shots), the fixation area begins and ends with each placeholder. In the case of any parallel visual elements, the fixated area becomes longer as an indicator of the fixation time against other elements. Each storyline can have multiple (n) consecutive fixated areas that may overlap. The beginning of a fixated area is always determined by a placeholder called the first pinned. To visualize the frame fixation, a rectangular shape starting from the first pinned covers all the area behind the proceeding elements until it reaches the finishing point. Two visual symbols, pinning in and pinning out, are positioned at the fixated area’s start and end. Figure 13 shows frame fixation.
- Connection: A connection represents a change between two continuous placeholders. Placeholders are connectable only if their connection path does not need to collide with any placeholder with the same type as the two ends. There are four types of connections: transition, progression, aggregation, and execution. To visualize a connection between two placeholders, a dashed straight line exits one side of the source element and enters the opposite side of the destination element while crossing below all the placeholders in between. At any form of connection, the collision points of the line to the sides of the source and the destination placeholders are marked. Two ICON signs are necessary to distinguish the two ends of the connection. Midway, over the connection line, a symbol represents the type of connection. Figure 14 shows different types of connections.
- -
- Progression: A progression connection describes the changes within the states of the same graphics. To progress, the base structure of the first state should remain the same throughout the progression. This convention applies to two different modalities as well as two different visual elements within the same modality, and cannot use this design rule.
- -
- Transition: A transition connection describes the changes within the state of different graphics. Opposite to the progression, transitions happen on the occasion the change cannot be considered as a simple or advanced progression.
- -
- Aggregation: Aggregation means the change happens by merging or juxtaposing another visual element.
- -
- Execution: An execution demonstrates collecting input from the audience to render the visualized result.
3.1.2. Macro Structure
A comprehensive solution for the DDS narrative structure requires conveying different path structures of the DDS. The DDS path structure defines the DDS narrative on the macro level. In a nonlinear DDS path structure, the sequence of scenes may create a loop. In this work, we propose using a modified version of the branched out structure proposed by Godulla and Wolf and Seyser and Zeiller. These studies introduced the branched out structure as a form of directed graph called a tree structure in order to represent the path of a DDS. In a tree structure, each node can only traverse through its parent or children. Since nodes resemble DDS scenes, the consecutive scenes should be connected. This is contradictory because if one scene has an extra connection with its siblings or cross scenes, the structure is no longer a tree structure since it creates a loop. To solve this, we modified the loop structure by adding duplicate scenes in each exclusive branch in order to avoid loops. Figure 15 shows how to change a directed graph with loops to a tree structure.
If we apply the same modifications to our design language elements, we visualize every episodes of a DDS structure with the common ancestor (parent), parallel with each other with a small gap. If each episode also has parallel storylines, the gap between the episodes increases to demonstrate the episode separation. A heavy-stroked line connects parallel episodes. Using this method, the path structure becomes a tree structure in the macro structure arrangement. If a similar block or placeholder repeats throughout the entire document, the design language keeps the duplicate in exchange for keeping the design coherent. In general, it is advised to use the WYSIWYG design approach since it is intuitive and used by design tools [28]. This method represents each episode of DDS through a linear structure by removing any loops in their nonlinear structure. Linear structures are easy to follow. Therefore, the readability increases through the early stages of story design. Figure 16 shows an example of DDS with multiple paths in a tree structure format.
3.1.3. Inner-Narrative Structure
The expressive symbols design rule is created to explain the content of the inner-narrative structure. In each DDS design, there is a point where the author decides to stop breaking down the design. For example, authors break down juxtaposition or comic-style layouts into simpler elements while avoiding breaking a bar chart into smaller parts since these parts do not project any meaning on their own. These meta-symbols make a DDS expressive since they add visual features, like interactivity, effect, floating, or carousel symbols. If the structure inside a placeholder is an interactive multi-path element, it is best to consider the root placeholder as a divider node of the story, which takes its own path. In this case, the separate path appears aligned with the multi-path placeholder, separated by a dashed line. Both of these approaches are acceptable on their terms. Depending on the complexity of the inner-narrative path, authors decide to what extent their prototype should be expressive.
4. Evaluation of Proposed Design Language
To show the effectiveness of the proposed design language, it was evaluated by assessing its ability to describe a wide range of DDS. To address this, we conducted an audit of 100 published DDS to show the language’s comprehensiveness, versatility, and expressiveness against real-world examples. This audit evaluated the performance and effectiveness of the design language specifically for more complex forms of DDS.
4.1. Protocol
We audited 100 DDS to evaluate different design rules of the design language with real-world examples. We selected 100 DDS since this was higher than for previous studies on this topic [2,19,50]. The selection process used was convenience sampling from examples of published DDS by notable news agencies and the data visualization community. The inclusion area was examples that were published in the last five years since web technology has accelerated over this period. Since DDS development is heavily dependent on web limitations, our DDS selection includes recent changes to web standards. We also ensured that we included a different range of DDS types, including layouts, path structures (linear, nonlinear), arrangements, and interactivity. However, this did not prevent us from diversifying the selection.
We started the audit process by prototyping the 100 DDS selection process using the design rules provided by the language. This process allowed us to break down the structure of our DDS selection. Table 3 shows the structure of this audit checklist, which is adapted by the design classification (Table 2) based on four main design categories: expression, replication, narration, and connection. The result of this audit process is available on Google Sheets (ikamyx.github.io/DataStoryDesign/audit, accessed on 23 November 2023) in a tabular format. The result shows the performance of our proposed design language against the 100 DDS selection. The first and second fixed rows present a checklist (Table 3) that includes the design rules and some extra information we collected about each DDS. The number in the Block Formation (Degree of Block) represents the number of storylines per block. The pair number in the Storyline Foundation (Degree of Division) shows the number of crossing overlaid placeholders. The audit provides information on the applied principles and shows which types of placeholders (primary, overlaid, affixed) are targeted by these principles. The audit also provides a separate link to each DDS available at the time of authoring this manuscript. In the case of existing multiple paths for certain DDS, all the variations are included in the spreadsheet. The audit represented the frequency rate of each design principle in the bottom row of the spreadsheet. The audit also calculated the result by accumulating different types of placeholders (primary, overlaid, affixed) for each principle. Since there were examples of nonlinear DDS in our DDS selection, we used multiple versions of some DDS. In the calculation process, we counted each single DDS one time exclusively. Our audit represented the result of this calculation at the bottom of the spreadsheet.
4.2. Results and Analysis
We define the comprehensiveness of our design language as its ability to cover all the necessary design rules for defining a visual structure of DDS. In other words, our design language is comprehensive if we redefine and replicate the narrative structure of DDS selection by its rules. These design rules remodel aspects like layouting, positioning, animations, and content into a DDS replica. Through the audit result, we replicated DDS selections with the design rules of the proposed design language. Therefore, this audit process reveals that the design language is entirely comprehensive within the range of the DDS selection. The result suggests that this model of representing DDS is effective since it can remodel more complex forms of DDS. Among the 100 DDS selections, there are highly interactive examples of DDS that require a lot of resources to create. These types of DDS were not discussed and analyzed in detail in previous studies. Our proposed design language, however, offers flexibility in design to a certain extent. In some cases, authors have different solutions for presenting a scene, e.g., as one grouped placeholder vs. parallel storylines. Therefore, for this audit process, we inspected the roles of the DDS elements based on the semantic meaning of each element to obtain the most accurate result.
We define the versatility of a design language as its ability to support a wide range of narrative structures and design elements. It indicates that the DDS audit selection is diverse in its narrative structure. Some stories exhibit a linear progression with a single storyline, while others entail more complexity with multiple storylines, grouped overlaid elements, and transitions. This diversity indicates that the design language effectively represents different narrative approaches, accommodating straightforward and intricate storytelling styles. The audit result also reflects the accumulated frequency percentage of the audit checklist.
The graph in Figure 17 skips the fundamental design rules, like storyline foundation and block formation, since they are necessary to create all the DDS examples. Therefore, their frequency rate is always 100%. The graph shows the popularity of frame fixation and progression among the DDS selection. This graph explains why participants in the brainstorming sessions indicated that they mostly use scrolling effects in their DDS projects. In addition, the audit result inspected more details on the DDS layouts derived from the design principles, e.g., full-screen layouts (derived from primary placeholders). The full-screen layouts showed a significant frequency rate of 45%.
We define the expressiveness of our design language as its ability to showcase the behavior of the content of the original versions of DDS (modality and expressive symbols). Furthermore, we captured a wide range of modality choices and expressive symbols employed in the DDS selection through the audit process. These included text, visualization, image, video, data, data video, input, and map. This demonstrates the language’s ability to accommodate diverse content types and present the storytelling structure through various modalities. Figure 17 projects various modalities in the DDS selections, except for text that appeared in all the audit entries. Data videos and videos (excluding data footage) collectively appeared in more than one-third of the entries. This result means that regardless of the DDS interactions, video use was significant. While some combine videos with interaction to give the audience more control, many prefer auto-playing videos. Regarding expressive symbols, most DDS entries use interaction and effects on different visual elements. These interactions are different than DDS progression through scrolling effects or frame fixation. Since these interactions target the interactivity of individual placeholders, they are different from story progression effects via scrolling.
The audit process also confirms the DataStoryDesign requirements obtained through the brainstorming session, like block formation and storyline foundation. The result reveals that the stories are less likely to simultaneously use more than two storylines. They also show that when frame fixation and overlaying happen, authors prefer to keep one specific narrative element in their design to keep the audience’s attention. This behavior explains the frequency rate of the degree of division (1, 1) in the audit result. However, because of the expressiveness in the design language, under the same settings as DataStoryDesign, authors can combine different design rules with various modalities and symbols to construct the narrative structure.
5. DataStoryDesign: A Prototyping and Storyboarding System for DDS
To showcase the capabilities of the design language in a DDS production pipeline, we present DataStoryDesign, a prototyping and storyboarding system specified for narrative design in DDS. DataStoryDesign is carefully adapted by the language proposed in Section 3.1, which outlines DDS’s key elements and design rules. DataStoryDesign offers a schematic design language to enhance the prototyping and storyboarding experience for DDS narrative design.
In introducing DataStoryDesign, we emphasize its core focus on the design language detailed in Section 3.1, delineating key elements and design rules specific to data-driven story (DDS) narrative construction. While the design language forms the backbone of the system, it is important to note that DataStoryDesign goes beyond a singular emphasis. Alongside this foundational language, the system incorporates features such as collaborative commenting, real-time interaction, auto-saving functionality, and an interactive workflow. These attributes, while not inherently part of the design language, complement the narrative design process within the DataStoryDesign environment. Their integration ensures a cohesive experience as a system for prototyping and storyboarding DDS. Importantly, our evaluation mainly focuses on the core functionality of DataStoryDesign, the design language for prototyping and storyboarding DDS, rather than its supplementary features.
5.1. Requirements and Compatibility
The requirements of the user-centered design suggest a set of design considerations based on the participants’ workflow, design decisions, and UX limitations. These limitations suggest ensuring that the essential functionalities, like creating, editing, and discussing a prototype or storyboard, all happen in one sight. Table 4 shows the DataStoryDesign adapted language with these considerations and the corresponding symbols.
5.2. Features
Other functionalities revolve around the language used in Section 3.1 as complimentary features. The range of features for DDS authoring tools in previous studies varies. The features of DataStoryDesign align intentionally with the core objectives of prototyping DDS. The interface of DataStoryDesign enables users to create and manipulate narrative structures seamlessly. DataStoryDesign users iterate on their storytelling prototypes while discussing the impact of their design choices. It includes features such as grid canvas, layouting options, symbols, file management, and parallel and collaborative prototyping capabilities. Among the features, some are related to the visual aspect of the language, although not directly related. Table 5 introduces these features in DataStoryDesign.
 | Real-time Environment: To encourage collaborative prototyping and storyboarding activity, we designed a real-time workflow where collaborators individually yet simultaneously participate in the story design. All the different panels and features in DataStoryDesign are in real-time. Real-time systems remove the burden regarding the physical distance requirements for certain activities. However, we do not evaluate this aspect since this study focuses on the design language’s applicability. Therefore, we are more interested in knowing the effect of the design language on the prototyping and storyboarding process. |
 | Auto-Save Mechanism: DataStoryDesign provides live databases that reflect changes instantly for all the participants. Therefore, no additional step is needed to save the document. |
 | History Panel: DataStoryDesign archives all steps associated with visual changes on the canvas. It records the steps from the beginning with the ability to retrieve and delete the entire history or part of it. The history panel interactively changes and adjusts the spaces when users change the state. The history panel is shared in real-time for all users, with animations to enhance visual communication. |
 | Commenting Panel: The commenting panel is another feature that enables repositioning the conversation to the visible viewport. The commenting panel is multi-thread because every visual element is separately selectable for comment. The user can add, remove, and edit multi-line comments. |
 | Overview Panel: DataStoryDesign offers an overview window to give more control over accessing, adding, and removing placeholders in a minimized tree structure. This feature is important because the viewport becomes longer as the user adds more elements to the canvas. Therefore, DataStoryDesign provides shortcuts to facilitate fluidity of the tasks in the workflow. |
 | User Panel: DataStoryDesign is a multi user tool. The user panel’s purpose is to facilitate adding and removing team members in a project. |
 | Grid Canvas: The grid canvas represents a model that uses parallelism and flexible vertical position alignment. To emphasize the parallel appearance of the visual elements, the placeholders snap to the canvas on highlighted cells in the grid structure. In addition, the canvas auto-adjusts the spaces to align elements after adding changes. The canvas supports different alignments for placeholders and supports right-click mouse action for convenience. |
 | Flexible Placeholders: Authors fill the content with media files as the prototype progresses. At this point, the wireframe prototypes also play a storyboarding role. To make sure the wireframe prototypes achieve a close appearance to the published articles, DataStoryDesign offers different sizing and frame options for placeholders, including fit, auto, and cropped. Single storyline placeholders extend to fit the whole canvas width (full-screen) to resemble the full-screen content. These placeholders also support multi-frame content to present stacking placeholders. In addition, the placeholders’ height positions are adjustable relative to the longer placeholders. Other features of these placeholders include the ability to render different media formats and to show a separable (docked-out) view. |
 | Text Editor: Titles and paragraphs are the fundamental elements in every DDS article. DataStoryDesign provides a text editor to cover the preliminary requirements for the typography in structuring DDS. |
 | Bird’s-Eye View: To enhance the workspace for longer stories, it was necessary to provide an all-in-one perspective to users. Bird’s-eye view functionality enables quick zoom out to the entire story while keeping the canvas responsive and functional in the zoomed-out view. |
 | Resources Panel: DataStoryDesign supports various media files, also called resources, in file formats that include images, gifs, videos, and maps. The system for file management archives files separately per project with a total space of 1 GB. Adding media files to the placeholders turns a schematic wireframe into a content box with options for sizing using drag and drop. Adding resources to the replica serves the double functionality of prototyping and storyboarding. |
5.3. Implementation
We designed and implemented our tool as a web application with React.JS backed with the real-time databases Firebase and Firestore. To work with DataStoryDesign, users employed the Google authentication system to log in, create, and access the sessions. All privacy concerns were addressed. The application used encapsulation and inheritance in its skeleton. This architecture in the code specifically helped with some features (history, nested placeholders, overview, and commenting modules). A testable version of DataStoryDesign is accessible through the DataStoryDesign GitHub page (ikamyx.github.io/DataStoryDesign, accessed on 23 November 2023).
5.4. Environment
The workspace of DataStoryDesign is divided into three main sections (Figure 18). In the middle section, a canvas exists where users visualize the design language proposed in Section 3.1. On the right side, there is a fixed commenting panel showing the conversation threads. On the left side, there are three tabs: a history, overview, and resources panel, which only show one at a time. The top menu contains the components that represent the design rules of the design language. The main modality icons on the top menu represent the placeholders. Next to them, the connection (transition, progression, aggregation) and the frame fixation (pin in, pin out) components take care of all the dynamics between the placeholders in the canvas. Continuing the menu, the overlaid placeholder component performs tasks on multiple levels. Finally, two expressive symbols define the inner-narrative properties of the placeholders. On the top right corner, the user panel is accessible through a drop-down menu logged in to the creator’s or the collaborator’s profile. The bird’s-eye view icon is on the left side of the side menu.
5.5. Workflow
Upon logging into DataStoryDesign, users enter a workspace neatly organized into three main sections. The central canvas becomes the creative hub, where the intricate design language for DDS takes form. To commence the narrative construction, users can integrate media—be they images, videos, or other multimedia elements—into the canvas. The top menu, boasting various design rule components, empowers users to shape their DDS. These design rules, encompassing aspects like connection (transition, progression, aggregation) and frame fixation (pin in, pin out), dynamically guide the placement of placeholders to ensure narrative coherence. Simultaneously, the commenting panel on the right side facilitates collaboration and discussion, allowing users to add insights and remarks to specific elements. As the narrative evolves, users employ expressive symbols and design rules to imbue meaning into the DDS. Despite the absence of a user profile, navigation options and an overview feature contribute to a collaborative environment, facilitating the creation and iteration of DDS.
5.6. Interactions
DataStoryDesign embeds UX-friendly animations in two directions—either to present actions that create more understanding or to hint to the user to attend to certain visual elements. These animations are short and simple to enhance visual communication and grab the author’s attention. These animations are accessible through the DataStoryDesign GitHub page. DataStoryDesign supports drag-and-drop animated interactions on many components and panels, including the canvas, the placeholder, header components, and the resources. The canvas also highlights potential positions for new items. The canvas supports parallel occurrence by adjusting spaces and connections after changing the placeholder size. Comment threads also support animation by sliding to the parent element. Finally, DataStoryDesign shifts the view to a zoomed-out perspective by running a smooth, slower transition to ensure the user understands the relative portions and the positions of the elements on the canvas. Figure 19 and Figure 20 and show another example of a working project in DataStoryDesign.
6. Evaluation of DataStoryDesign
To measure the usability of the design language as a prototyping and storyboarding system, we designed and evaluated a multi-stage exploratory case study in the production chain of a real newsroom, at Le Devoir, using DataStoryDesign. This case study highlights the practical applicability and provides early indicators of success in utilizing DataStoryDesign for enhancing the DDS production process within an industry context.
6.1. Protocol
The remote pilot experiment included six participants. We let the participants openly access DataStoryDesign and its prototyping and storyboarding system using the design language introduced in Section 3.1. The roles of the participants varied from media director (non-technical) and journalist (non-technical) to motion designer and designer (semi-technical) and front-end developer (technical). In addition, the range of experience of participants varied from one year to fifteen years.
Brainstorming sessions were used to inform participants. They (U1–U6) were provided with introductory information to DataStoryDesign and its functionalities. We onboarded the team by registering team members to the system, including provision of project media files. We asked the team to use DataStoryDesign for two weeks as a prototyping device for their upcoming projects collaboratively and simultaneously. We asked them to create parallel projects and to use the projects’ media content. We explained the settings according to the requirements while showing the tool interface. We did not enforce any specific workflow or design strategy in DataStoryDesign to avoid biasing users throughout the process. In addition, we included six implemented replicas from the audit DDS selection as pre-saved projects. Since their final version had already been published, participants could explore the design rules through these project files.
To obtain more first-hand feedback after the pilot experiment, we arranged individual surveys of the participants (U1–U6) designed using Google Forms in five parts as follows: the design language in DataStoryDesign, prototyping and storyboarding with DataStoryDesign, user experience, visual communication, and summary. The survey consisted of open-ended and closed questions about the effectiveness and quality of these elements.
We then conducted a group online interview with the participants (U1–U6). The group interview focused on collaborative aspects and individual and group challenges when using DataStoryDesign. We interviewed participants by Zoom video conference for one hour. The interview questions were not scripted to ensure that the conversation was not constrained for the participants. In the interview, we asked the team to demonstrate their workflow to ensure they understood each design rule’s functionality.
6.2. Results and Analysis
6.2.1. Remote Pilot Experiment
For the analysis process, we implemented a custom function inside DataStoryDesign to collect users’ activities (individual and collective) by reconstructing an extended history. This derived function duplicates every state with extra information, like timestamp, mouse action associated with (click, right-click, drag and drop), and affecting component (feature). By analyzing this information, we extracted the number of appearances for each design rule used in the final design versus the number of reverted attempts in history. Figure 21 shows this comparison.
The graph of Figure 21 does not include block formation, storyline foundation, and modality since these principles build placeholders, storylines, and blocks. These elements appear in every DDS regardless of genre and complexity. The graph projects the result of seven projects in the remote pilot experiment. The participants added thirty-seven (37) media files to these projects. In addition, the participants used all implemented modalities in their replica, including text, image, video, map, and visualizations.
6.2.2. Survey
We ran an individual survey after the remote pilot experiment on the participants (U1-U6). We targeted multiple criteria through this survey to better understand the design decisions during the remote pilot experiment (the design language in DataStoryDesign, prototyping and storyboarding with DataStoryDesign, user experience, visual communication, and summary). The answers revealed that 75% of the participants had tried prototyping and storyboarding for DDS production before trying DataStoryDesign. The participants added that the prototyping and storyboarding system of DataStoryDesign were effective in their workflow by 80%. The participants mainly defined their goal for prototyping and storyboarding as a “planning phase before implementation” as well as “accelerating idea generation”’. Figure 22 shows the overall experience score (1–5) for the design language versus prototyping and storyboarding with DataStoryDesign.
The survey results shows that the participants’ overall experience with the design language and its prototyping and storyboarding application was effective. However, in the open-ended questions, the participants acknowledged possible improvements to replace their workflow with DataStoryDesign. U3 suggested that they needed functionality to let them preview an early version of the output while their structure progressed. In addition, U1 mentioned they did not necessarily use the real-time functionality all the time since their team size was not big. The participants also wrote that this visual method of representing DDS was effective for visual communication, although there was room for improvement. On the negative side, two participants (U2 and U4) reported bugs in the formatting text. U2 described using resources tools to replace media files one-by-one into the placeholders as inefficient.
6.2.3. Group Interview
During the group interview, participants provided detailed insights about the design language and the prototyping and storyboarding experience with DataStoryDesign. The group interview results aligned with the survey results and confirmed the effectiveness of the design language and its application in DDS prototyping and storyboarding through DataStoryDesign. While the overall feedback was positive, participants identified areas for improvement. U1 and U2 suggested a preview button to visualize early output versions, enhancing the prototyping experience. The participants described the benefit of history as an archive of all the design decisions in their workflow. U3 emphasized the need for better responsiveness and docking functionality to manage windows alongside the canvas. Participants also desired more flexibility, drag-and-drop features, bulk photo adding, and options to hide sidebars. U1 mentioned the usefulness of the bird’s-eye view, which improved visual communication by showing an all-in-one preview. U3, as a journalist, however, indicated that the text formatting in the prototyping process was not satisfying.
Regarding the design language, participants highlighted its benefits as a core structure for prototyping and storyboarding, with U1 mentioning that building different layout options was possible. U2 and U4 emphasized the importance of canvas and the snapping grid system, where they could easily position new placeholders. This grid system combines parallelism, the storyline foundation, and the block formation design rules. We followed the interview by asking questions about the design rules the team missed or misused. Most participants were uncertain about using the expressive symbols since they preferred to replace content as the design progressed. In addition, most participants said more language flexibility in block formation, storyline foundation, and group composition would not confuse them as long as proper onboarding sessions were provided. In the end, the participants indicated that using the design language improved the overall visual communication in their DDS production workflow. The participants were satisfied with prototyping and storyboarding using the design language, but anticipated further development of the design language, prototyping, and storyboarding with DataStoryDesign.
The practical application of the design language and the accompanying tool, DataStoryDesign, was exemplified through various user experiences that shed light on its effectiveness. According to U1, “The design language made exploring different layout options feasible with a structured approach that allowed me to experiment with various visual arrangements”. U2 elaborated, “The canvas and the snapping grid system were effective and allowed me to position placeholders easily and maintain consistency in the layout”. This sentiment was echoed by U4, who noted, “The grid system, combining parallelism, the storyline foundation, and the block formation design rules, provided a solid foundation to visualize the overall narrative structure”.
Moreover, the bird’s-eye view feature received acclaim from U1, who said, “The bird’s-eye view was an interesting feature. Being able to preview the entire narrative layout at a glance improved the cohesion of the story”. U3, a journalist, emphasized the impact on their workflow, sharing, “Using the design language significantly improved the overall visual communication in our DDS production process. It streamlined collaboration and ensured a clearer understanding of the narrative flow”.
In addition, diverse perspectives emerged as various participants shared their encounters and anticipations while working with DataStoryDesign. Notably, the assessments varied across roles, revealing distinct focal points in their utilization of the DataStoryDesign functionalities. This diversity in perspectives is indicative of the varied requirements and priorities inherent in different professional domains. It emphasizes that the effectiveness and utility of DataStoryDesign can fluctuate, dependent on the specific needs and objectives of each role. This nuanced understanding is helpful in recognizing the adaptability and versatility of DataStoryDesign as a tool that caters to a spectrum of user demands within the context of diverse professional responsibilities.
In the case of the media director, the emphasis on project management aspects, such as team integration and progress tracking, stemmed from their role’s overarching responsibility for successful project execution. For them, the ability to efficiently add team members and monitor project progression through the history panel aligned with their need for project coordination. Journalists, on the other hand, prioritize media integration and the use of the typography tool because these aspects impact the visual and narrative aspects of their storytelling. The nuanced nature of media presentation requires tools that enhance their ability to convey information effectively. Designers focus on dynamic visual elements and narration design rules during prototyping because their role revolves around crafting the visual identity and user experience. Ensuring that their envisioned visuals are accurately translated through the prototyping process is paramount for designers to maintain the integrity of their creative vision. Developers engage in progressive communication through commenting as a means to understand design elements before implementation. This approach is driven by the collaborative nature of design and development workflows. Clear communication through comments ensures that developers grasp the intricacies of design choices, minimizing misunderstandings and facilitating a smoother implementation process.
The observed differences are not indicative of shortcomings in DataStoryDesign but are rather a reflection of the diverse and specialized requirements inherent to each role. This contextual understanding allows appreciation of the practicality and efficacy of the design language within the unique contexts of different professional domains. The participants expressed satisfaction with the effectiveness of prototyping and storyboarding, highlighting the potential for further refinement and development in this approach. The participants’ positive experiences and constructive feedback further validate the contributions of this research in enhancing DDS production workflows.
7. Discussion
The evaluation of the design language shows it’s versatility, comprehensiveness and expressiveness, and highlights its adaptability to different narrative structures, and effectiveness for various DDS types based on an extensive audit of 100 examples. Additionally, the preliminary results from an exploratory case study demonstrate the effectiveness of DataStoryDesign in DDS production workflows, improving visual communication and encouraging alternative design solutions. This multi-stage study successfully showcases the practicality of DataStoryDesign within industry workflows and highlights the potential for wider adoption in DDS production. We discuss some key findings based on our evaluation as follows:
- Design Language and Visual Communication: The evaluation process strongly indicated that employing a comprehensive design language for DDS narrative structure can significantly enhance the visual communication aspect of DDS production. By providing authors with a structured and expressive framework, we demonstrated that DDS authors are more capable of effectively conveying their narratives to their audiences. The design language acts as a guide, allowing authors to represent complex data-driven stories visually. This not only improves the clarity of the message but also enables DDS authors to experiment with various design options, ultimately leading to more compelling narratives.
- Prototyping Advantages: Our evaluation also highlights the advantages of using the design language as a scaffolding solution during the prototyping and rapid prototyping phase, especially when the content is not fully prepared. The ability to create visual representations of DDS narratives without complete content can significantly expedite the prototyping process. This is a valuable feature, especially in fast-paced environments where DDS production timelines are tight. Authors can sketch out their ideas and design concepts, making it easier to refine and iterate as the content becomes available.
- Storyboarding Experience: While the design language and DataStoryDesign show promise in enhancing the DDS production workflow, our evaluation indicates that there may be room for improvement in terms of the storyboarding experience. We are not yet entirely confident if our solution provides a substantially better experience for DDS authors during the storyboarding phase. Further refinement and user feedback might be necessary to optimize this aspect. Storyboarding plays a crucial role in visual storytelling, and any enhancements in this area could lead to more efficient and effective DDS production.
- Consideration of Additional UX Factors: It is essential to recognize that the overall DDS production process is influenced by various user experience (UX) factors beyond just design and storyboarding. While our design language and DataStoryDesign address specific aspects of DDS production, there are other UX elements, such as usability, responsiveness, and collaborative features, that also play significant roles. These factors should be considered alongside the use of the design language to ensure holistic improvement in DDS production workflows.
In conclusion, our evaluation demonstrates that a well-defined design language for DDS narrative structure has the potential to significantly enhance visual communication and to streamline the prototyping phase of DDS production. However, further refinement is needed to optimize the storyboarding experience. Additionally, a broader perspective that considers various UX factors is essential for achieving comprehensive improvements in DDS production workflows. This research opens up exciting possibilities for the future of DDS authoring tools and their role in creating engaging and informative data-driven narratives.
8. Limitations
The information gathered during the brainstorming sessions before the development of DataStoryDesign did not focus on the UX aspects of prototyping and storyboarding. As a result, we do not consider the development process of DataStoryDesign to be fully user-centered. The design language employed for prototyping and storyboarding in DataStoryDesign introduces specific visual requirements that may overlap or conflict with UX-centered design strategies. The UX actions related to design rules became complicated in some cases. For example, for performing the frame fixation design rule, the participants use only two components (pinning in and pinning out) to perform three tasks (start a fixated area, finish a fixated area, remove a fixated area). Therefore, they need to learn the UX-related action for all of them. The previous studies on DDS have not yet explored the specific UX requirements of the prototyping and storyboarding process in DDS. Among these studies, only Walker et al. suggest general guidelines for storyboarding in visual analytics, which has a broader spectrum. Since UX design is a complex topic to convey, involving the UX-related requirements in the design process of our prototyping and storyboarding system, there needs to be thorough investigation of the different facets of this topic. This challenging limitation exists both before the development of the system and in the evaluation phase.
9. Future Work and Conclusions
Future work could explore integrating the design language developed in this proposed work into the existing DDS authoring tools, storyboarding, and prototyping systems. Adapting the design language to these tools could enhance the efficiency and effectiveness of the DDS production workflow, allowing authors to create more diverse and engaging DDS. Additionally, further research could focus on user-centered design strategies for DDS authoring tools. By incorporating UX aspects into the design process, future systems could provide more intuitive and user-friendly interfaces, making it easier for authors to create compelling narratives with data.
Furthermore, we found examples like highly immersive 3D DDS that may represent a future industry direction. Thorough development work can expand the design language and its applicability in the prototyping and storyboarding process. We note that such a flexible language, prototyping, and storyboarding system needs well-thought-out planning to support DDS producers’ onboarding process. Moreover, future studies could investigate the impact of the design language on the audience’s receipt of visual communication and understanding of DDS narratives. Understanding how the design language affects audience engagement and comprehension could provide valuable insights for optimizing the storytelling process. Furthermore, exploring the potential of the design language beyond DDS could be an exciting avenue for future research. The principles and guidelines developed in this work could be adapted and applied to other forms of data visualization and storytelling, broadening the scope and impact of the design language. Finally, continuous collaboration with media outlets and news publishers could further validate and refine the design language based on real-world use cases and feedback from professionals in the field. This iterative approach to improvement and refinement could lead to a more robust and widely adopted design language for DDS and online journalism in general.
Author Contributions
Conceptualization and methodology, M.A. and T.H.; software and validation, M.A.; writing, M.A. and T.H.; supervision, project administration and funding acquisition, T.H. All authors have read and agreed to the published version of the manuscript.
Funding
This research was funded by an NSERC Alliance Grant ALLRP-561132-20, in collaboration with Le Devoir Inc.
Institutional Review Board Statement
The ethical committee of Polytechnique Montreal granted the permission to conduct the multi stage user research on all individuals involved in this study on 6 December 2022, ID CER-2223-45-D.
Informed Consent Statement
Written informed consent was obtained from all participants involved in the study.
Data Availability Statement
The raw data supporting the conclusions of this article will be made available by the authors on request. The data collected throughout the study from users are not publicly accessible due to ethical restrictions.
Acknowledgments
We acknowledge and appreciate the help and contribution of Le Devoir and Polytechnique Montreal as well as all the participants in different stages of this study.
Conflicts of Interest
The authors declare no conflict of interest. The funders had no role in the design of the study; in the collection, analyses, or interpretation of data; in the writing of the manuscript; or in the decision to publish the results.
References
- Riche, N.H.; Hurter, C.; Diakopoulos, N.; Carpendale, S. Introduction. In Data-Driven Storytelling; AK Peters/CRC Press: Boca Raton, FL, USA, 2018; pp. 1–15. [Google Scholar]
- Segel, E.; Heer, J. Narrative visualization: Telling stories with data. IEEE Trans. Vis. Comput. Graph. 2010, 16, 1139–1148. [Google Scholar] [CrossRef] [PubMed]
- Duncker, K.; Lees, L.S. On problem-solving. Psychol. Monogr. 1945, 58, i. [Google Scholar] [CrossRef]
- Thudt, A.; Walny, J.; Gschwandtner, T.; Dykes, J.; Stasko, J. Exploration and explanation in data-driven storytelling. In Data-Driven Storytelling; AK Peters/CRC Press: Boca Raton, FL, USA, 2018; pp. 59–83. [Google Scholar]
- Weber, W.; Rall, H. We are journalists.“Production Practices, Attitudes and a Case Study of the New York Times Newsroom. Interaktive Infografiken 2013, 161–172. [Google Scholar] [CrossRef]
- Hiippala, T. The multimodality of digital longform journalism. Digit. J. 2017, 5, 420–442. [Google Scholar] [CrossRef]
- Seyser, D.; Zeiller, M. Scrollytelling—An analysis of visual storytelling in online journalism. In Proceedings of the 2018 IEEE 22nd International Conference Information Visualisation (IV), Fisciano, Italy, 10–13 July; 2018; pp. 401–406. [Google Scholar]
- Chen, Q.; Cao, S.; Wang, J.; Cao, N. How does automation shape the process of narrative visualization: A survey of tools. IEEE Trans. Vis. Comput. Graph. 2023. [Google Scholar] [CrossRef]
- Kim, H. Discovering a Design Space for the Transition of News Articles with Data Visualization from Large to Small Screen Devices. Master’s Thesis, University of Seoul, Seoul, Republic of Korea, 2019. [Google Scholar]
- Hullman, J.; Drucker, S.; Riche, N.H.; Lee, B.; Fisher, D.; Adar, E. A deeper understanding of sequence in narrative visualization. IEEE Trans. Vis. Comput. Graph. 2013, 19, 2406–2415. [Google Scholar] [CrossRef] [PubMed]
- Marcelino, G.; Semedo, D.; Mourão, A.; Blasi, S.; Mrak, M.; Magalhães, J. A benchmark of visual storytelling in social media. In Proceedings of the 2019 on International Conference on Multimedia Retrieval, Ottawa, ON, Canada, 10–13 June 2019; pp. 324–328. [Google Scholar]
- Bach, B.; Wang, Z.; Farinella, M.; Murray-Rust, D.; Henry Riche, N. Design patterns for data comics. In Proceedings of the 2018 CHI Conference on Human Factors in Computing Systems, Montreal, QC, Canada, 21–26 April 2018; pp. 1–12. [Google Scholar]
- Zhao, Z.; Marr, R.; Shaffer, J.; Elmqvist, N. Understanding partitioning and sequence in data-driven storytelling. In Proceedings of the Information in Contemporary Society: 14th International Conference, iConference 2019 (Proceedings 14), Washington, DC, USA, 31 March–3 April 2019; Springer: Berlin, Germany, 2019; pp. 327–338. [Google Scholar]
- Black, J.B.; Bower, G.H. Episodes as chunks in narrative memory. J. Verbal Learn. Verbal Behav. 1979, 18, 309–318. [Google Scholar] [CrossRef]
- Plowman, L.; Luckin, R.; Laurillard, D.; Stratfold, M.; Taylor, J. Designing multimedia for learning: Narrative guidance and narrative construction. In Proceedings of the SIGCHI Conference on Human Factors in Computing Systems, Pittsburgh, PA, USA, 15–20 May 1999; pp. 310–317. [Google Scholar]
- Godulla, A.; Wolf, C. Digitale Langformen im Journalismus und Corporate Publishing; Springer: Berlin, Germany, 2017. [Google Scholar]
- Tong, C.; Roberts, R.; Borgo, R.; Walton, S.; Laramee, R.S.; Wegba, K.; Lu, A.; Wang, Y.; Qu, H.; Luo, Q.; et al. Storytelling and visualization: An extended survey. Information 2018, 9, 65. [Google Scholar] [CrossRef]
- Weber, W. Typen, Muster und hybride Formen. Ein Typologisierungsmodell für interaktive Infografiken. Interaktive Infografiken 2013, 25–37. [Google Scholar]
- Stolper, C.D.; Lee, B.; Riche, N.H.; Stasko, J. Emerging and Recurring Data-Driven Storytelling Techniques: Analysis of a Curated Collection of Recent Stories. 2016. Available online: https://www.microsoft.com/en-us/research/publication/emerging-and-recurring-data-driven-storytelling-techniques-analysis-of-a-curated-collection-of-recent-stories/ (accessed on 23 November 2023).
- Heer, J.; Robertson, G. Animated transitions in statistical data graphics. IEEE Trans. Vis. Comput. Graph. 2007, 13, 1240–1247. [Google Scholar] [CrossRef]
- Kim, Y.; Correll, M.; Heer, J. Designing animated transitions to convey aggregate operations. In Proceedings of the Computer Graphics Forum; Wiley Online Library: New York, NY, USA, 2019; Volume 38, pp. 541–551. [Google Scholar]
- Norambuena, B.F.K.; Mitra, T.; North, C. Narrative sensemaking: Strategies for narrative maps construction. In Proceedings of the 2021 IEEE Visualization Conference (VIS), New Orleans, LA, USA, 24–29 October 2021; pp. 181–185. [Google Scholar]
- Zhao, Z.; Elmqvist, N. The stories we tell about data: Media types for data-driven storytelling. arXiv 2022, arXiv:2202.00047. [Google Scholar]
- Corbett, E.; Connors, R. Classical Rhetoric for the Modern Student; Oxford University Press: New York, NY, USA, 1998. [Google Scholar]
- Hullman, J.; Diakopoulos, N. Visualization rhetoric: Framing effects in narrative visualization. IEEE Trans. Vis. Comput. Graph. 2011, 17, 2231–2240. [Google Scholar] [CrossRef]
- Jia, Y.; Lu, V.; Hoberock, J.; Garland, M.; Hart, J.C. Edge v. node parallelism for graph centrality metrics. In GPU Computing Gems Jade Edition; Elsevier: Amsterdam, The Netherlands, 2012; pp. 15–28. [Google Scholar]
- van der Nat, R.; Müller, E.; Bakker, P. Navigating interactive story spaces. The architecture of interactive narratives in online journalism. Digit. J. 2021, 1–26. [Google Scholar] [CrossRef]
- Guo, H.; Mao, N.; Yuan, X. Wysiwyg (what you see is what you get) volume visualization. IEEE Trans. Vis. Comput. Graph. 2011, 17, 2106–2114. [Google Scholar]
- Dondis, D.A. A Primer of Visual Literacy; MIT Press: Cambridge, MA, USA, 1974. [Google Scholar]
- Bertin, J. Semiology of Graphics: Diagrams, Networks, Maps; University of Wisconsin Press: Madison, WI, USA, 1983. [Google Scholar]
- Börner, K.; Bueckle, A.; Ginda, M. Data visualization literacy: Definitions, conceptual frameworks, exercises, and assessments. Proc. Natl. Acad. Sci. USA 2019, 116, 1857–1864. [Google Scholar] [CrossRef] [PubMed]
- Wong, B. Arrows. Nat. Methods 2011, 8, 701–702. [Google Scholar] [CrossRef]
- Horn, R.E. Visual Language; MacroVu Inc.: Washington, DC, USA, 1998. [Google Scholar]
- Van der Waarde, K.; Westendorp, P. The functions of arrows in user instructions. In Proceedings of the IIID Expert Forum on Manual Design International Institute for Information Design, Eskilstuna, Sweden, 6–9 November 2000; pp. 1–4. [Google Scholar]
- Lechner, V.E. Arrows and their modern versions: Narrativity signalled by lines in data visualizations. J. Vis. Lit. 2021, 40, 51–70. [Google Scholar] [CrossRef]
- Dow, S.P.; Glassco, A.; Kass, J.; Schwarz, M.; Schwartz, D.L.; Klemmer, S.R. Parallel prototyping leads to better design results, more divergence, and increased self-efficacy. ACM Trans. Comput.-Hum. Interact. (TOCHI) 2010, 17, 1–24. [Google Scholar] [CrossRef]
- Weber, W.; Rall, H. Data visualization in online journalism and its implications for the production process. In Proceedings of the 2012 IEEE 16th International Conference on Information Visualisation, Montpellier, France, 11–13 July 2012; pp. 349–356. [Google Scholar]
- Walker, R.; Ap Cenydd, L.; Pop, S.; Miles, H.C.; Hughes, C.J.; Teahan, W.J.; Roberts, J.C. Storyboarding for visual analytics. Inf. Vis. 2015, 14, 27–50. [Google Scholar] [CrossRef]
- Gratzl, S.; Lex, A.; Gehlenborg, N.; Cosgrove, N.; Streit, M. From visual exploration to storytelling and back again. In Proceedings of the Computer Graphics Forum; Wiley Online Library: New York, NY, USA, 2016; Volume 35, pp. 491–500. [Google Scholar]
- Kim, N.W.; Henry Riche, N.; Bach, B.; Xu, G.; Brehmer, M.; Hinckley, K.; Pahud, M.; Xia, H.; McGuffin, M.J.; Pfister, H. Datatoon: Drawing dynamic network comics with pen+ touch interaction. In Proceedings of the 2019 CHI Conference on Human Factors in Computing Systems, Glasgow, UK, 4–9 May 2019; pp. 1–12. [Google Scholar]
- Conlen, M.; Vo, M.; Tan, A.; Heer, J. Idyll studio: A structured editor for authoring interactive & data-driven articles. In Proceedings of the 34th Annual ACM Symposium on User Interface Software and Technology, Virtual, 10–14 October 2021; pp. 1–12. [Google Scholar]
- Conlen, M.; Heer, J. Idyll: A markup language for authoring and publishing interactive articles on the web. In Proceedings of the 31st Annual ACM Symposium on User Interface Software and Technology, Berlin, Germany, 14–17 October 2018; pp. 977–989. [Google Scholar]
- Satyanarayan, A.; Heer, J. Authoring narrative visualizations with ellipsis. In Proceedings of the Computer Graphics Forum; Wiley Online Library: New York, NY, USA, 2014; Volume 33, pp. 361–370. [Google Scholar]
- Sultanum, N.; Chevalier, F.; Bylinskii, Z.; Liu, Z. Leveraging text-chart links to support authoring of data-driven articles with vizflow. In Proceedings of the 2021 CHI Conference on Human Factors in Computing Systems, Yokohama, Japan, 8–13 May 2021; pp. 1–17. [Google Scholar]
- Zhao, J.; Xu, S.; Chandrasegaran, S.; Bryan, C.; Du, F.; Mishra, A.; Qian, X.; Li, Y.; Ma, K.L. Chartstory: Automated partitioning, layout, and captioning of charts into comic-style narratives. IEEE Trans. Vis. Comput. Graph. 2021, 29, 1384–1399. [Google Scholar] [CrossRef]
- Brehmer, M.; Lee, B.; Bach, B.; Riche, N.H.; Munzner, T. Timelines revisited: A design space and considerations for expressive storytelling. IEEE Trans. Vis. Comput. Graph. 2016, 23, 2151–2164. [Google Scholar] [CrossRef] [PubMed]
- Brehmer, M.; Lee, B.; Riche, N.H.; Tittsworth, D.; Lytvynets, K.; Edge, D.; White, C. Timeline Storyteller. In Proceedings of the Computation+Journalism Symposium, Miami, FL, USA, 6 February 2019. [Google Scholar]
- Obie, H.O.; Chua, C.; Avazpour, I.; Abdelrazek, M.; Grundy, J.; Bednarz, T. Authoring logically sequenced visual data stories with gravity. J. Comput. Lang. 2020, 58, 100961. [Google Scholar] [CrossRef]
- Obie, H.O.; Ho, D.T.C.; Avazpour, I.; Grundy, J.; Abdelrazek, M.; Bednarz, T.; Chua, C. Gravity++: A graph-based framework for constructing interactive visualization narratives. J. Comput. Lang. 2022, 71, 101125. [Google Scholar] [CrossRef]
- McKenna, S.; Henry Riche, N.; Lee, B.; Boy, J.; Meyer, M. Visual narrative flow: Exploring factors shaping data visualization story reading experiences. In Proceedings of the Computer Graphics Forum; Wiley Online Library: New York, NY, USA, 2017; Volume 36, pp. 377–387. [Google Scholar]
Figure 1.
Overview of the DDS production workflow considered in this paper. The production workflow of DDS for every newsroom consists of two main parts: ideation and implementation. DDS authors (2) use the design language (1) back and forth in their ideation phase in order to visualize the narrative structure of DDS. The visualization process is embedded in a prototyping and storyboarding environment called DataStoryDesign (3) to produce a final product as a consumable DDS (4). The design language (1) consists of four main categories, including expression, connection, narration and replication, that have their own sub-design rules (5, 6, 7, and 8), as will be detailed in Section 3.

Figure 2.
DDS examples: From left to right, taken from https://www.bbc.co.uk/, https://www.scmp.com/, and https://www.nytimes.com/.
Figure 2.
DDS examples: From left to right, taken from https://www.bbc.co.uk/, https://www.scmp.com/, and https://www.nytimes.com/.

Figure 3.
Panel layouts by Bach et al. [12].
Figure 3.
Panel layouts by Bach et al. [12].

Figure 4.
Parallelism all variations: (a) parallelism as parallel narrative by Jia et al. (one element, one scene, simultaneous) [26]; (b) parallelism as parallel transition by Hullman et al. (one element, one scene, non-simultaneous) [10]; (c) parallelism as parallel path structure by Godulla and Wolf (multiple element, multiple scenes, non-simultaneous) [16]; (d) parallelism as parallel layout (multiple element, one scene, simultaneous) (example taken from https://pudding.cool/).

Figure 5.
Prototypical representation by Godulla and Wolf [16].
Figure 5.
Prototypical representation by Godulla and Wolf [16].

Figure 6.
The corpus of the tags obtained from the analysis of the literature of both previous studies on DDS narrative structure and design directives from past authoring tools (Step 1 and 2 in our three-step process).
Figure 6.
The corpus of the tags obtained from the analysis of the literature of both previous studies on DDS narrative structure and design directives from past authoring tools (Step 1 and 2 in our three-step process).

Figure 8.
Modality types: (a) text, (b) video, (c) image, (d) visualization, (e) input, (f) data video, (g) raw data, (h) map.
Figure 8.
Modality types: (a) text, (b) video, (c) image, (d) visualization, (e) input, (f) data video, (g) raw data, (h) map.

Figure 9.
Expressive symbols: (a) interactivity, (b) effect, (c) carousel, (d) floating, (e) a visualization placeholder with interactivity and effect symbols, (f) an image placeholder with carousel and floating symbols.
Figure 9.
Expressive symbols: (a) interactivity, (b) effect, (c) carousel, (d) floating, (e) a visualization placeholder with interactivity and effect symbols, (f) an image placeholder with carousel and floating symbols.

Figure 10.
Replication: (a) affixing, (b) overlaying, (c) stacking.

Figure 11.
Narration: (a) storyline foundation, (b) block formation.

Figure 12.
Group composition with connection (progression and frame fixation Section 3.1) for two types: (a) vertical, (b) horizontal.
Figure 12.
Group composition with connection (progression and frame fixation Section 3.1) for two types: (a) vertical, (b) horizontal.

Figure 13.
Frame fixation with pin in and pin out symbols at the beginning and finishing of the fixation zone (greyish area): (a) frame fixation starts with a primary placeholder and finishes after an overlaid placeholder; (b) frame fixation starts with a primary placeholder and finishes after another primary placeholder; (c) frame fixation starts with a primary placeholder and finishes after a certain time.

Figure 14.
Connection types with four different symbols that connect two placeholders consecutively with a dashed line in between: (a) progression, (b) transition, (c) aggregation, (d) execution. The modality of the placeholders is replaced to demonstrate the characteristic of the content change schematically.

Figure 15.
Macro structure solution for the path structures with looped directed graphs. The top graph shows a looped structure of the scene. As shown, there are loops between the scenes 1, 2, 3, 5 and 3, 4, 6, 8. In the below figure, the loops between 1, 2, 3, 5 are expanded by duplicating the scene 3 and moving the arrows on the scene to the corresponding target. For scene no 3, the corresponding targets are scene 4, 8. The same principles are applied to the scenes 3, 4, 6, 8 by duplication of scenes 4, 8, 3. In the expanded version of the path structure, the duplicated scenes are highlighted with a dark blue color.

Figure 16.
Macro structure proposed by our design language. As demonstrated in the figure, each episode of DDS is connected through a heavy-stroked line and a large marginal gap with the grey color. The small gaps between placeholders indicate the parallel storylines.
Figure 16.
Macro structure proposed by our design language. As demonstrated in the figure, each episode of DDS is connected through a heavy-stroked line and a large marginal gap with the grey color. The small gaps between placeholders indicate the parallel storylines.

Figure 17.
Design rules frequency in 100 DDS selection represented by the blue bars, except for the expressiveness, and expressive design rule frequency (modality and expressive symbols) in the 100 DDS selection, which are represented by the gold bars.
Figure 17.
Design rules frequency in 100 DDS selection represented by the blue bars, except for the expressiveness, and expressive design rule frequency (modality and expressive symbols) in the 100 DDS selection, which are represented by the gold bars.

Figure 18.
A screenshot of a working project in DataStoryDesign.

Figure 19.
Another screenshot of a working project in DataStoryDesign.

Figure 20.
Another screenshot of a working project in DataStoryDesign.

Figure 21.
Frequency comparison of the design rules. The gold number represents the number of appearances for each design rule in the final design vs. the blue number that represents the number of reverted attempts for each design rule in the history.
Figure 21.
Frequency comparison of the design rules. The gold number represents the number of appearances for each design rule in the final design vs. the blue number that represents the number of reverted attempts for each design rule in the history.

Figure 22.
Survey result (overall experience score (1–5) of the design language (golden dots value) vs. prototyping and storyboarding with DataStoryDesign (blue dots value)). The golden dashed line represents the average score for the design language and the blue dashed line represents the average score for prototyping and storyboarding.


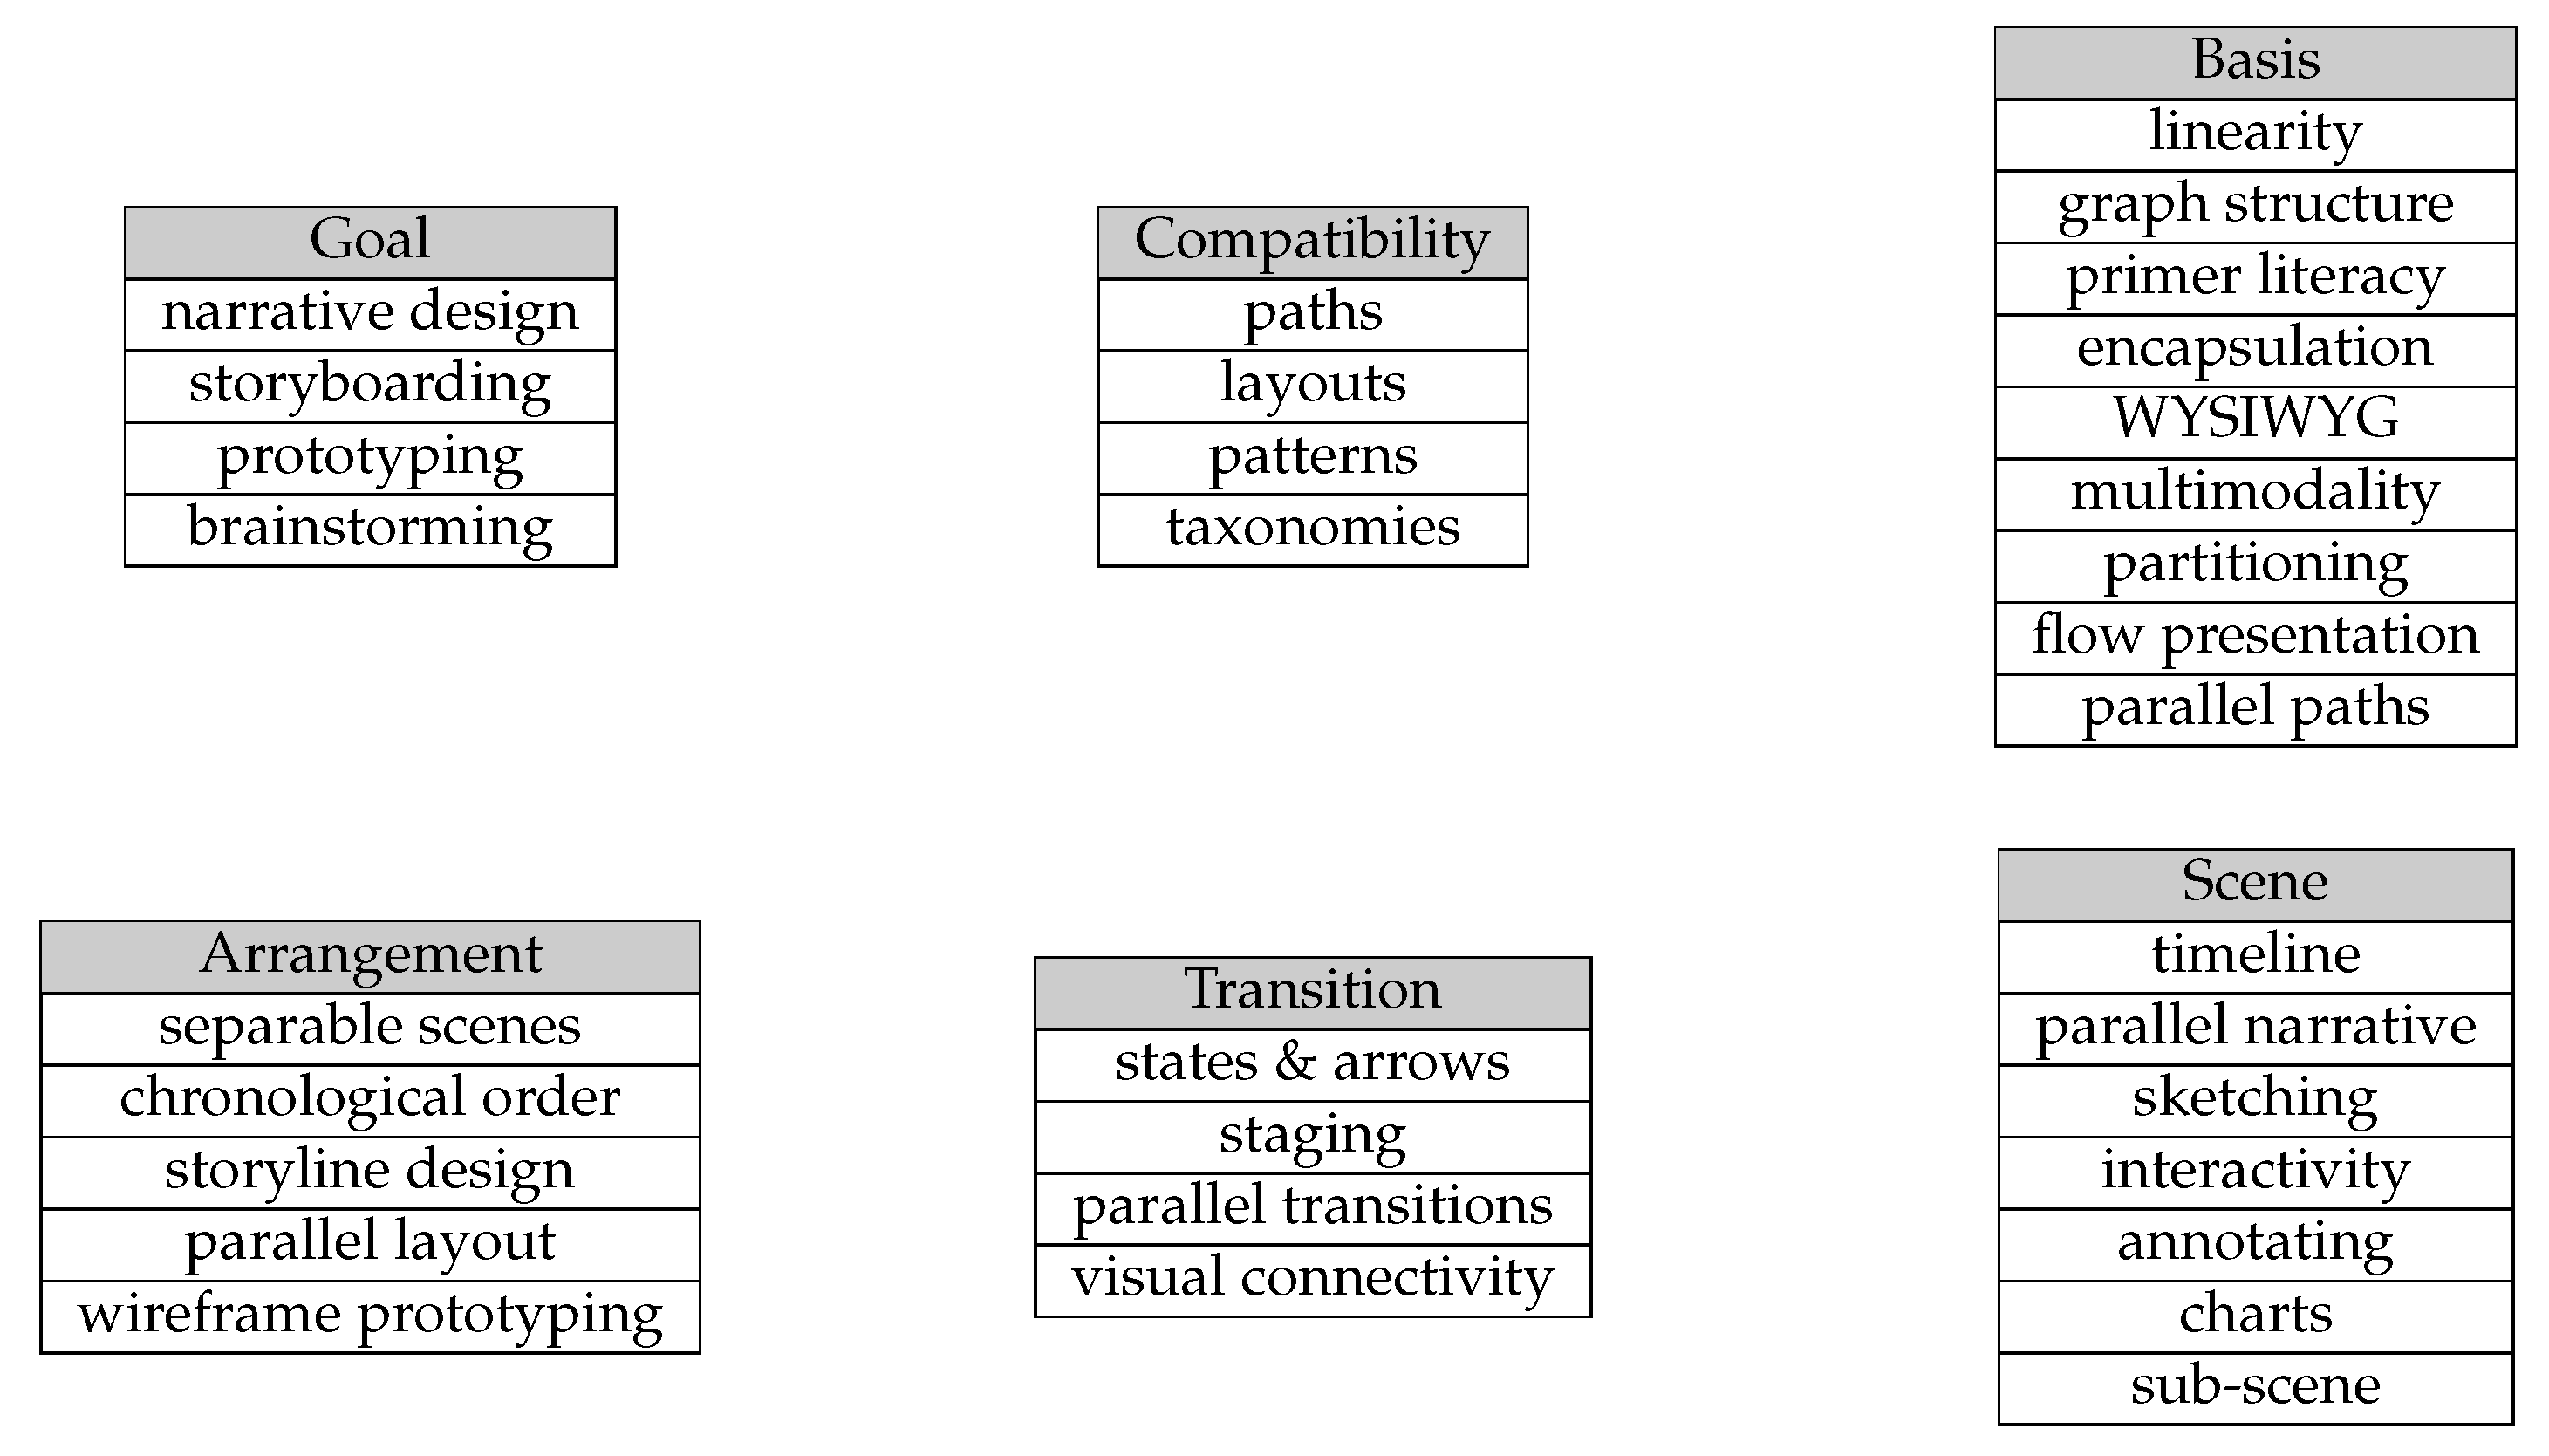
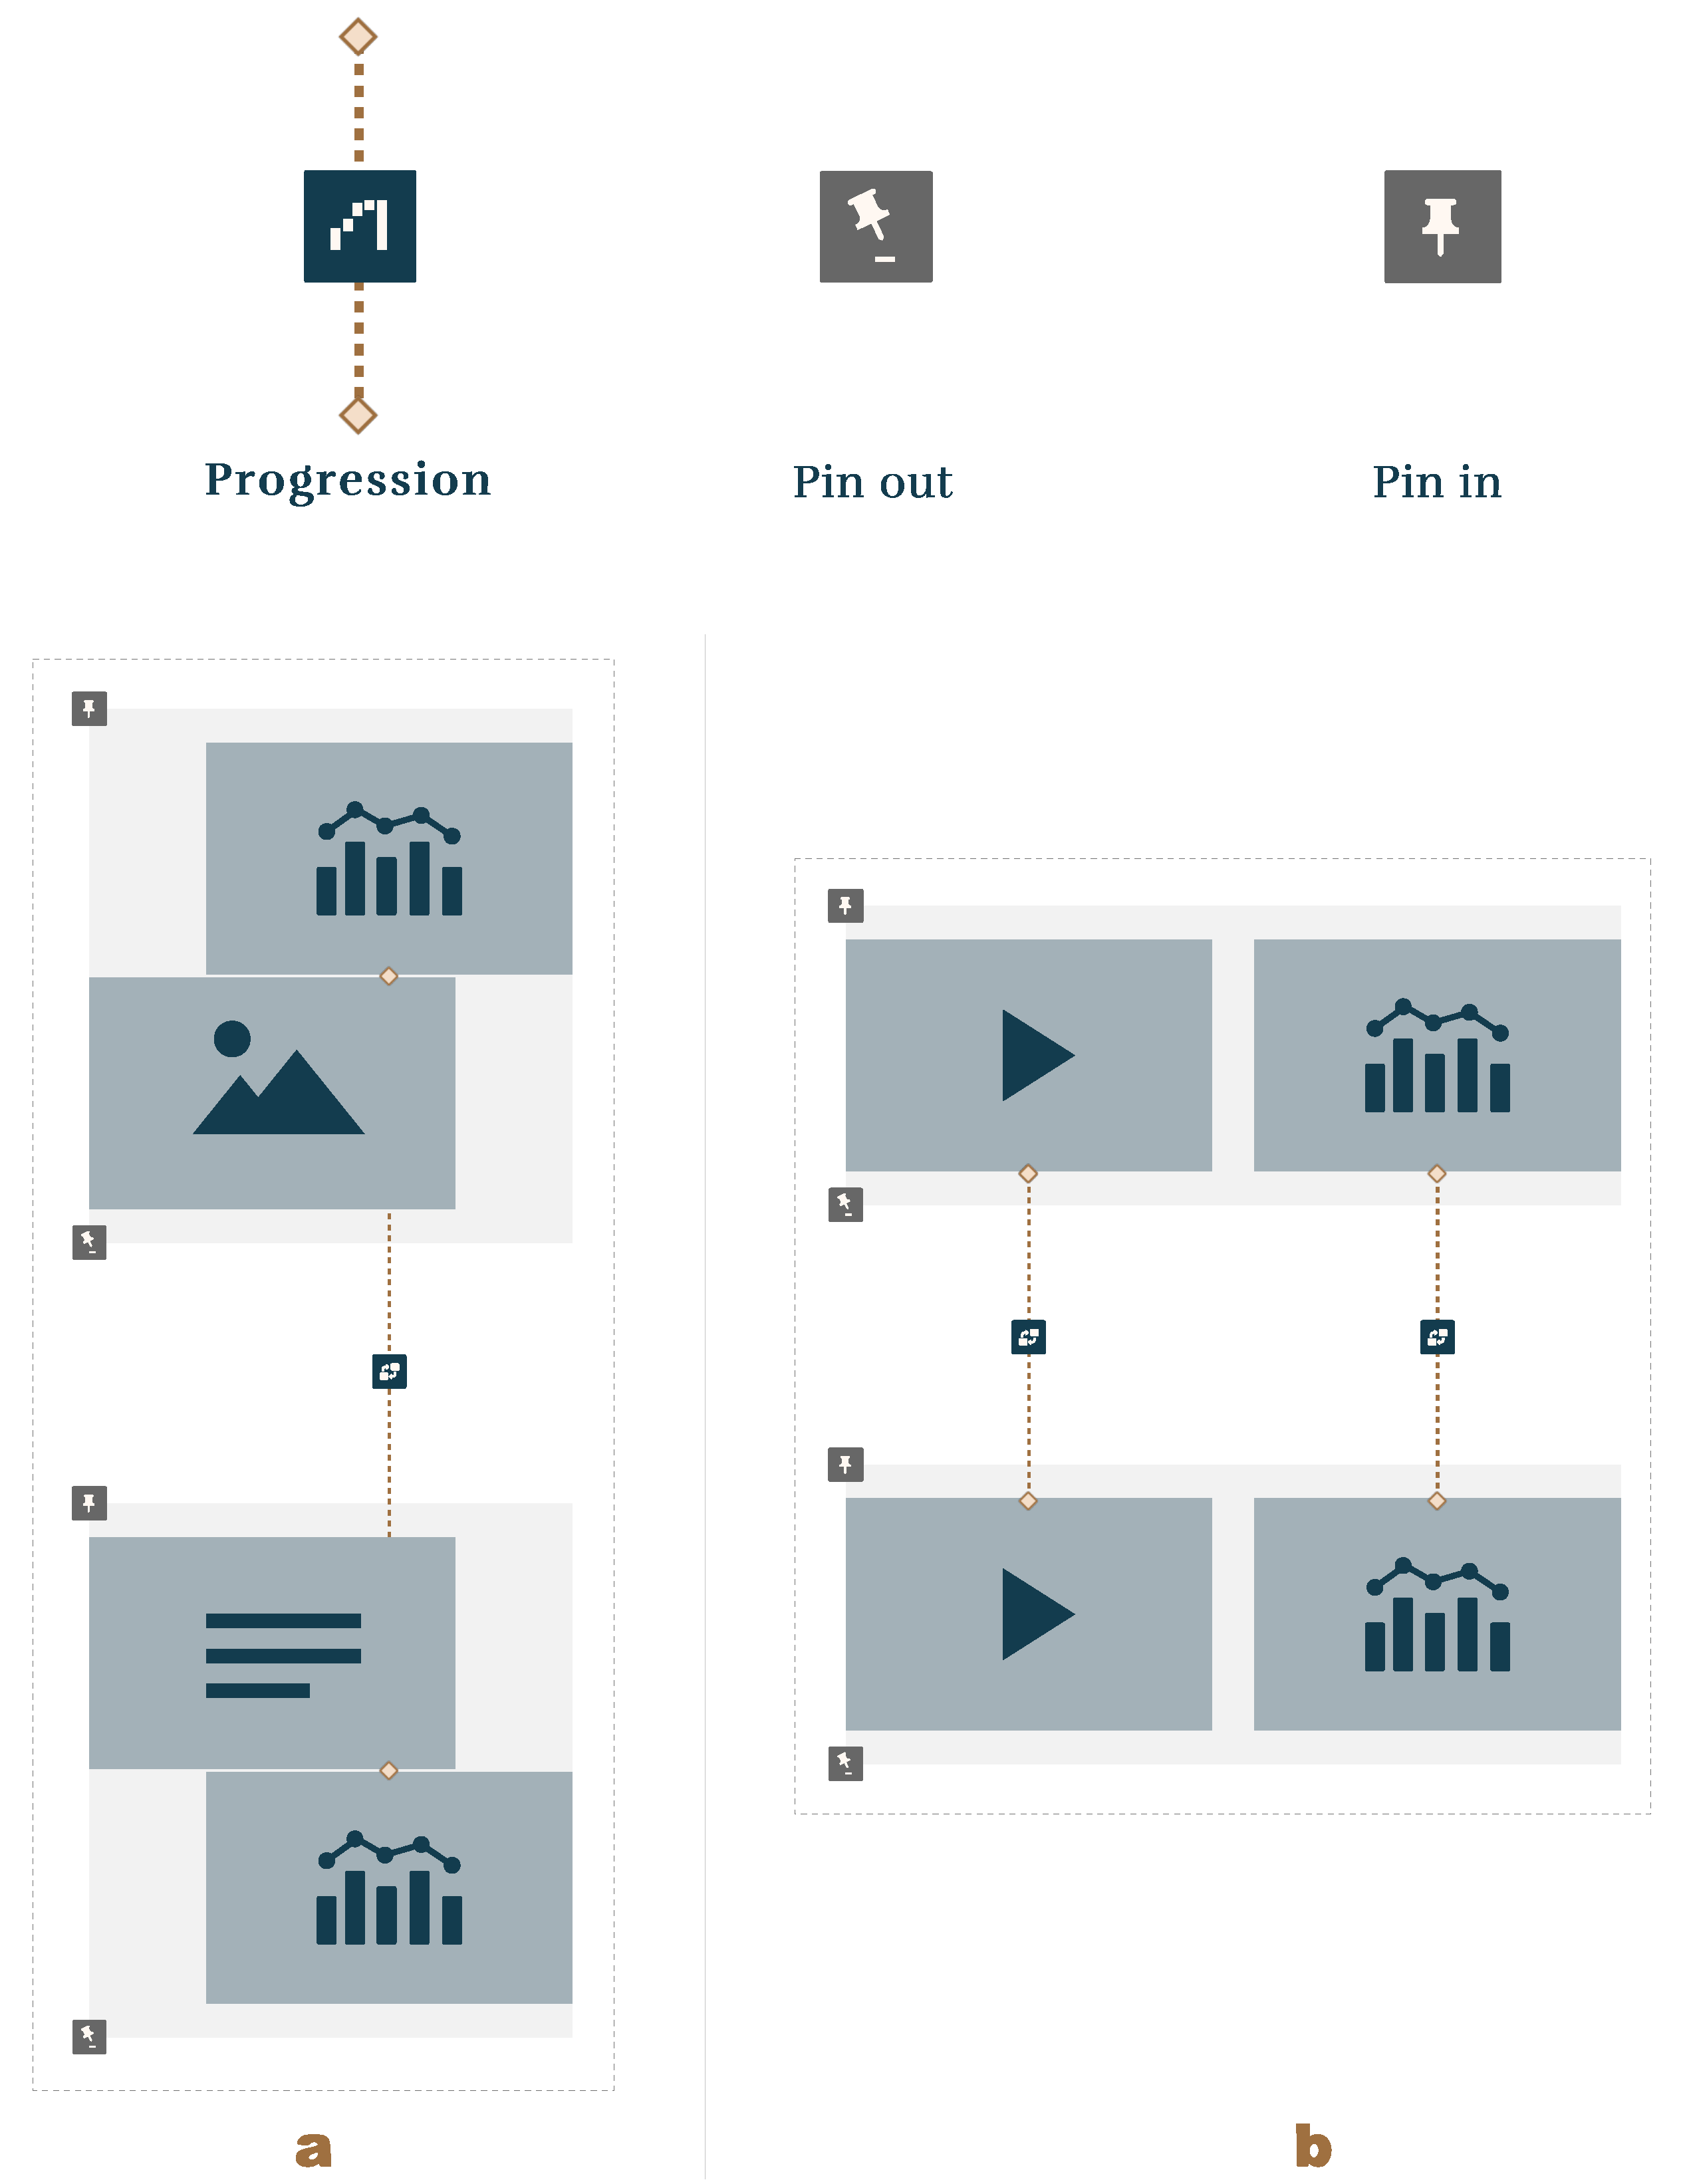
Table 1.
Correspondence table between various path structures.
| [7,16] (Scrollytelling) | [2] | [17] | [7,18] (Storytelling) | [19] (Scrollytelling) |
|---|---|---|---|---|
| linear | linear | linear | linear | linear |
| elastic | user-directed | user-directed | linear-nonlinear | |
| parallel | user-directed | user-directed | linear-nonlinear | |
| threads | user-directed | user-directed | linear-nonlinear | |
| branched out | user-directed | user-directed | linear-nonlinear | |
| concentric | user-directed | user-directed | linear-nonlinear | |
| in chapters | user-directed | user-directed | linear-nonlinear | |
| random access | random access | nonlinear | ||
| all | all | parallel (simultaneous) | all | all |
Table 2.
Structure of the proposed design rules.
| Expression | Modality |
| Expressive Symbols | |
| Replication | Overlaying |
| Affixing | |
| Stacking | |
| Block Formation | |
| Group Composition | |
| Frame Fixation | |
| Connection | Transition |
| Progression | |
| Execution | |
| Aggregation |
Table 3.
Audit checklist: placeholders including (P)rimary, (O)overlaid, (A)ffixed, (S)tacked, (F)ull-screen.
Table 3.
Audit checklist: placeholders including (P)rimary, (O)overlaid, (A)ffixed, (S)tacked, (F)ull-screen.
| Expression | Modality | ||||
| P | O | A | |||
| Expressive Symbols | |||||
| P | O | A | |||
| Replication | Placeholders | ||||
| P | O | A | S | F | |
| Stacking | |||||
| P | O | A | |||
| Affixing | |||||
| P | O | ||||
| Narration | Storyline Foundation (degree of storyline) | ||||
| (1, 1) | (1, 2) | (2, 1) | |||
| Block Formation (no. of blocks) | |||||
| 1 | 2 | 3 | |||
| Group Composition | |||||
| P | O | ||||
| Frame Fixation | |||||
| P | O | A | Grouped P | Grouped O | |
| Connection | Progression | ||||
| P | O | A | |||
| Transition | |||||
| P | O | A | |||
| Aggregation | |||||
| P | O | A | |||
| Execution | |||||
| P | O | A | |||
Table 4.
DataStoryDesign adapted according to design considerations. This table shows the design rules’ correspondences in DataStoryDesign. The middle column shows the component icons used in the interface.
Table 4.
DataStoryDesign adapted according to design considerations. This table shows the design rules’ correspondences in DataStoryDesign. The middle column shows the component icons used in the interface.
| Design Language Rule | DataStoryDesign | Alternative/Considerations |
|---|---|---|
| Primary |  | full support (Modality) |
| Overlaid |  | full support |
| Affixed | no component | Primary |
| Storyline Foundation | no component | Degree (1, 1) on Grid Canvas |
| Block Formation | no component | 1, 2 Storylines on Grid Canvas |
| Group Composition | no component | unidirectional (vertical) |
| Frame Fixation |   | unidirectional (vertical) |
| Progression |  | full support |
| Transition |  | full support |
| Aggregation |  | full support |
| Execution | no component | Progression + Interactivity + alternative path |
| Modality |      | Text, Image, Visualization Video, Map (Primary and Overlaid) |
| Expressive Symbols |   | Effect, Interactivity |
Table 5.
Features implemented in DataStoryDesign.
| Feature | Type |
|---|---|
| Real-time Environment | workflow |
| Auto-save Mechanism | workflow |
| History Panel | workflow |
| Commenting Panel | workflow |
| Overview Panel | workflow |
| User Panel | workflow |
| Grid Canvas | visual |
| Flexible Placeholders | Visual |
| Text Editor | visual |
| Bird’s-Eye View | visual |
| Resources Panel | Visual |
Disclaimer/Publisher’s Note: The statements, opinions and data contained in all publications are solely those of the individual author(s) and contributor(s) and not of MDPI and/or the editor(s). MDPI and/or the editor(s) disclaim responsibility for any injury to people or property resulting from any ideas, methods, instructions or products referred to in the content. |
© 2024 by the authors. Licensee MDPI, Basel, Switzerland. This article is an open access article distributed under the terms and conditions of the Creative Commons Attribution (CC BY) license (https://creativecommons.org/licenses/by/4.0/).
Share and Cite
MDPI and ACS Style
Asgari, M.; Hurtut, T. A Design Language for Prototyping and Storyboarding Data-Driven Stories. Appl. Sci. 2024, 14, 1387. https://doi.org/10.3390/app14041387
AMA Style
Asgari M, Hurtut T. A Design Language for Prototyping and Storyboarding Data-Driven Stories. Applied Sciences. 2024; 14(4):1387. https://doi.org/10.3390/app14041387
Chicago/Turabian StyleAsgari, Morteza, and Thomas Hurtut. 2024. "A Design Language for Prototyping and Storyboarding Data-Driven Stories" Applied Sciences 14, no. 4: 1387. https://doi.org/10.3390/app14041387
Note that from the first issue of 2016, this journal uses article numbers instead of page numbers. See further details here.