
An Optimal BP Neural Network Track Prediction Method Based on a GA–ACO Hybrid Algorithm

1
School of Navigation, Wuhan University of Technology, Wuhan 430036, China
2
Hubei Key Laboratory of Inland Shipping Technology, Wuhan University of Technology, Wuhan 430036, China
*
Author to whom correspondence should be addressed.
J. Mar. Sci. Eng. 2022, 10(10), 1399; https://doi.org/10.3390/jmse10101399
Submission received: 5 September 2022
/
Revised: 24 September 2022
/
Accepted: 24 September 2022
/
Published: 30 September 2022
(This article belongs to the Section Ocean Engineering)
Abstract
:Ship position prediction is the key to inland river and sea navigation warning. Maritime traffic control centers, according to ship position monitoring, ship position prediction and early warning, can effectively avoid collisions. However, the prediction accuracy and computational efficiency of the ship’s future position are the key problems to be solved. In this paper, a path prediction model (GA–ACO–BP) combining a genetic algorithm, an ant colony algorithm and a BP neural network is proposed. The model is first used to perform deep pretreatment of raw AIS data, with the main body of the BP neural network as a prediction model, focused on the complementarity between genetic and ant colony algorithms, to determine the ant colony initialization pheromone concentration by the genetic algorithm, design the hybrid genetic–ant colony algorithm, and optimize this to the optimal weight and threshold of the BP neural network, in order to improve the convergence speed and effect of the traditional BP neural network. The test results show that the model greatly improves the fitness of track prediction, with higher accuracy and within a shorter time, and has a certain real-time and extensibility for track prediction of different river segments.
1. Introduction
The problem of forecasting in the shipping industry was mentioned in the golden age of the shipping industry in the last century. Computer technology addressing accident risk forecasting [1,2], traffic flow forecasting [3,4], inter-ship situation forecasting [5], ship behavior prediction [6,7] and other issues has been developed rapidly. In particular, neural networks have been proposed for ship position prediction or the track prediction problem. In recent years, with the continuous development of the domestic economy and society, the trend of large-scale ships is irreversible, and the risk of ship navigation increases. Navigational factors such as traverse areas and cross-routes are areas with high risk. The future spatiotemporal points and their dynamic parameters for ships near such locations are the influencing factors of regional risk. This has strong practical significance and scientific research value to achieve the prediction of the future trajectory of the ship by analyzing the historical space–time information of the incoming ship. The authors of [8,9] and others proposed a track prediction model based on RNN (Recurrent Neural Network). The authors of [9] first used the trajectory information correction algorithm of symmetrically segmented path distances to correct the ship’s AIS (Automatic Identification Systems). Trajectory data are preprocessed, the DBSCAN algorithm is used to obtain the typical trajectories of ships, and trajectory prediction is performed by constructing a recurrent neural network, which better presents trajectory prediction of typical AIS of marine ships, and has high computational efficiency. However, the applicability of track prediction in the complex environment of inland rivers is insufficient. The authors of [10,11,12] proposed a trajectory prediction method based on a long short-term memory (LSTM) neural network model, and improved the original LSTM network to make it more adaptable to different scenarios. The authors of [13] propose a parallel LSTM–FCN model, which effectively combines the advantages of the LSTM model for long-term prediction of time series data, and the FCN model is good at extracting the details of time series data changes over a longer training time. The authors of [14,15,16] proposed a track prediction model based on the BP (back propagation) network model. The authors of [14,15] used a single BP network model to train historical ship position data according to the basic principle of BP neural network prediction. The future ship position is predicted, but the single BP neural network has the problem of a slow convergence speed, which cannot respond to the data quickly and obtain the prediction result. The authors of [17] studied the uncertainty of ship trajectory prediction, and proposed a probabilistic trajectory prediction model based on a Gaussian process data-driven non-parametric Bayesian model. The model describes the uncertainty of the future position of the ship’s trajectory through a continuous probability distribution, and can achieve high prediction accuracy, but the actual training process requires a large amount of historical trajectory data. The above are some of the more common track prediction models in recent years. The track prediction needs to process the ship’s historical spatiotemporal information matrix as training samples and test samples, substitute the feature indicators into the selected network model, and adjust the parameters of the network model to achieve better weights and thresholds, and then predict the target index value. However, the manual adjustment method cannot make the network model optimal in a short time. In this paper, an optimization function based on a hybrid ant colony genetic algorithm (GA–ACO) is used to solve the optimal function of the BP neural network model. The network model with the best weights and thresholds is used to predict the track, which improves the accuracy of the network prediction and accelerates the network convergence speed.
As for optimization algorithms, they have emerged one after another in recent years, especially meta heuristic algorithms, which have been continuously applied in various fields. The agent model assisted gray wolf optimization (SAGWO) algorithm was proposed by Dong [18] et al. The SAGWO algorithm generates new wolf heads in each cycle according to the knowledge obtained from the RBF model, and changes the position of the wolf pack according to the position of the wolf heads, to achieve the goal of balanced development and exploration. The authors of [19], according to the principle of maximizing the difference of fitness between learners and role models, proposed an improved PSO algorithm, namely RBLSO (ranking-based paired learning (RPL) and biased central learning (BCL)). The RPL strategy is to let poor particles learn from better particles according to their ranking, to speed up convergence. The BCL strategy is to make each particle learn from the fitness weighted center (biased center) of the whole population, to enhance the exploration ability of the algorithm.
2. Data Preprocessing
In the process of receiving AIS data, due to various factors, the data will be incomplete, and dynamic elements such as ship position, speed, and heading will be lost. In the data preprocessing, it needs to be eliminated. In order to ensure the original data are retained as much as possible and make trajectory prediction more realistic, this paper only uses the erroneous data to be eliminated and the AIS data of normal transmission are retained. The data are the historical AIS-NMEA raw data of the Wuhan section of the Yangtze River from June 2021 to September 2021. A total of 10.49 million pieces were decoded.
The data preprocessing function uses the Pandas library function to operate the MySQL database (workbench8.0, MySQL AB, Sverige) through Python mapping. The specific steps are shown in Figure 1 and the pseudo code is shown in Algorithms 1.
According to the obtained data, the data matrix of the neural network prediction model is established:
M is the total number of retained AIS data;
, Ni is vector. Among them, MMSI is the maritime mobile identification code of the ship, Ti is the receiving time, and LONi and LATi are the latitude and longitude, Ci, Vi, Ai, Ri are the course (COG), speed (SOG), acceleration (A), and rate of turning (ROT), respectively; MMSI is set as the primary key in the database.
| Algorithms 1. AIS data preprocessing |
| Data preprocessing pseudocode |
| 1: Connect to the database. |
| 2: Get Ni; where i in Len(N);//N is the total number of Trajectories. // |
| 3: if Ni.mmsi = Ni−1.mmsi &&R; Ni.sog ∈ [1 kn, 15 kn] && Ni.Δt: <300 s |
| //sog is the speed of the vessel, Δt is the time interval between two-state. // |
| 4: then Optimization (Ui), ;//Optimize (-) is the trajectory optimizing function. // |
| Return: Ui |
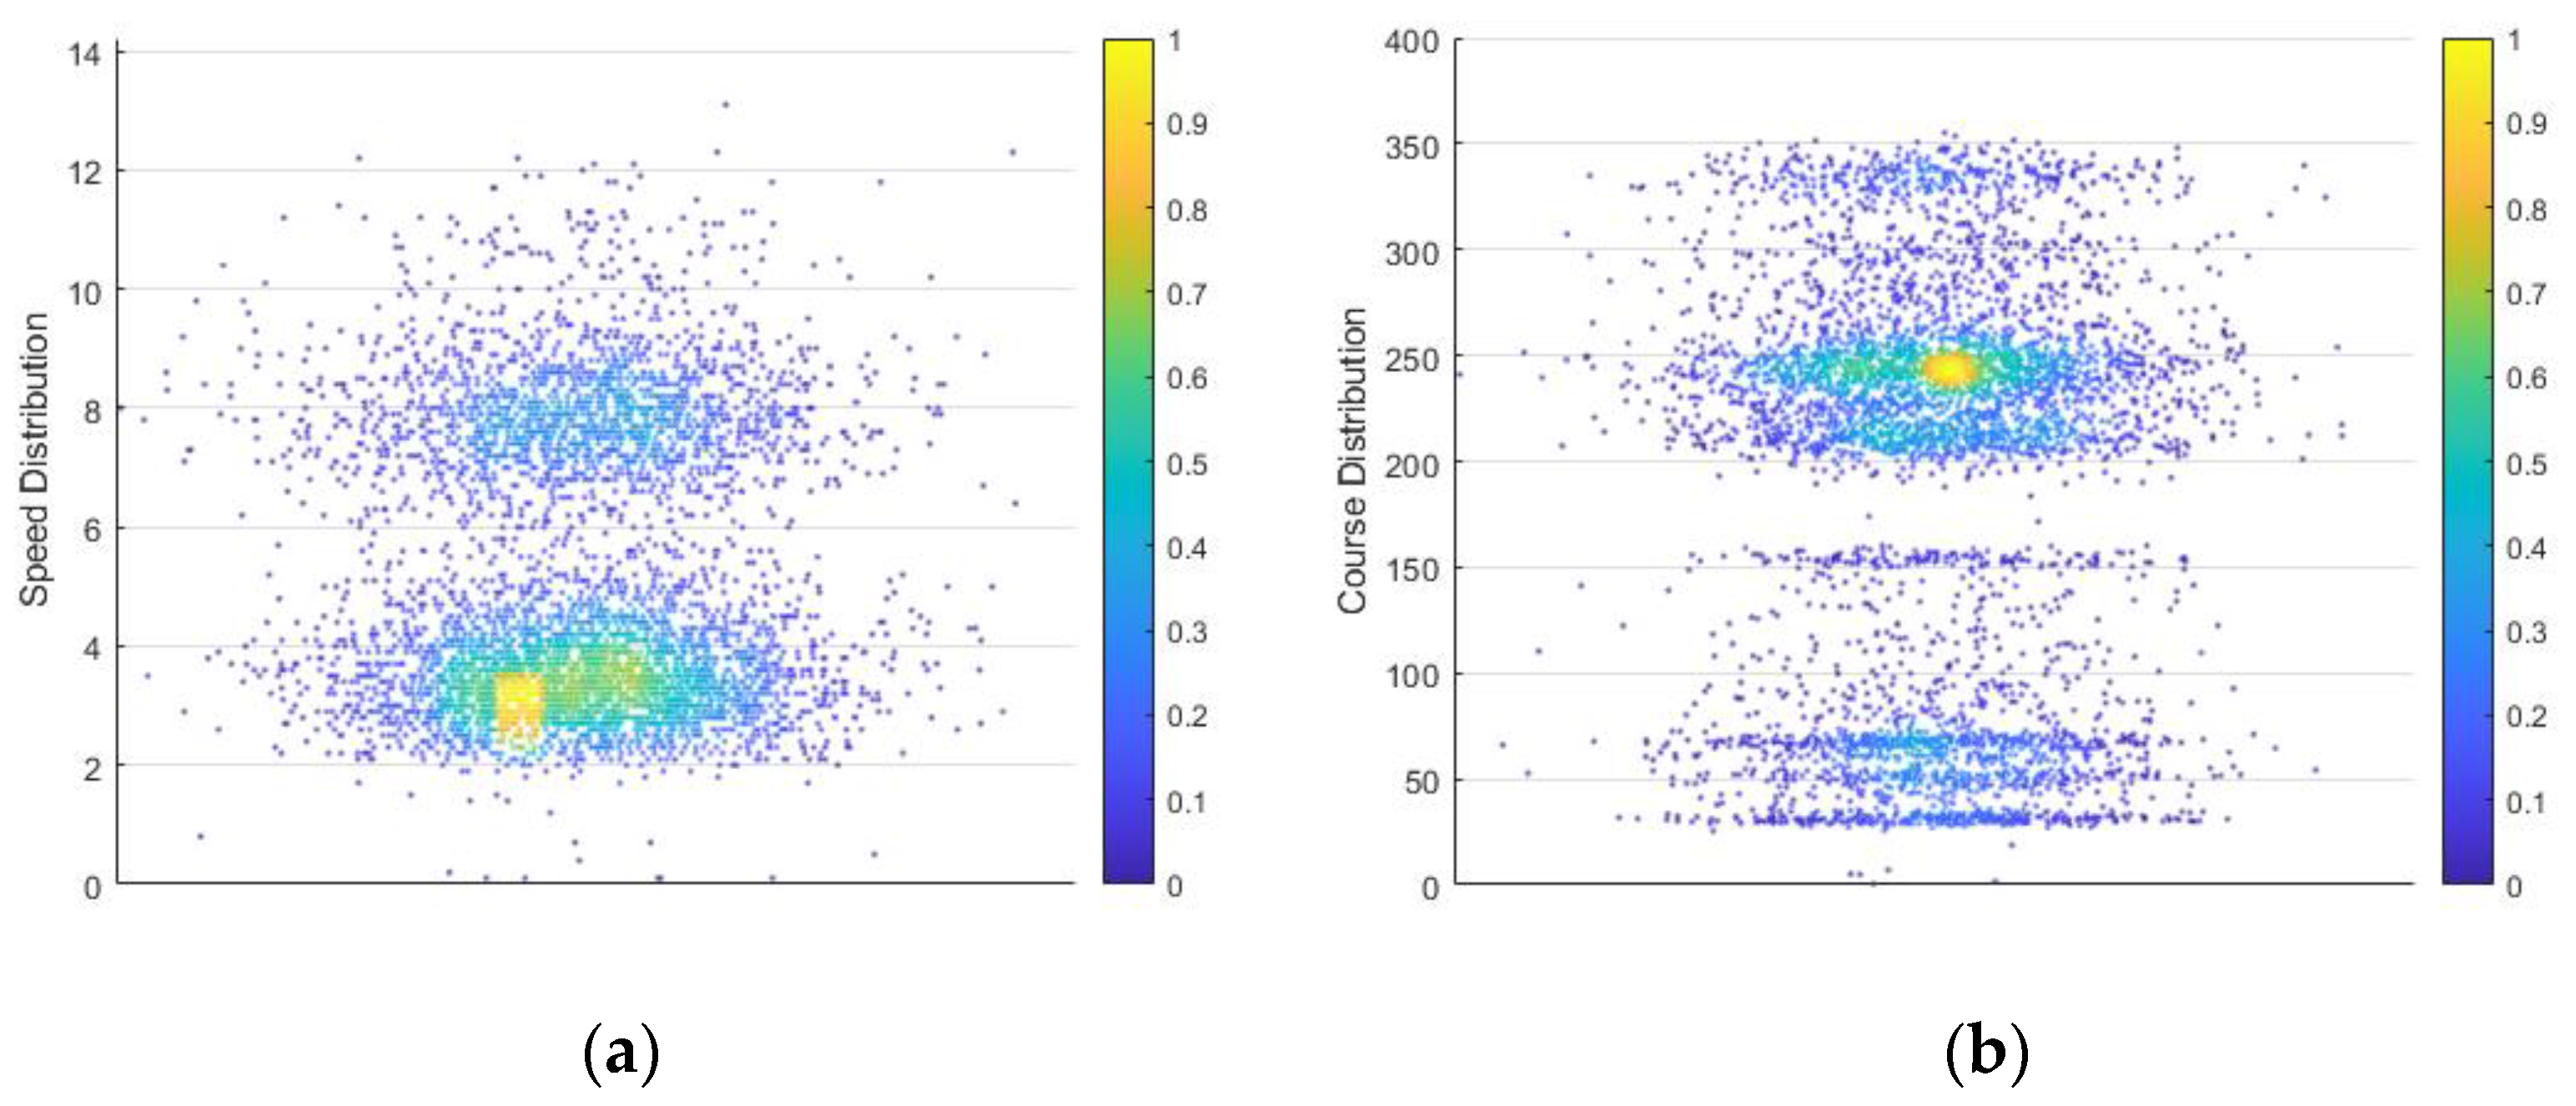
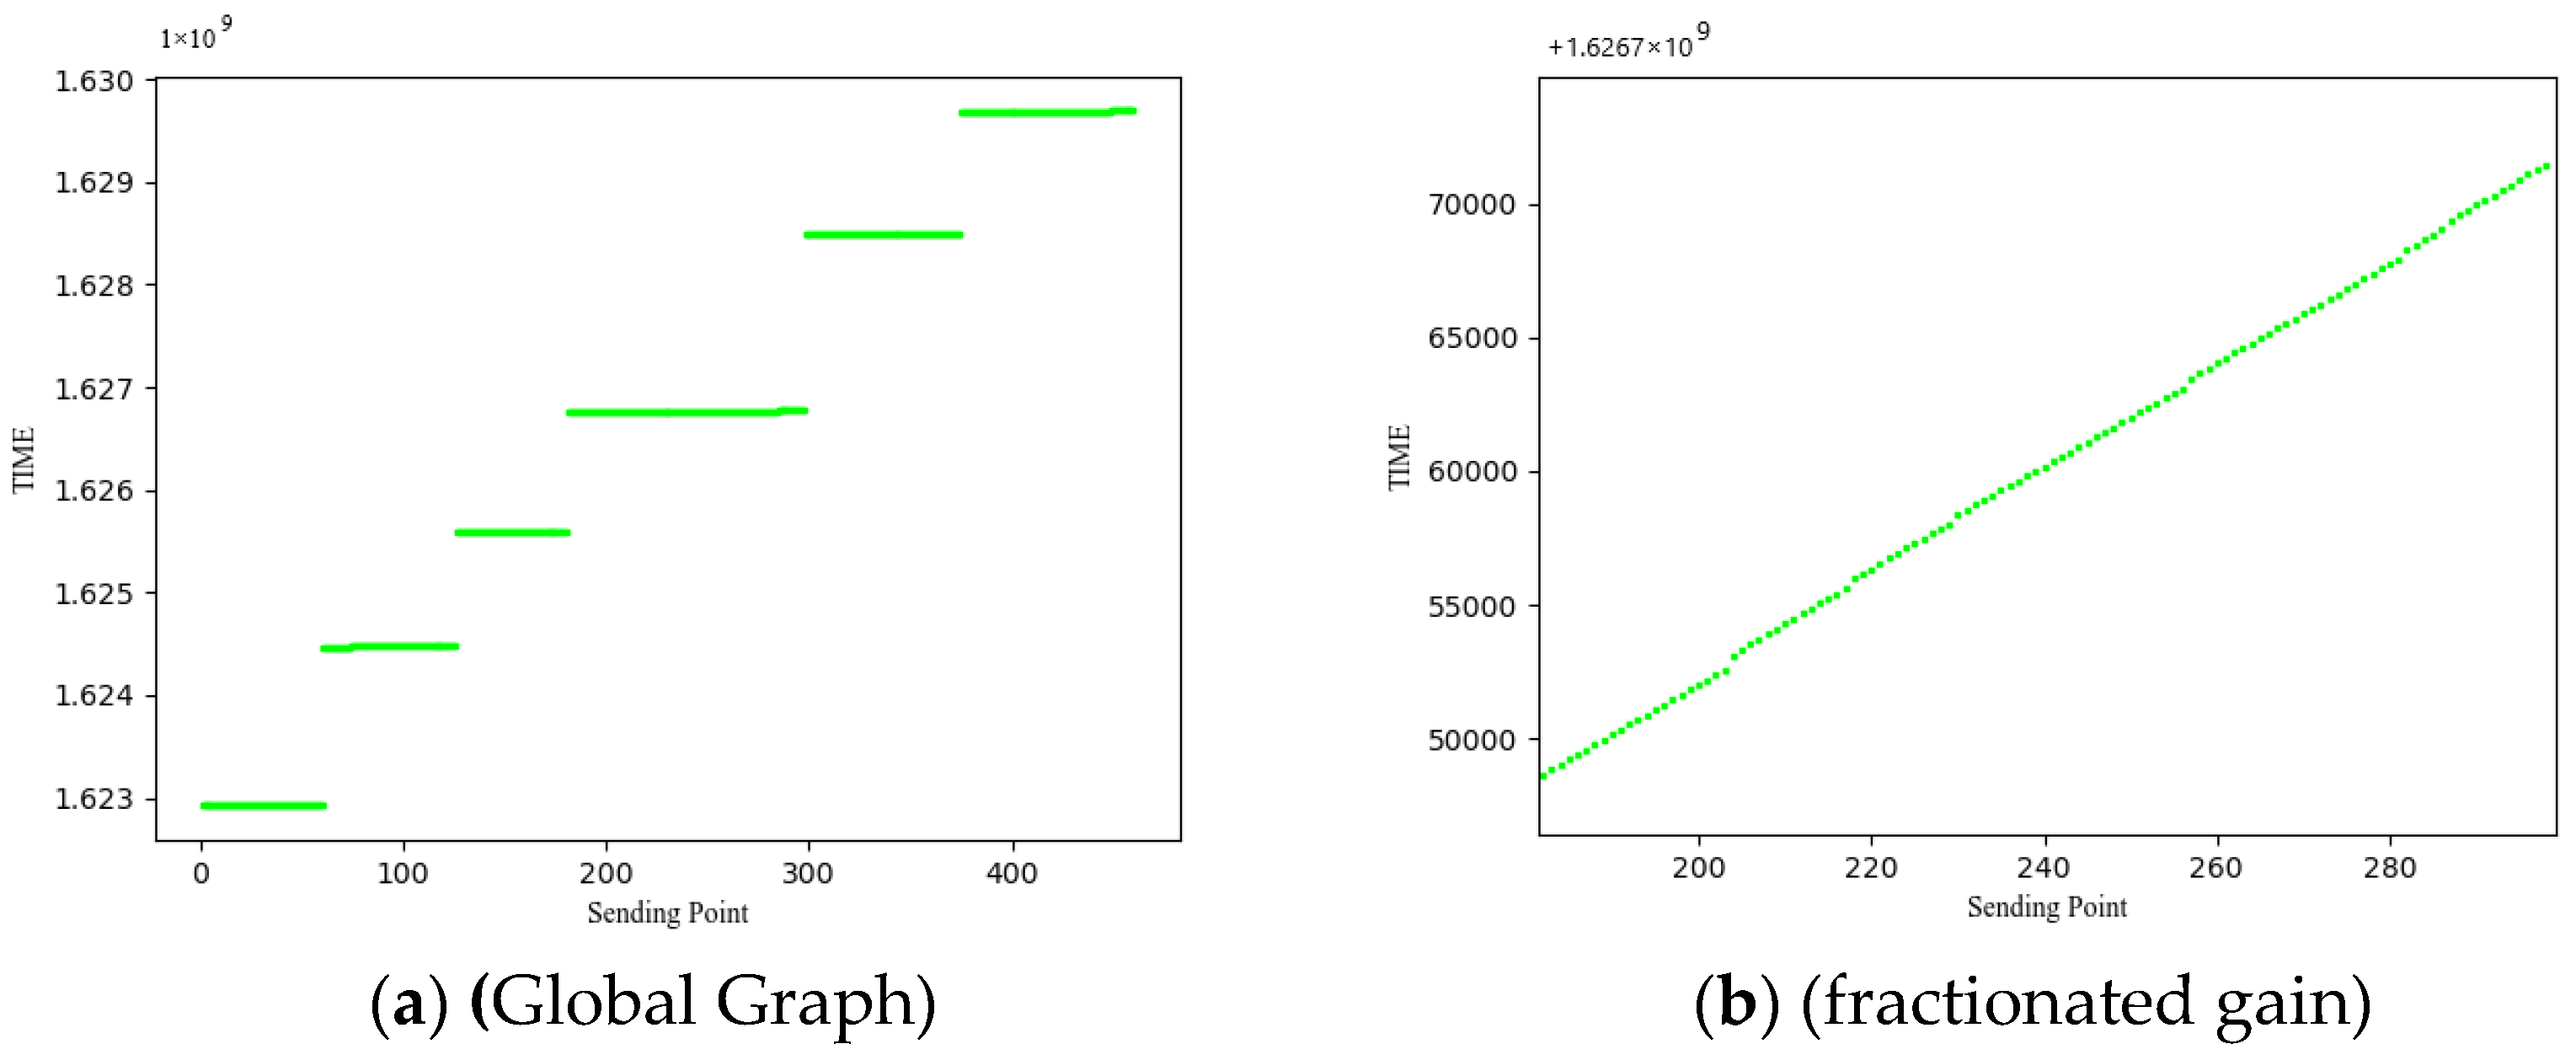
Eliminate input vectors that are outside the bounds of the waterway based on location coordinates. Remove input vectors with zero velocity information. The time interval of AIS transmission varies with the ship speed and rudder speed. Generally, the transmission interval of inland ships is 30 s. In order to improve the data quality, data with a time interval greater than 300 s are defined as belonging to different tracks, numbered according to the track, and track bars with fewer track points than the normal number are deleted. As can be seen from Figure 1 and Figure 2 below, the speed of ships normally sailing in the Wuhan river section is basically distributed within 2 kn to 10 kn. It can be seen from Figure 1 that the heading distribution is clearly classified, the sailing distribution of upward ships is 200 degrees to 250 degrees, and the heading distribution of downward ships is 30 degrees to 70 degrees. For a complete track, the sending time should be continuous. As shown in Figure 2, the ship (MMSI = 413802216) has a total of six complete tracks within 3 months, and there is a large difference between different tracks. We select more real data for trajectory prediction. After preprocessing, we use the trajectory bar velocity distribution to delineate the reserved data. The mean value of the velocity set is 5.21, and the standard deviation is 2.39. This range is limited by , and this range represents the speed distribution of the normal sailing ships to the greatest extent, and the data beyond this speed range are eliminated. Data visualization (Speed, Time) is shown in Figure 1 and Figure 2.
The amount of data before and after processing is shown in Table 1.
3. Design of a Track Prediction Model Integrating Multi-Technology
There are many kinds of track prediction models. In essence, most similar AIS data are processed into track segments, and then input in time series, using track points to train the model, and by continuously updating model parameters, setting different model weights and thresholds can make the prediction effect reach the best value. However, the convergence speed of the conventional prediction model is relatively slow, and the adaptability of trajectory prediction for different waterways is poor, and it cannot quickly achieve the optimum in the new scene. This paper proposes a track prediction model based on the multi-technology fusion of a genetic algorithm, an ant colony algorithm and a BP neural network, which greatly improves the speed and accuracy of model training.
3.1. Design Idea
The main idea of the track prediction model in this paper is to choose a BP neural network as the main body of the prediction model, integrate the advantages of a genetic algorithm, an ant colony algorithm and a BP neural network, and design a hybrid ant colony genetic algorithm to optimize the BP neural network.
A BP neural network has strong non-linear mapping ability, and is especially suitable for solving problems with complex internal mechanisms. During training, the BP neural network can automatically extract the “reasonable rules” between the output and output data through learning, and adaptively memorize the learning content in the weights of the network. It has high self-learning and self-adaptive capabilities. The ship trajectory of the flight segment can achieve a good prediction effect. Therefore, this paper chooses a BP neural network as the main body of the prediction model.
However, at the same time, the BP neural network also has corresponding shortcomings. The BP neural network algorithm is essentially a gradient descent method. Because the objective function to be optimized is complex, it is easy to produce “oscillation” of the prediction results, that is, “zigzag situation”, which makes the network convergence speed slow; Strong dependence, high accuracy can be achieved for training and prediction between similar samples, but there is often a large deviation in ship trajectory prediction in different scenarios.
Aiming at the above shortcomings of a BP neural network, this paper designs a hybrid ant colony genetic algorithm to optimize the BP neural network. An ant colony algorithm (ACO) has good adaptability and superior local search ability, and can still achieve relatively accurate solution results for different samples with large differences. In the process of solving, it is too time-consuming to form the optimal pheromone. A genetic algorithm (GA) has good convergence and good global search ability, but its local search ability is limited, because it cannot use the feedback information in the system, resulting in multiple redundant iterations.
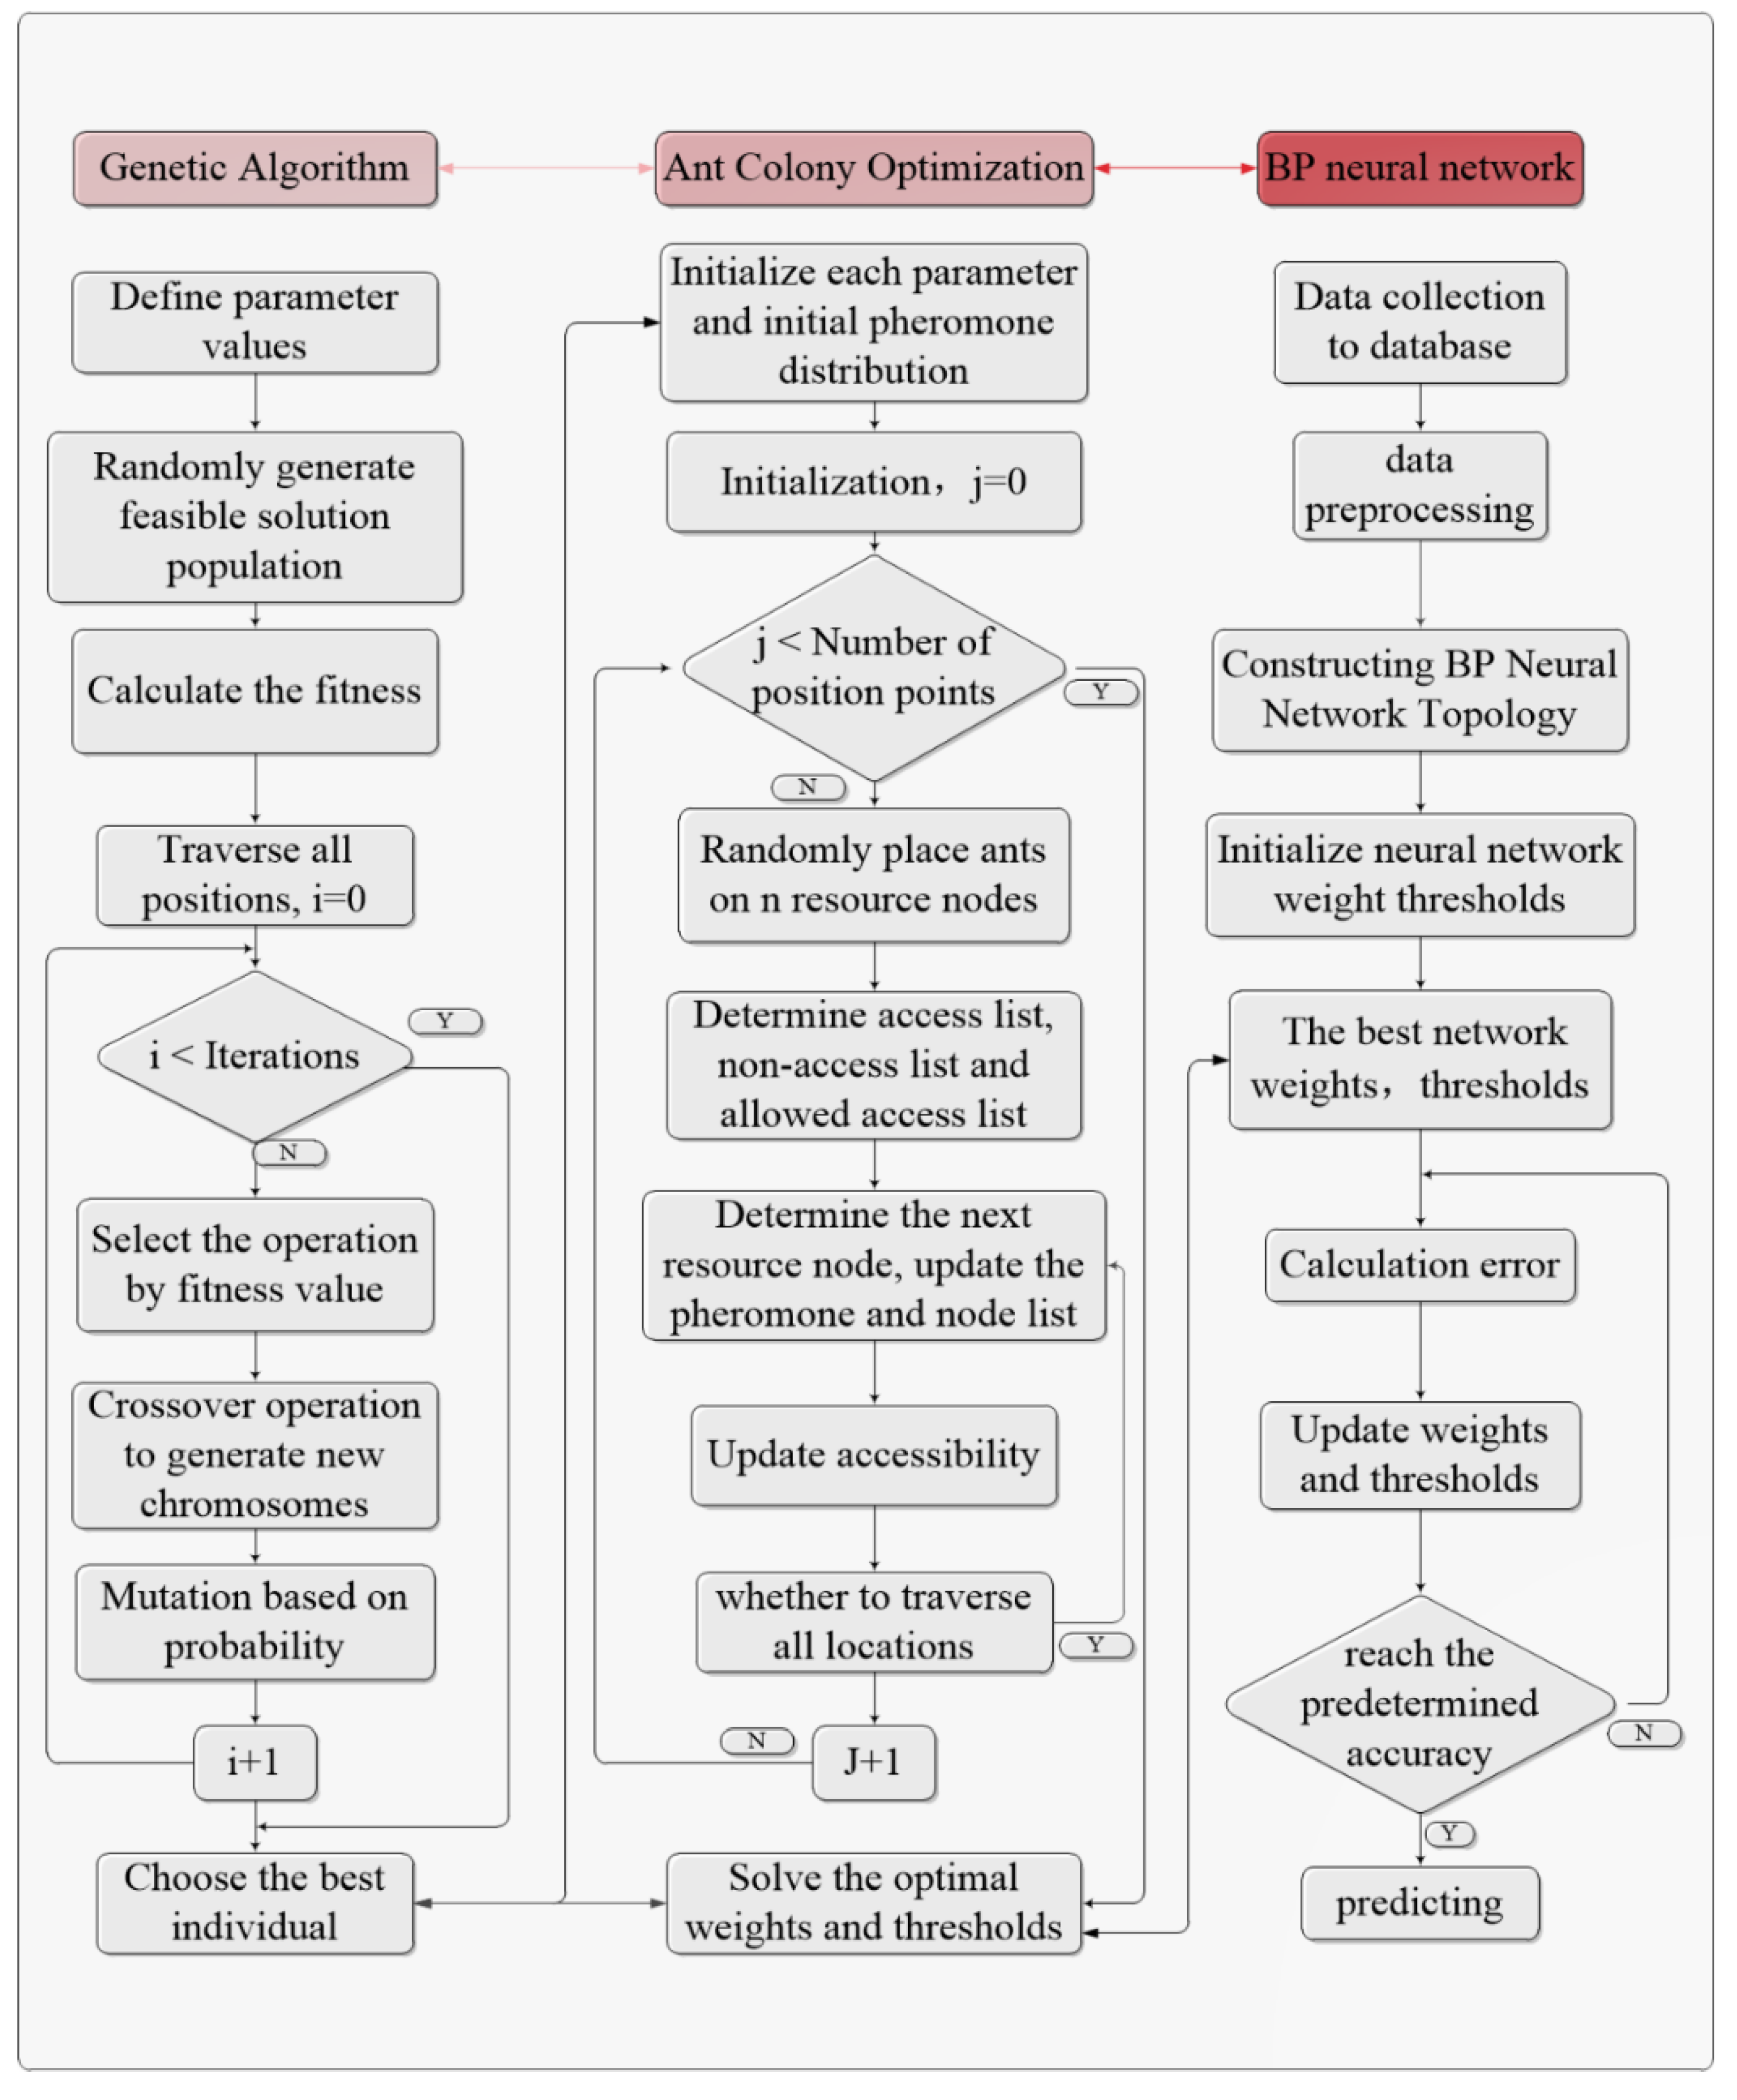
This part focuses on the research on the superior complementarity between a genetic algorithm and an ant colony algorithm, and constructs a hybrid ant colony genetic algorithm. In the early stage of the ant colony algorithm search, based on the crossover variation factor of a genetic algorithm, the setting method of pheromone concentration was improved, the initial distribution of pheromone was accelerated, and the global search ability of a traditional ant colony algorithm was enhanced. The powerful local search ability improves the convergence speed of a traditional genetic algorithm. The GA-ACO-BP neural network prediction model is shown in Figure 3.
3.2. The GA–ACO–BP Hybrid Algorithm
The GA–ACO–BP hybrid algorithm is to integrate the advantages of a genetic algorithm, ant colony optimization and BP neural network technology, design a hybrid genetic–ant colony algorithm, and introduce and optimize the BP neural network.
3.2.1. The BP Neural Network
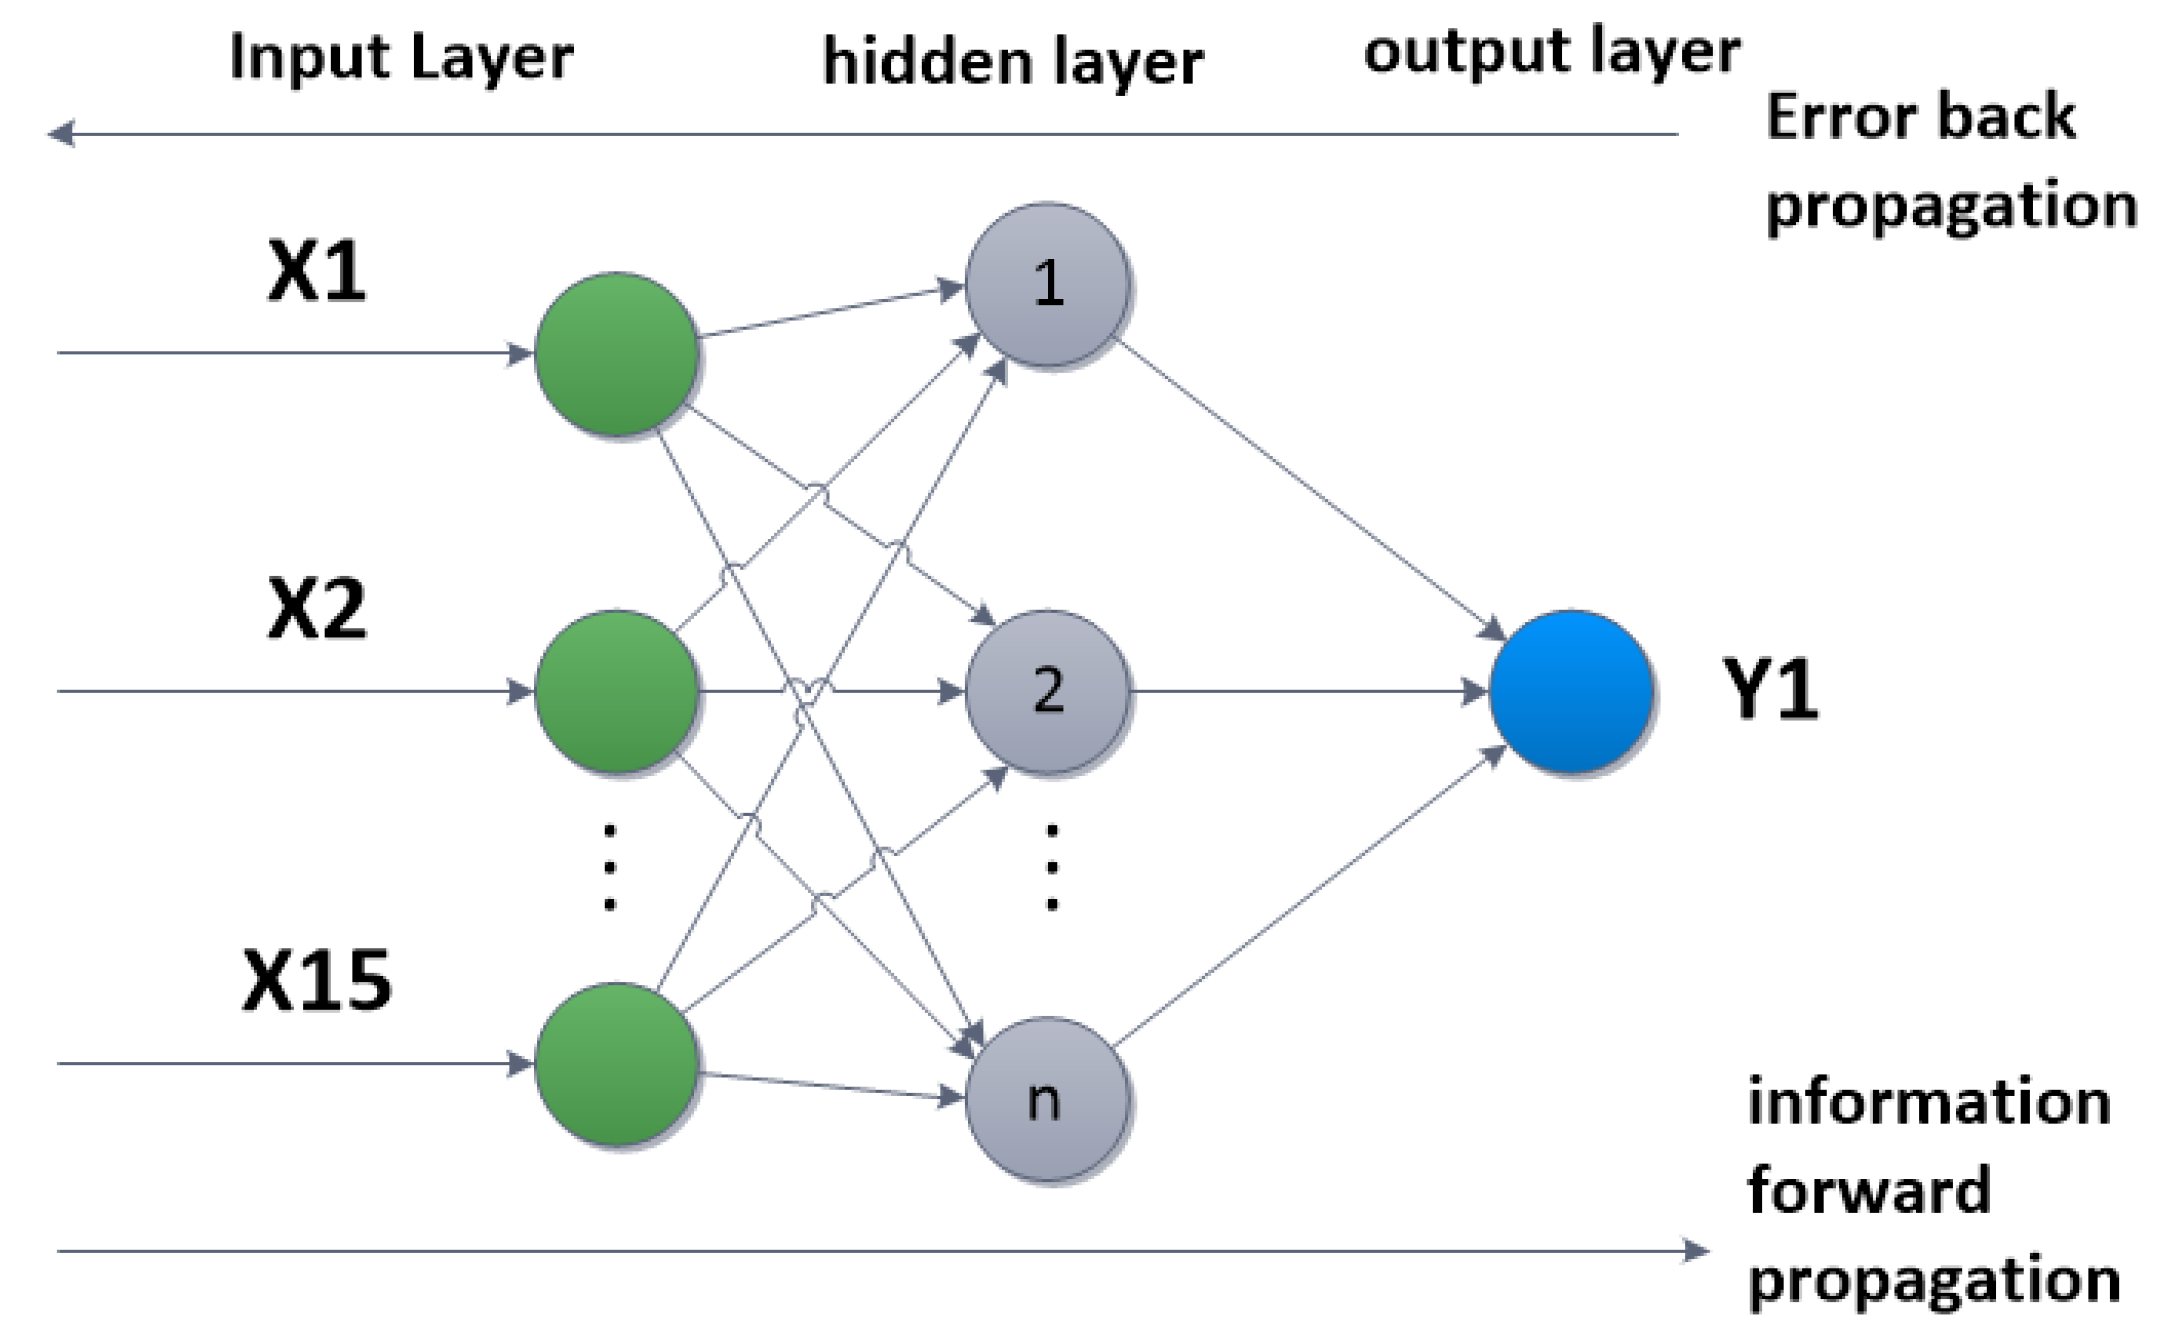
A BP neural network is a multi-layer feedforward neural network trained according to the error back propagation algorithm. Among all neural network models, the BP neural network algorithm is among the most successful and widely used neural network models. In the process of BP neural network training, the error is compared between the results of each training and the actual results, and then feedback to the middle layer to modify the weights and thresholds, step by step to approach the desired prediction results, which is the core of the BP neural network.
A BP neural network consists of an input layer, a hidden layer, and an output layer. given training set , Among them, means input training samples of d indicators, means input one-dimensional test samples, compare the error ‘e’ between the actual results and , and feed it back to the middle layer for error correction. The topology of BP neural network is shown in Figure 4.
Specific steps are as follows:
Step 1. Initialize the network, input the training set and the test set, and determine the input dimension () and the output dimension (). Initialize the weights V and W between neurons in the input layer, the hidden layer, and the output layer, initialize the output threshold of the hidden layer, and set the learning rate and activation function. The number of nodes in the initial hidden layer is obtained by the empirical formula, and the empirical formula is as follows:
Step 2. Calculate the hidden layer output and the output layer output:
where represents the input variable, , represents the connection weight between the input layer and the hidden layer and the threshold of the hidden layer, the output of the hidden layer is , is the number of nodes in the hidden layer and the number of nodes in the output layer, and f is the hidden layer. Layer activation function; , are connection weights and thresholds, respectively.
Step 3. The calculation of the error, e, is:
is the predicted value and is the actual expected value.
Step 4. Update the weights and thresholds, and update the network connection weights through the prediction error e.
where is the learning rate, and then judge whether the iteration has reached the expected value, if not, return to step 2 and cycle again until the training effect reaches the desired effect.
3.2.2. Ant Colony Optimization
Compared with other heuristic algorithms, an ant colony algorithm has strong robustness in solving performance (the basic ant colony algorithm model can be applied to other problems after a little modification) and the ability to search for better solutions, and it can also be well integrated with a genetic algorithm. At the same time, the inland waterway is changeable, the navigation situation of ships is complex, the navigation habits of each waterway are different, and the data characteristics of different regions are different. Therefore, an optimization algorithm that can adapt to various conditions and is sensitive to a small amount of data is needed. Ant colony optimization is a probabilistic algorithm used to find optimization paths. It has the characteristics of distributed calculation, positive feedback of information and heuristic search. It is essentially a heuristic global optimization algorithm in evolutionary algorithms. The general process of the ant colony algorithm is as follows:
Step 1. Initialization. Initialize pheromone and heuristic information; determine initial values of parameters such as population size M, pheromone volatilization coefficient, transition probability constant, and total amount of information released. The optimization in an ant colony algorithm usually takes a lot of time, and by calling the genetic algorithm to select the optimal individual to optimize the distribution of initial pheromone, the speed of ant colony optimization can be greatly accelerated.
Step 2. State transition. In order to avoid too much residual pheromone and drown out the heuristic information, after each ant completes one step or completes the traversal cycle of all positions, the residual information is updated. Therefore, the amount of information on the path () at time can be adjusted according to the following rules:
Among them, is the initialization parameter, is the random value in the [0, 1] interval; is the pheromone concentration on the path () at time t; is the information heuristic factor, representing the guidance of the amount of pheromone for the ants to choose the route role; is the expected heuristic factor, the ant decision is influenced by the path distance information; is the heuristic function. When , pseudo-random proportional selection is used, as follows:
Meaning of parameters in the formula:
: The position point that the ant has not visited yet is the position point that can be traversed next; S: the probability of the ant moving from position to position t at time ; S: temporary A location in the set of unvisited location points; the larger the value of, the greater the probability of going to location (but the actual location in the model is not necessarily the point with the highest probability). For , it means that the location If point n has been visited, the probability of being selected is 0;
The initial ant is randomly in a city, then the set has (n − 1) elements; then the ant goes to the next position according to (n − 1) non-zero probability
values. At this point, the set has (n − 2) elements, and continues to calculate the next target position…, until the set is empty and the ants have traversed all
positions.
Step 3. Fitness calculation. The fitness function is established according to the track prediction problem, and the fitness of each individual is calculated to obtain the current solution. In this paper, the ship track is predicted by the ship dynamic data in the AIS data. Here, we use the mean square error of the track training set and the test set as the fitness function. When the difference between the predicted value and the actual value is the smallest, the fitness function should be the minimum value, indicating that the more accurate the training, the higher the prediction accuracy.
is the individual fitness value, is the true value, is the predicted value.
In the process of optimization, ants will achieve some solutions of poor quality, which will leave pheromones on the path. These pheromones will induce the ants to choose this path, causing them to waste time searching for high-quality solutions. In order to avoid this problem as much as possible, a value needs to be selected as the quality of the solution. If the fitness value is greater than the given value, the high-quality solution is left, and pheromone is generated on the ant search path. If the fitness value is less than the given value set value, it will be eliminated. In this paper, the average value of the fitness values corresponding to all ant search paths in each cycle is used as the judgment condition, as shown in the following formula. The search path of each ant is recorded, and the solution with the best fitness value is left.
Among them, is the average value of the fitness values corresponding to the paths traveled by all the ants, m is the number of ants, and is the fitness value corresponding to the path traveled by the i-th ant.
Step4 Update pheromone. After all the ants complete the path assignment, the path will be updated (pheromone update), and the pheromone on the path will be updated according to Formula (12).
In the formula, represents the pheromone volatilization coefficient, represents the pheromone residual coefficient, represents the total amount of pheromone left by all ants from position to , as shown in Equation (13).
In the formula, represents the amount of pheromone left by ant when it walks the path , which can be calculated by Formula (14):
In the formula, is the route distance traveled by ant , and is the total amount of pheromone.
Step 5. Save the path population obtained by the ant search, compare the weights and thresholds of the BP neural network obtained under all the path populations, and make predictions, respectively, to obtain the best network parameters.
3.2.3. The Genetic Algorithm
A genetic algorithm is designed and proposed according to the laws of biological evolution in nature. It is a computational model that simulates natural selection and genetic mechanism to simulate the accidental events of biological evolution. The general process of the genetic algorithm is as follows.
Step 1. Initialization: Set the maximum evolutionary algebra T, set the initial population size N, as the initial population .
Step 2. Fitness calculation. According to the problem to be solved, different fitness functions are formulated. The design of the fitness function will directly affect the performance of the genetic algorithm. In this model, the genetic algorithm and the ant colony algorithm use the mean square error of the predicted value of the BP neural network as the fitness function. The smaller the fitness value is, the more accurate the training is, and the fitness function is as follows.
is the th individual fitness value, is the th true value, is the th predicted value.
Step 3. Select operation: There are many methods for selection operation in a genetic algorithm, the common ones are roulette method, tournament method, etc. In this paper, the selection strategy of the roulette method is used to arrange the pheromone of the ants in ascending order, and the ants with low fitness are subjected to genetic selection and crossover operation, the hybridization probability ratio is 0.8, and the mutation probability ratio is 0.2. Then, the probability of each population stepping into the next link is inversely proportional to its corresponding fitness value, and the probability of an individual being selected is as follows.
In the formula, is the fitness value of individual , the smaller the fitness value in this paper, the better the training effect.
Step 4. Cross operation: Chromosomes according to the set probability . Perform the crossover operation to group the parent chromosomes into pairs. Assuming the two parent chromosomes are and , the algorithm automatically generates a random value r during the operation. If the value is smaller than the crossover probability , perform the crossover operation on the chromosome and , otherwise, do not implement.
The crossover works as follows:
Among them, are the chromosomes, is a random number between 0 and 1, and are the chromosomes that are regenerated after the parent chromosome is crossed.
Step 5. Mutation operation: The purpose of mutation is to increase the diversity of individuals. Chromosomes are mutated according to the set probability (0.2). The specific mutation method is as follows: the algorithm automatically generates a random value r during the operation process, and the value is set in advance with the value . A good mutation probability is compared, and if < , the mutation operation is performed, otherwise it is not performed. Mutation works as follows:
Among them, is the lower bound, and rand is a random number within 0–1.
3.3. The Track Prediction Model
This paper integrates the advantages of a genetic algorithm, an ant colony algorithm and a BP neural network to construct an optimized track prediction model. This model achieves the expected prediction effect through the training of the ship’s AIS data. The single-step prediction method is adopted in the network training process, and the behavior state of the ship in the future time is generated based on the behavior of the current time. Therefore, this paper uses the behavior state of the ship at a short historical moment to predict the future position of the ship, and takes the ship sailing at t − 2, t − 1 and t as the data and are input to the network, and the dynamic data of the ship at time t + 1 is used as the output, and the longitude (), latitude (), and speed () of the ship are output, respectively. According to the mathematical expression in the training process of the BP neural network, the expression of the ship track prediction model is as follows:
This paper selects the ship’s longitude (), latitude (), course (), speed (), AIS signaling time difference (), ship acceleration () and ship rudder effect () as the feature input , each The index selects the values at three historical moments; the output index is the longitude, latitude and speed of the ship, which is output separately, and a single index is output during each test. Then, the optimal weights and thresholds of the BP neural network are optimized by the hybrid genetic–ant colony algorithm.
The flow chart of the prediction model of the BP neural network optimization based on the hybrid genetic–ant colony algorithm is shown in Figure 3. First initialize the number of neurons in the BP neural network, the connection weight and threshold of the neural network, and then each ant constructs a solution space from all hidden layer nodes. When the ant selects a node, it is selected from the weight and threshold set of the previous layer an element, if no, switch to the next node. Combine the ant colony algorithm rules and the advantages of the genetic algorithm to update the pheromone. The ant colony algorithm adds the genetic algorithm crossover operator and mutation operator to reconstruct the fitness value of the individuals to be crossed. Gaussian mutation is used in the mutation process, and the gene sequence is replaced with a normal random number to calculate the fitness value, and then calculate whether it reaches the predetermined value. If it is, the optimal solution will be passed to the BP neural network training; otherwise, return to the loop to traverse again, clear the path record, and construct the solution space again until the algorithm accuracy meets the predetermined target. After that, the BP neural network is further trained to optimize the results, calculate the prediction error, and update the weights and thresholds.
4. Experimental Results and Analysis
The test environment adopts MATLAB2021a (MathWorks, America), MySQL8.0 (MySQL AB, Sverige), and adopts the data sets collected by local maritime collection points and the Wuhan section of the Yangtze River. After processing, a total of 571 ship trajectory segments and 180,647 ship AIS dynamic data strips are used. The time interval is within 3 min. The data during the experiment are described in Table 2. A total of 90% of the data in the ship track segment are used for the model, and 10% are used for the model test.
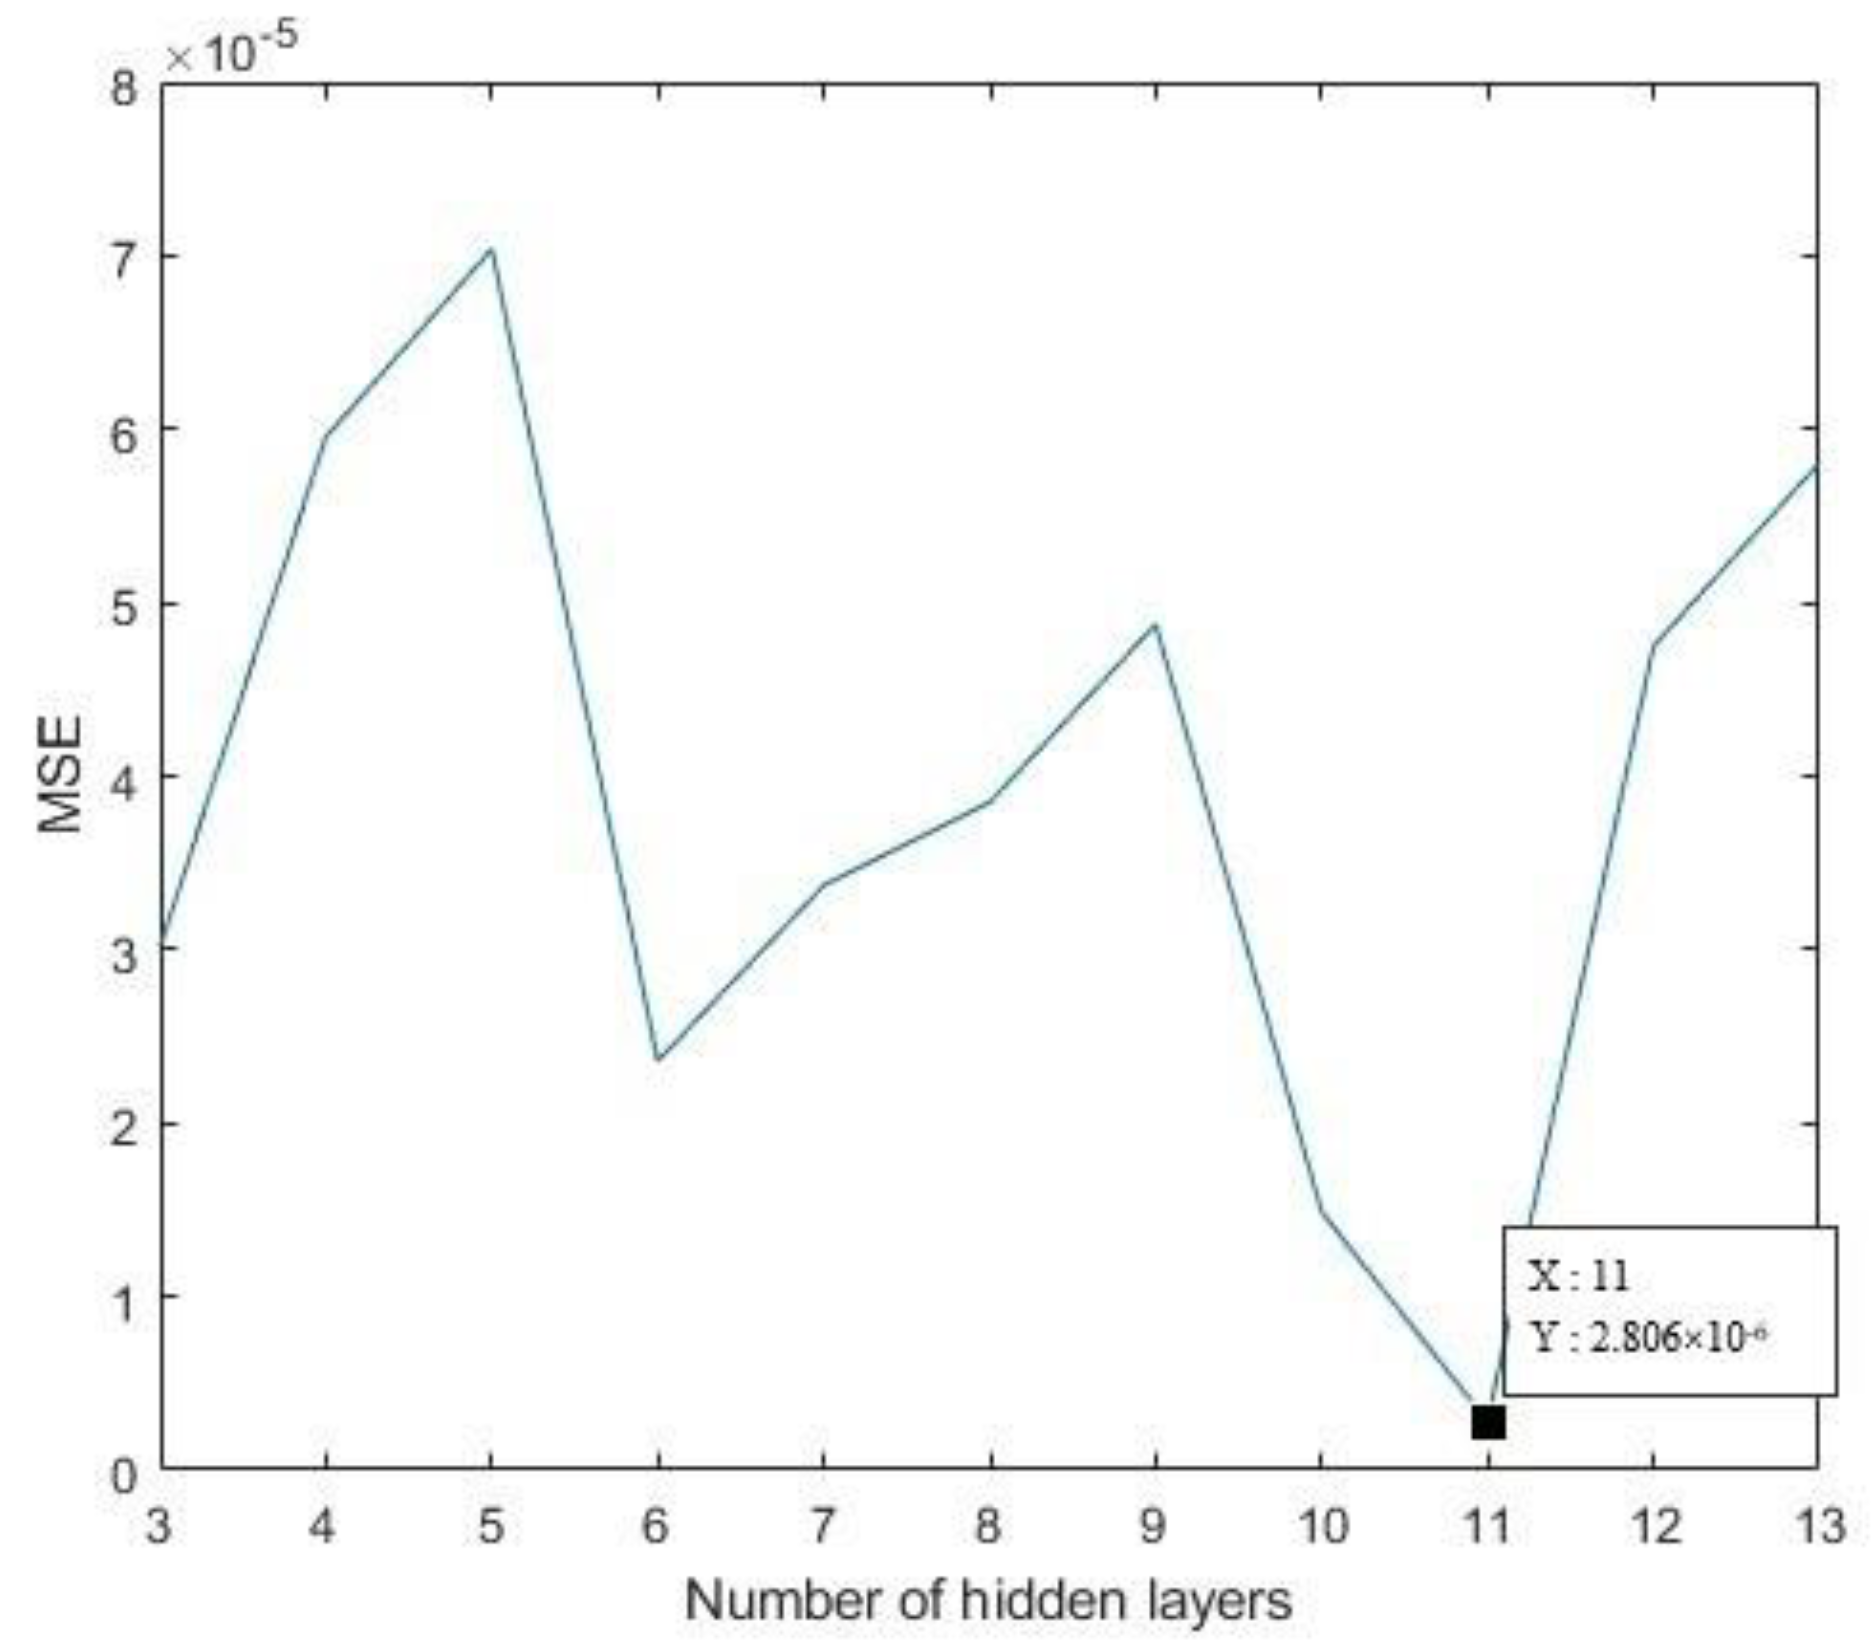
After the data are input, the normalization function is used to map the input index to [0, 1] to eliminate the adverse effects caused by singular sample data as much as possible, which can speed up the speed of gradient descent to find the optimal solution; The optimal value of each network parameter of neural network is obtained after many tests. The number of nodes in the hidden layer of the BP neural network is determined by the empirical formula and the comparison of the mean square error value. The mean square error of the neural network under the number of nodes in each hidden layer is shown in Figure 5.
In the process of experiment, we first analyze the influence content of each parameter of the genetic algorithm and the ant colony algorithm. The setting of each parameter is shown in Table 3.
The genetic algorithm is used to quickly find the initial pheromone concentration of ant colony, the population size should not be set too large, determining the initial pheromone is a simple problem, mainly considering the convergence speed of the algorithm. The crossover probability is set to 0.6, which means that the mutation probability is too small and the population diversity declines too fast, which easily leads to the rapid loss of effective genes and is not easy to repair, and the mutation probability is too large. Although the diversity of the population can be guaranteed, the probability of higher-order patterns being destroyed also increases. The second is an ant colony algorithm. Since the navigation habits of each ship are the same and the navigation trajectory of the local river section is relatively similar, it is considered to reduce the pheromone volatility coefficient to improve the convergence speed of the algorithm.
It can be seen from the above figure that when the number of hidden layer nodes is 11, the mean square error is at a minimum, which is 2.806 × 10⁻⁶, and the prediction error for the trajectory can reach 10 m. The mean square error MSE is used as a fitness function to judge the adaptability of the data and the model. The smaller the mean square error, the higher the model prediction accuracy, and the more accurate the network’s prediction of the ship’s trajectory. During the experiment, a single BP neural network model and a BP neural network model based on the genetic algorithm were selected. The performance of the GA–ACO optimization of the BP neural network model was illustrated by comparative experiments. During the experiment, the parameters of the BP neural network are set the same. The training times are 100 times and the learning rate is 1 × 10⁻³. The average value of the five training results is used as the final prediction value in the experiment.
4.1. Performance Indicators
According to the previous model building process, we have selected the root mean square error () to judge the adaptability of each model, and the mean absolute percentage error () is often used to reflect the error between the predicted result and the actual value. Therefore, the RMSE and the MAPE are used as experimental results. The evaluation index of, the calculation formula is:
In the formula, is the th predicted value; is the th real value; is the total number of predictions.
4.2. Analysis of Results
According to the prediction results, the errors of the three models are calculated as shown in Table 4. It can be seen from the table that the GA–ACO-optimized BP neural network model is 54.2% superior to the single BP neural network model, and 24.3% superior to the GA-optimized BP neural network model. %. When the prediction error of a single BP neural network reaches 1.4802 × 10⁻⁵, the prediction error of the GA-optimized BP neural network model is 5.2417 × 10⁻⁶, and the prediction error of the GA–ACO-optimized BP neural network model can reach 3.3217 × 10⁻⁶. Compared with the former, the performance is improved by 77.6% and 36.6%, respectively. For the LSTM neural network model, the performance of LSTM is better than the single BP neural network model. The prediction error of LSTM is roughly similar to that of the GA–BP neural network model, and the MAPE of LSTM is 8% less than that of the GA–BP neural network model. However, all the indexes are worse than GA–ACO–BP model. From the perspective of the most intuitive MSE, the GA–ACO–BP model is 31.62% superior to LSTM. In order to present the data more clearly, the forecasts for the longitude, latitude and speed of the ship are forecasted separately; only the first forty forecasts are visualized in the figure for best presentation.
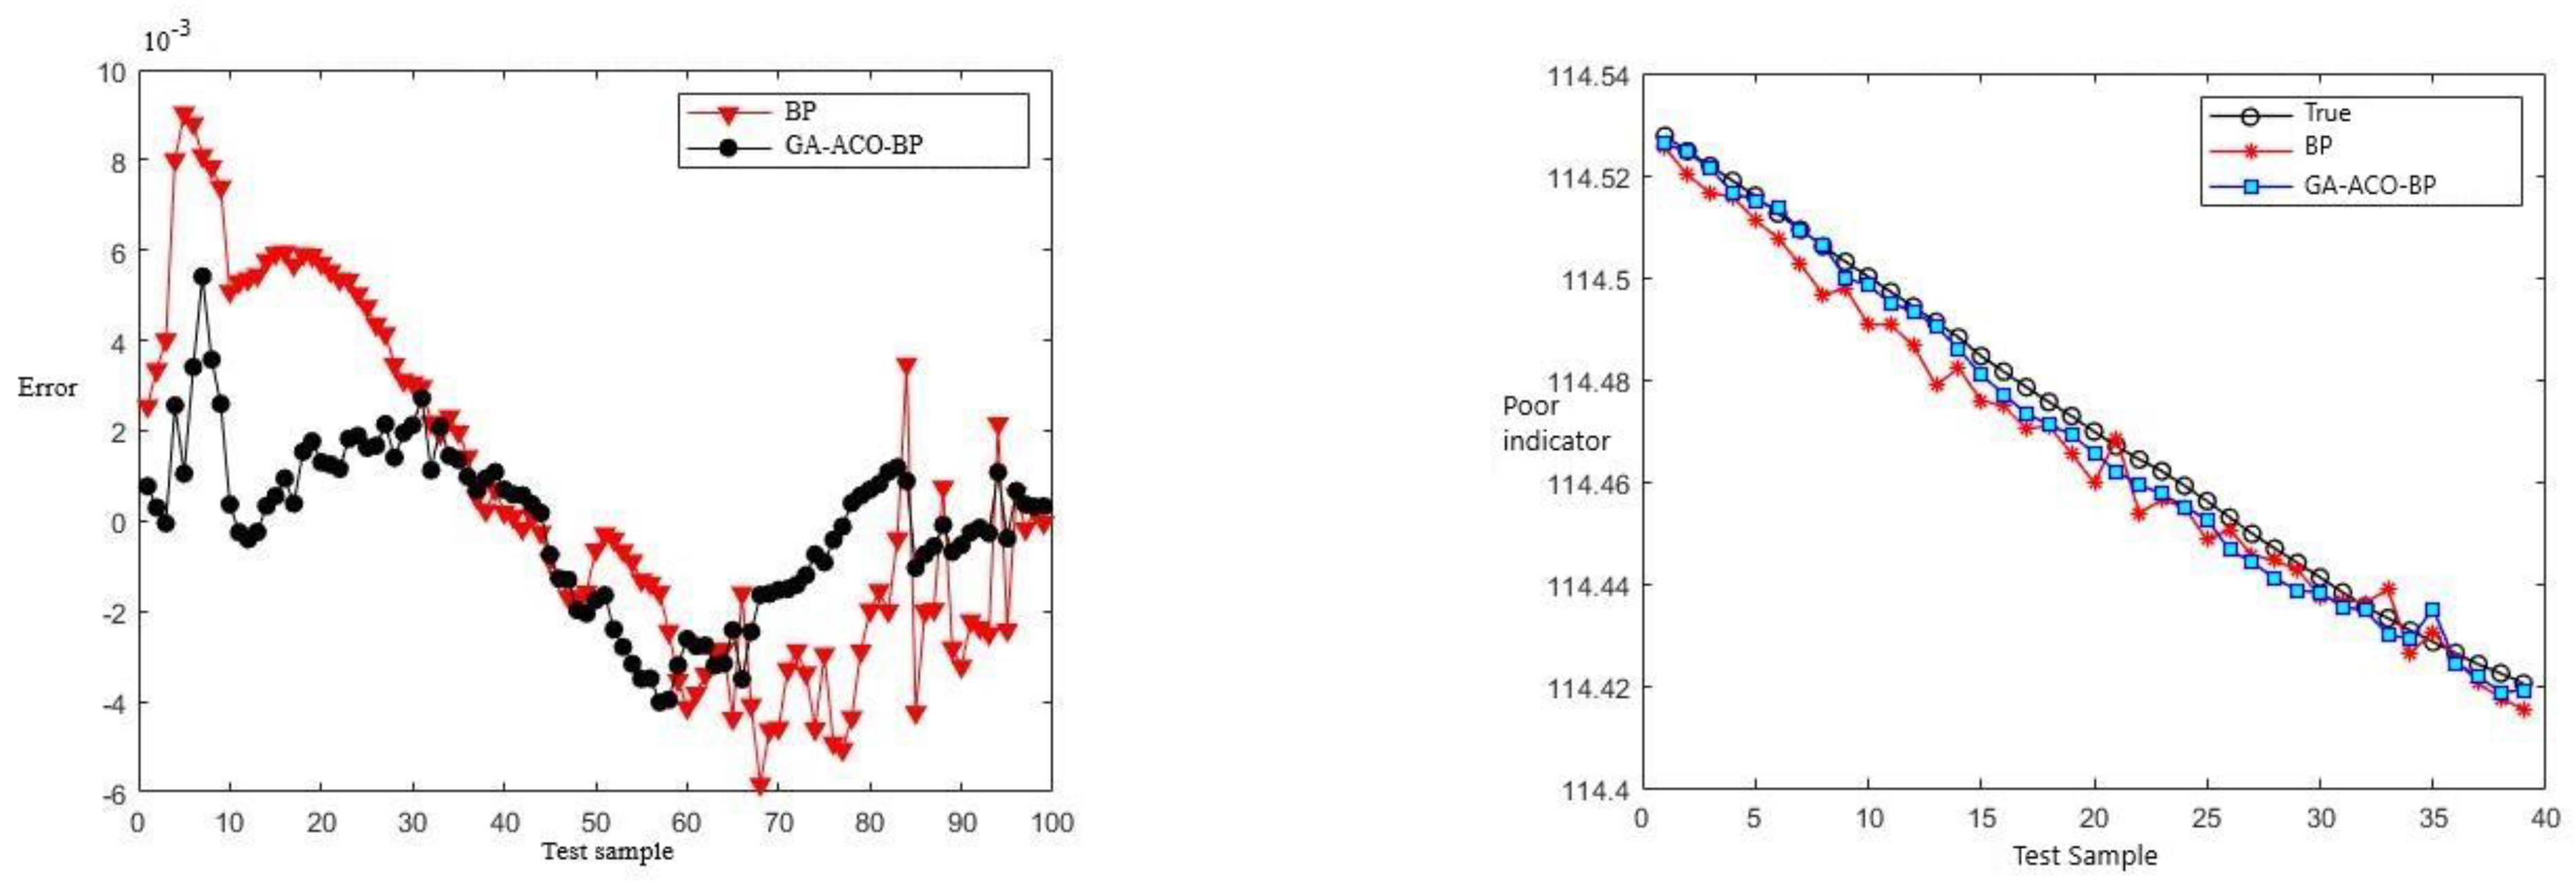
The longitude prediction effect is shown in the Figure 6 below.
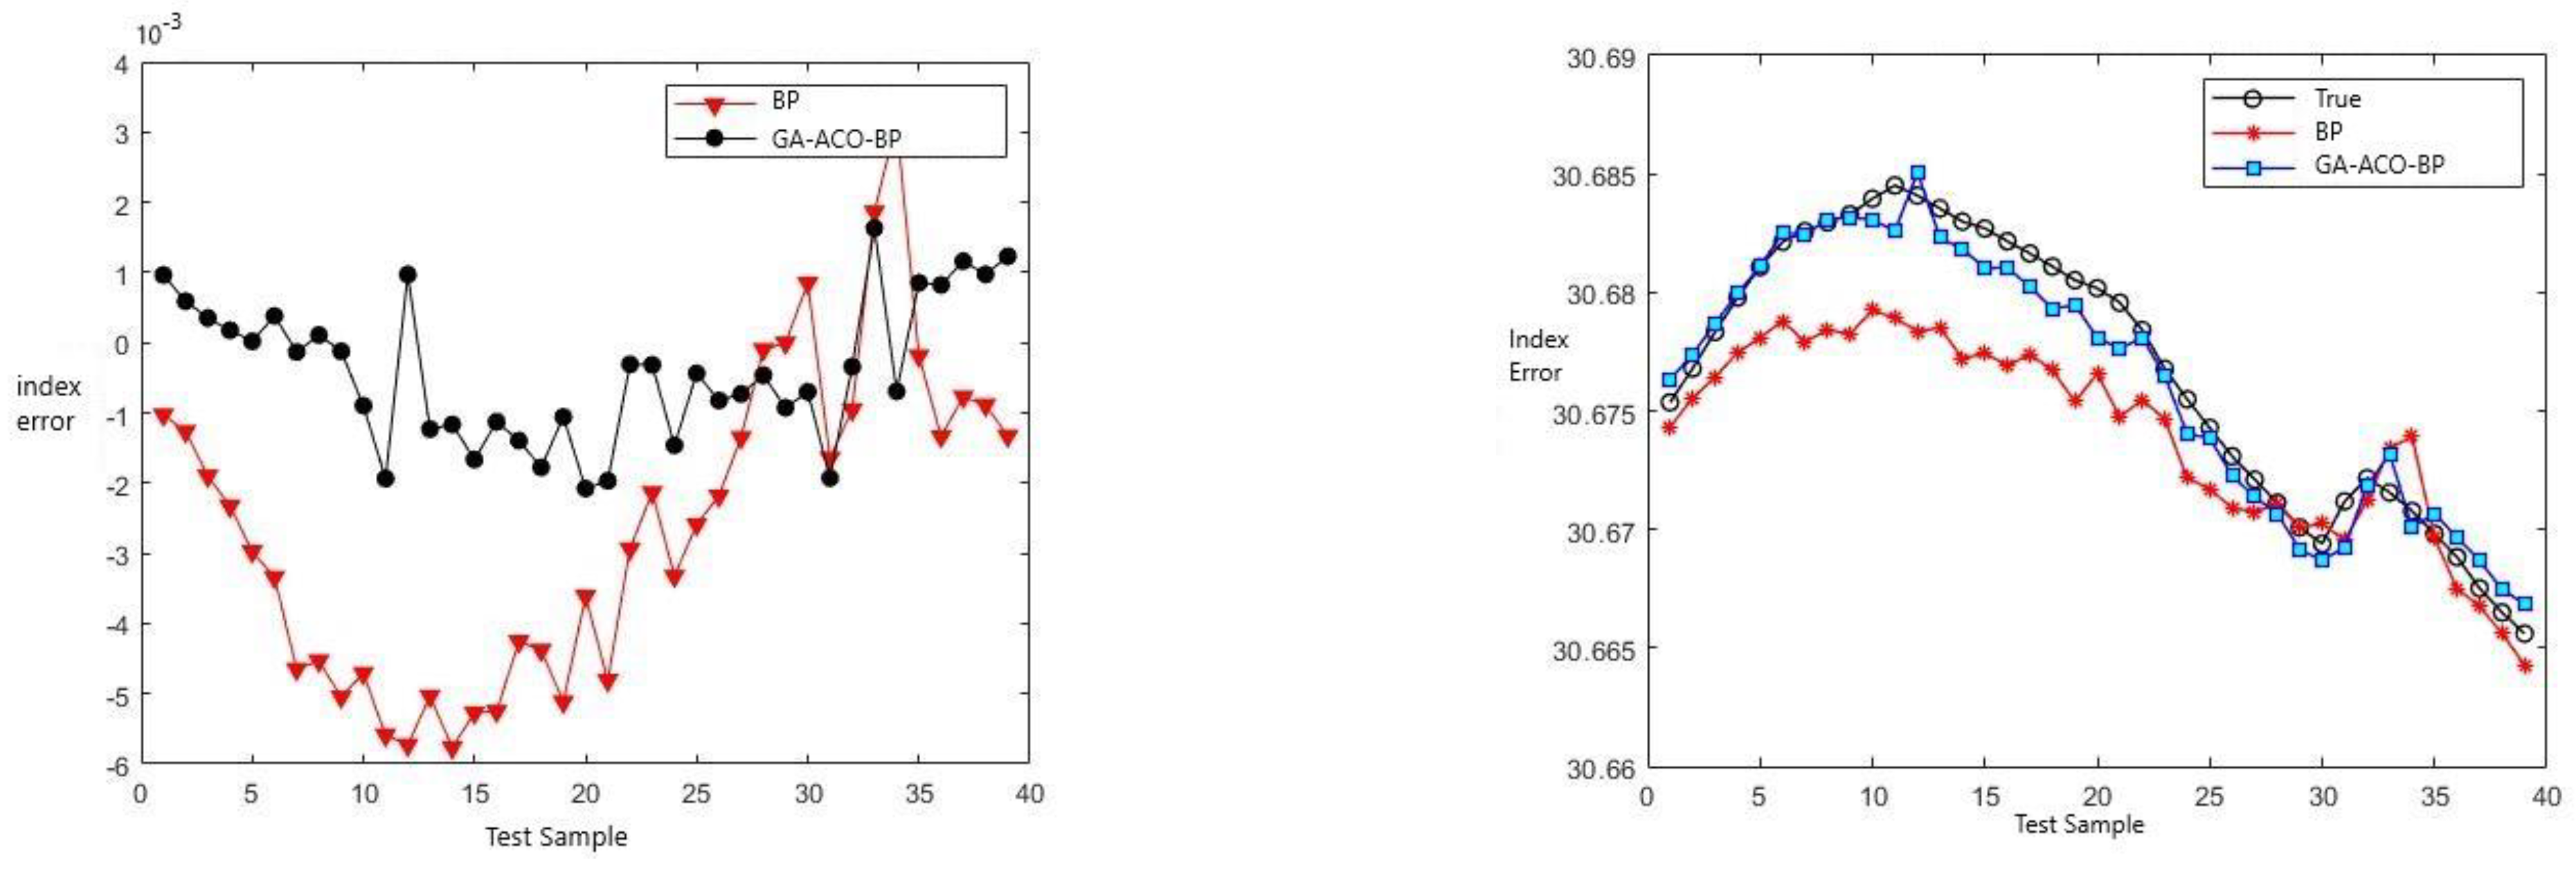
The ship latitude prediction effect is shown in the Figure 7 below.
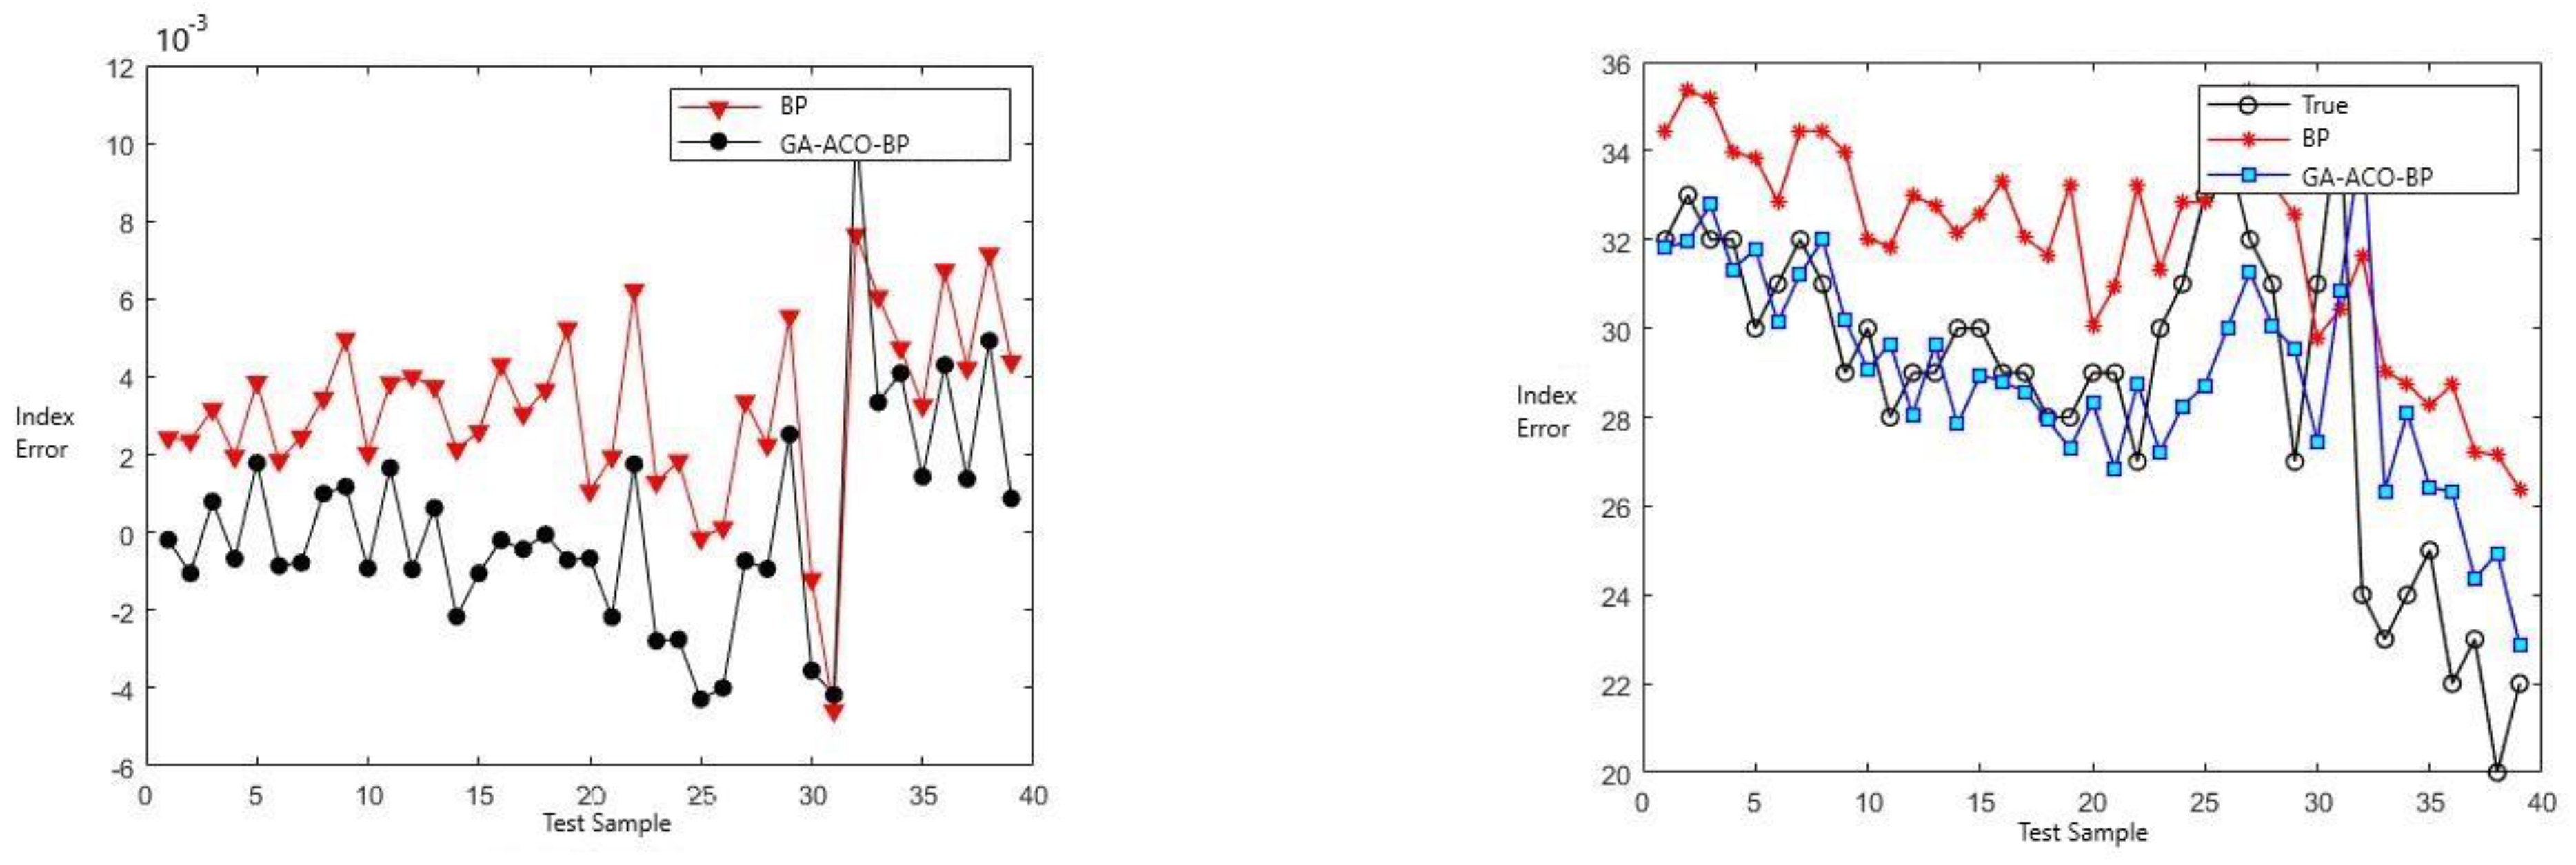
The mode’s effect on speed prediction is shown in the following Figure 8.
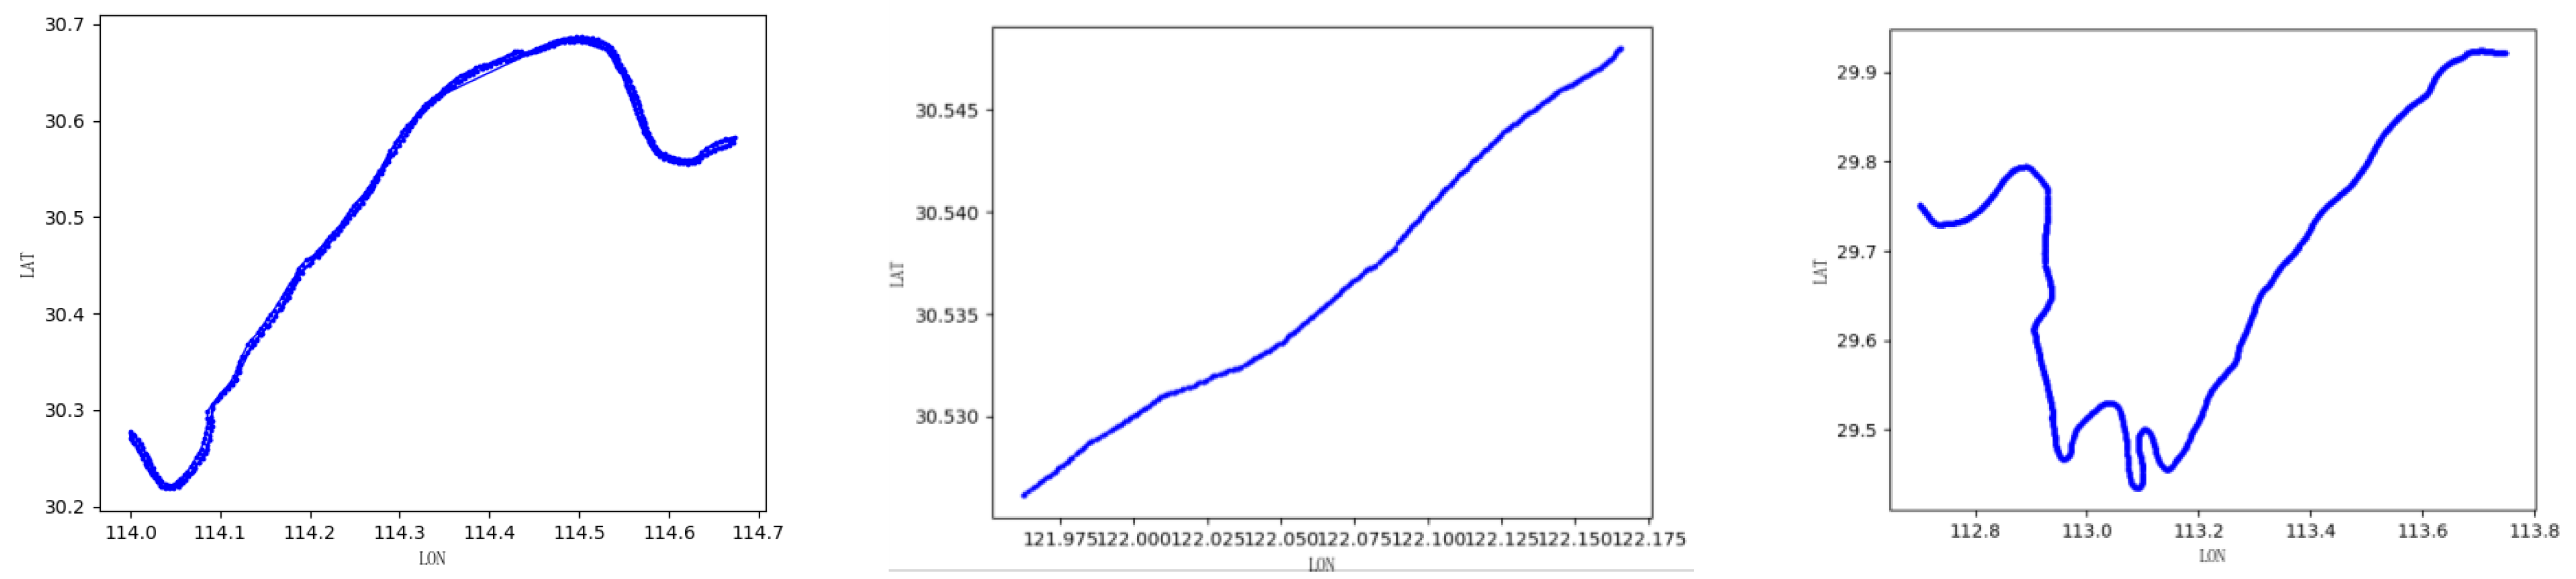
After data preprocessing, typical trajectories (linear channel and curved channel) are selected for experiments. This paper selects AIS data with MMSI values of 413774777 (WuHan), 413370860 (YangShan port) and 413798191 (YueYang) and compares the experiments with the (BP/GA–BP/ACO–BP/LSTM) model. The original trajectories of the ships are shown in Figure 9.
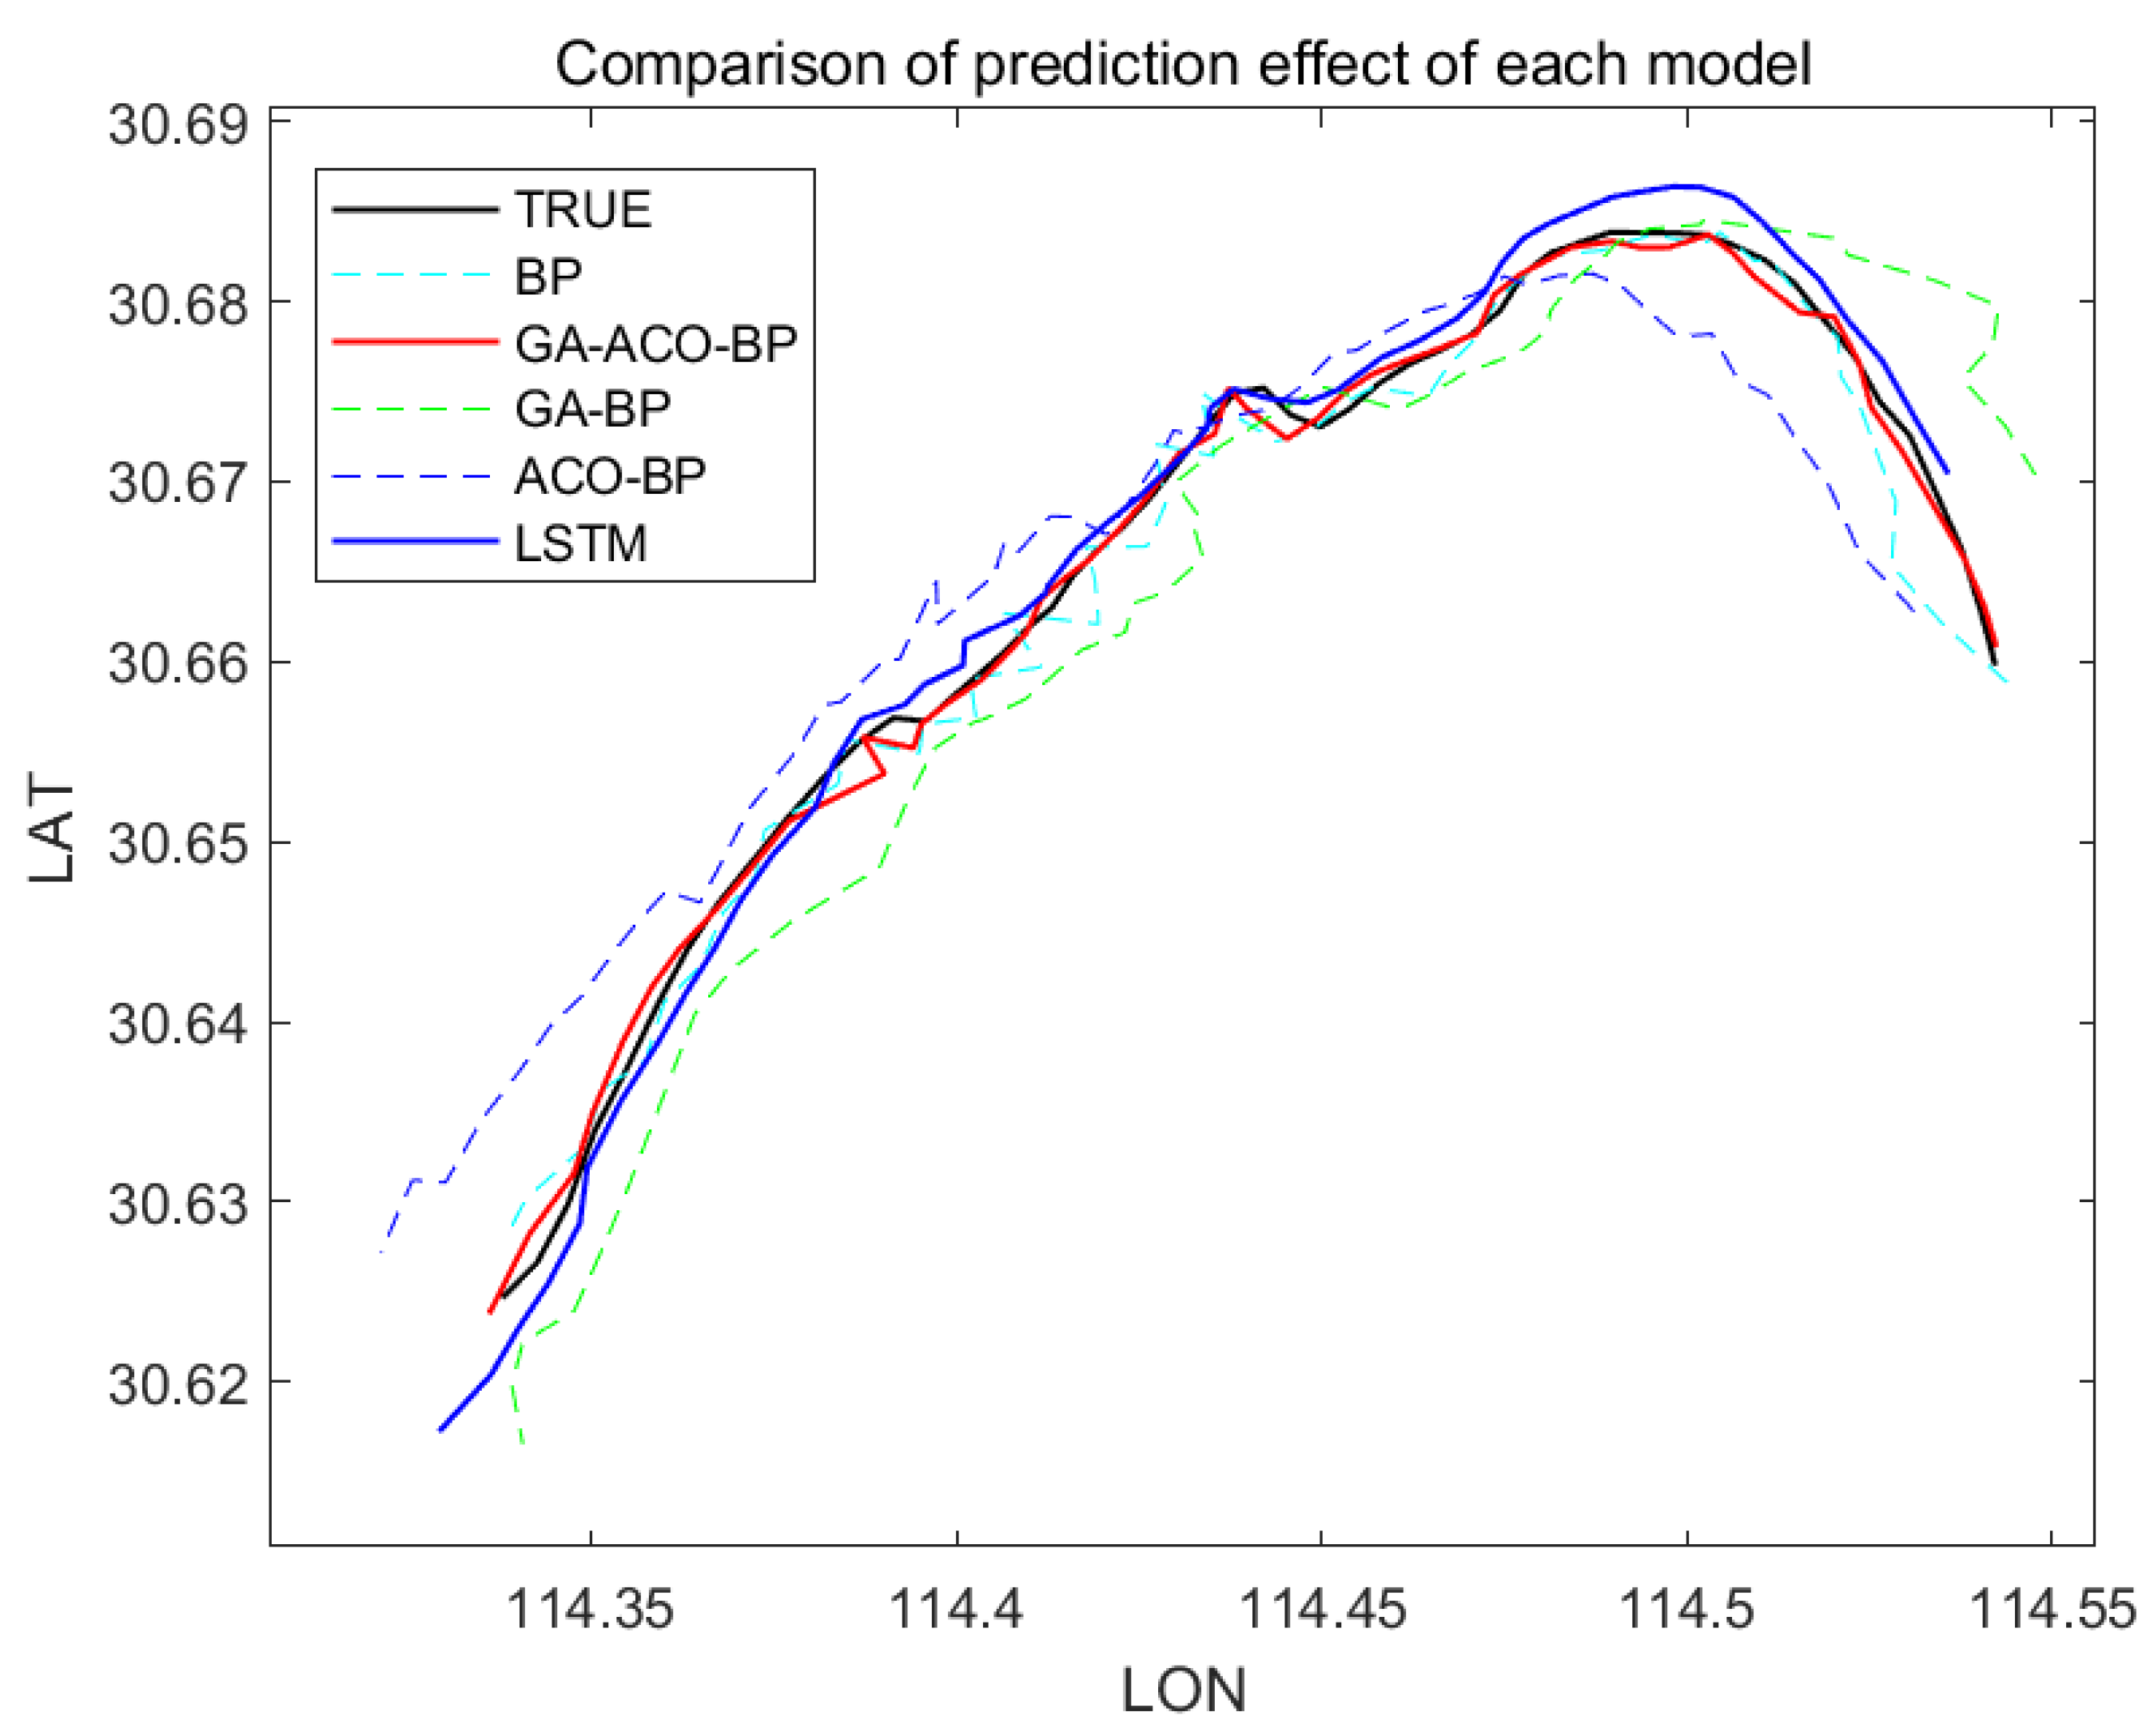
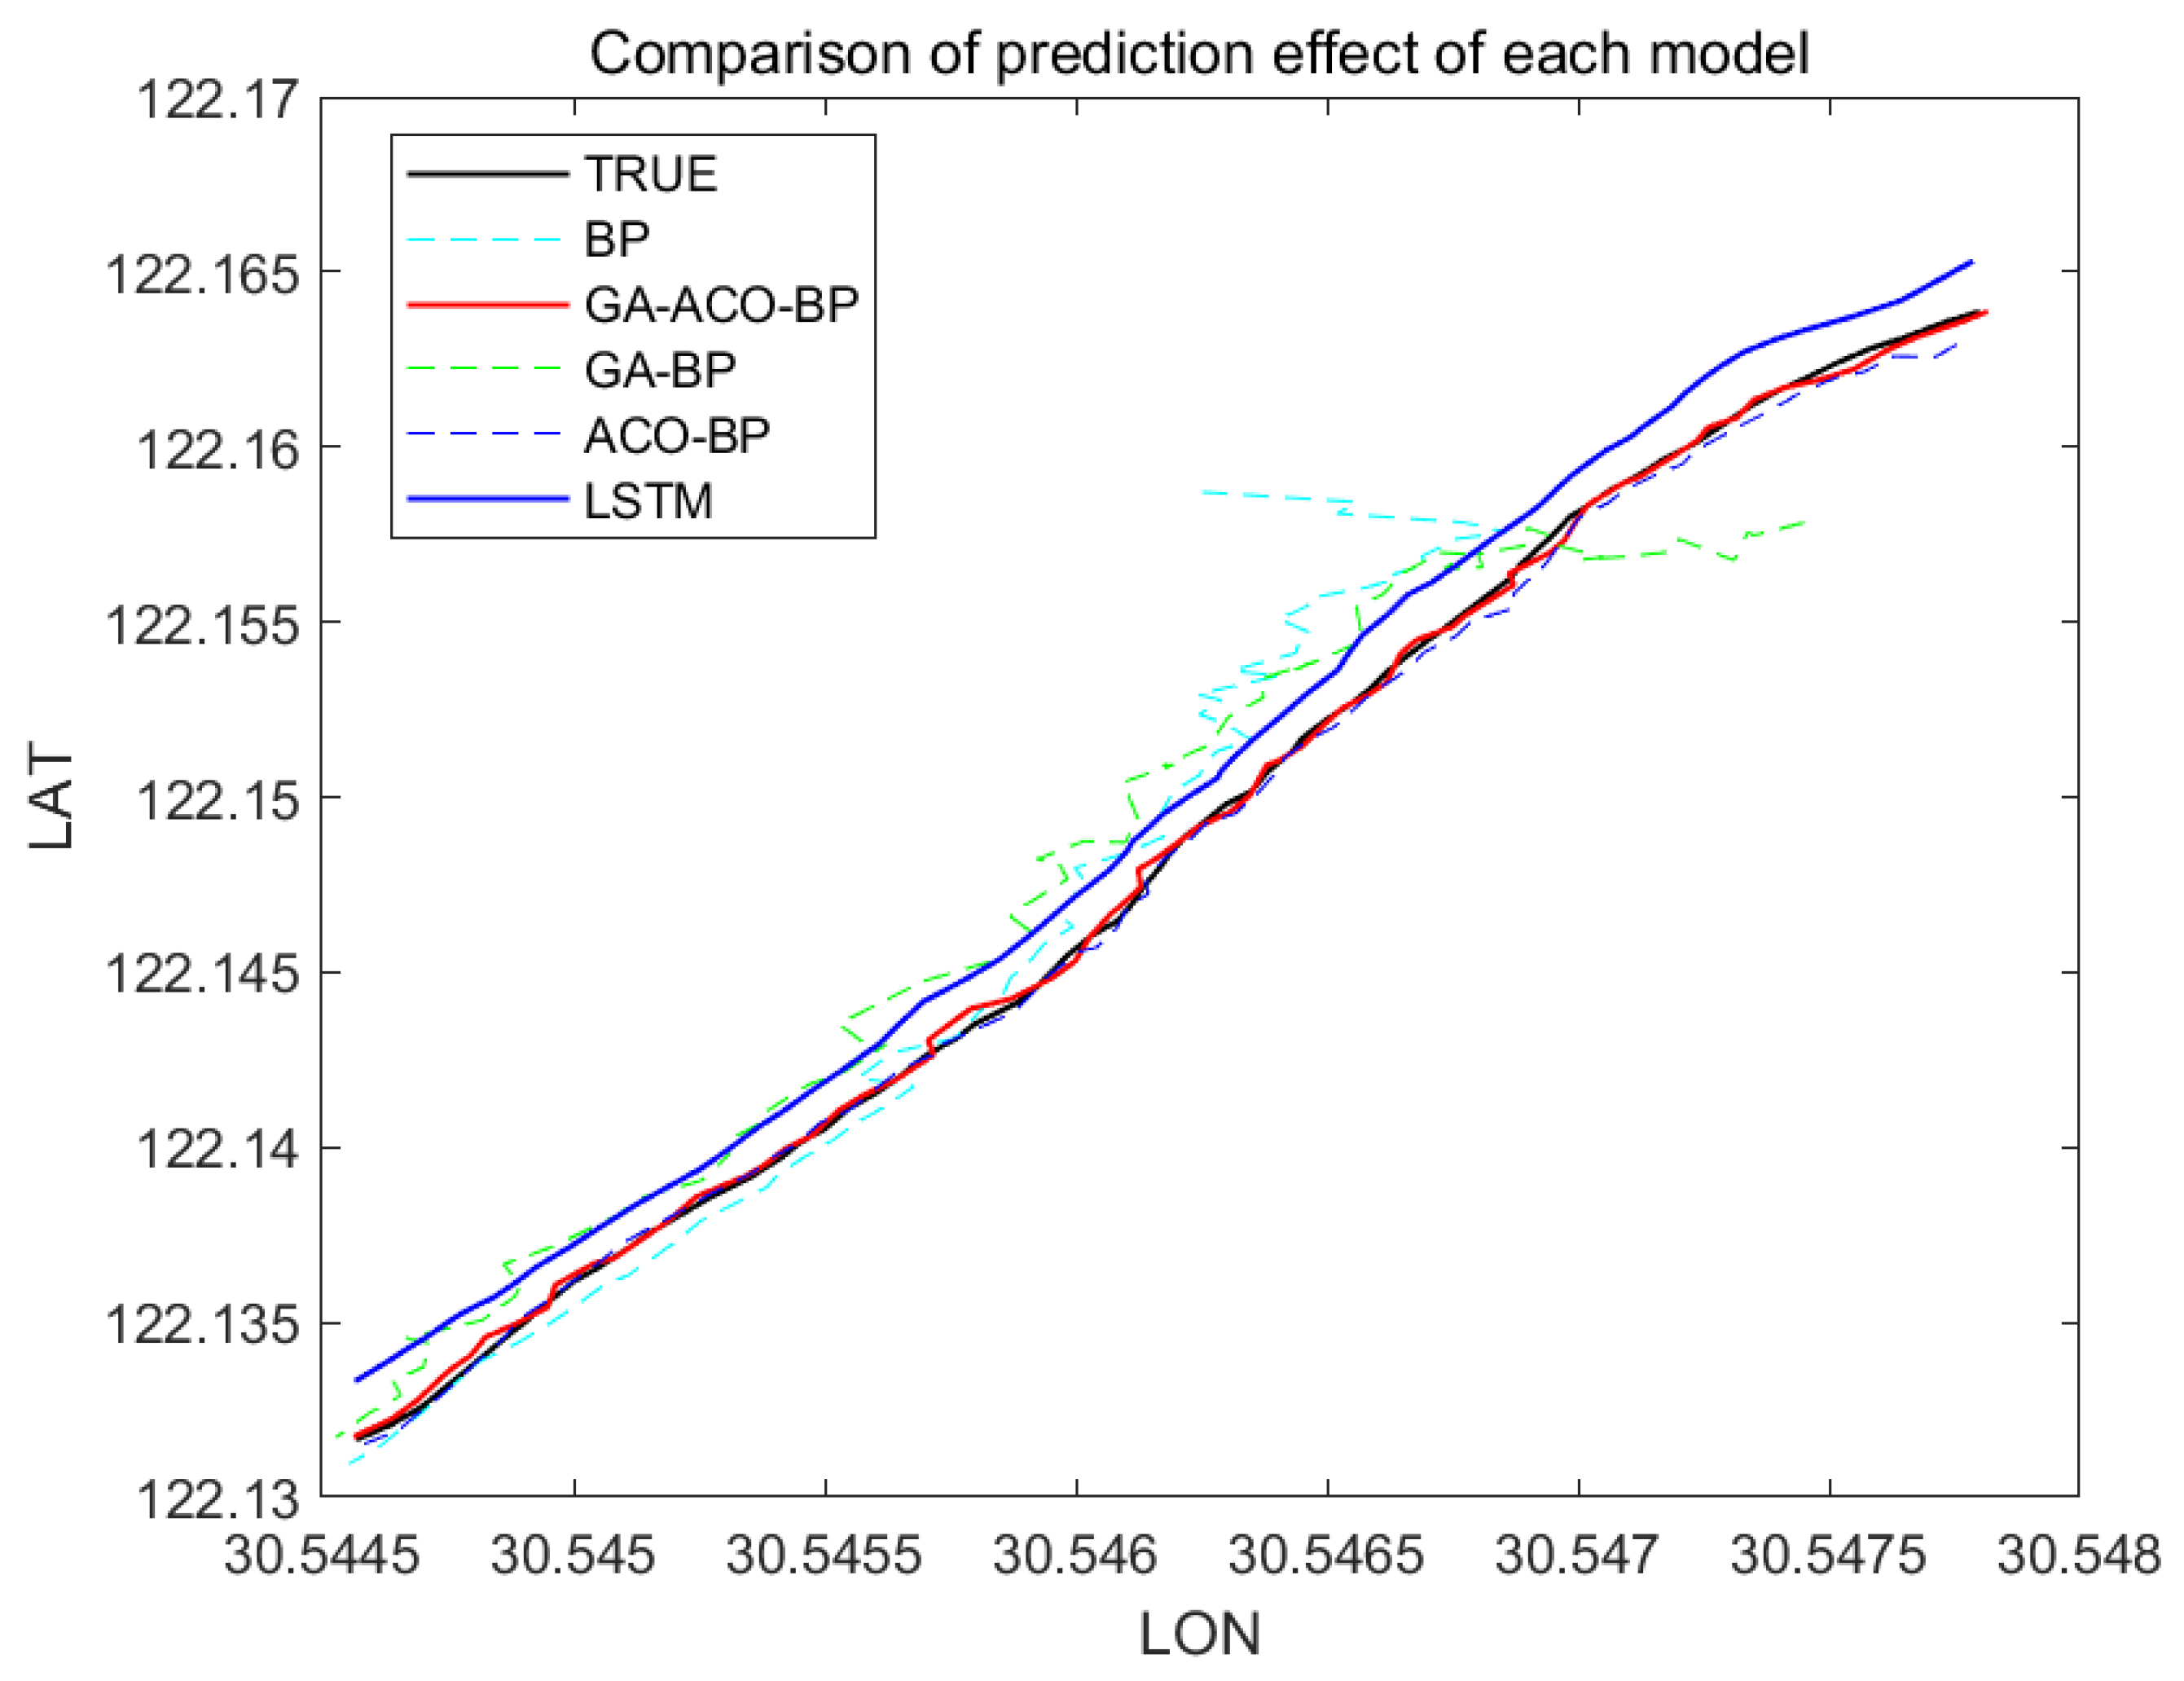
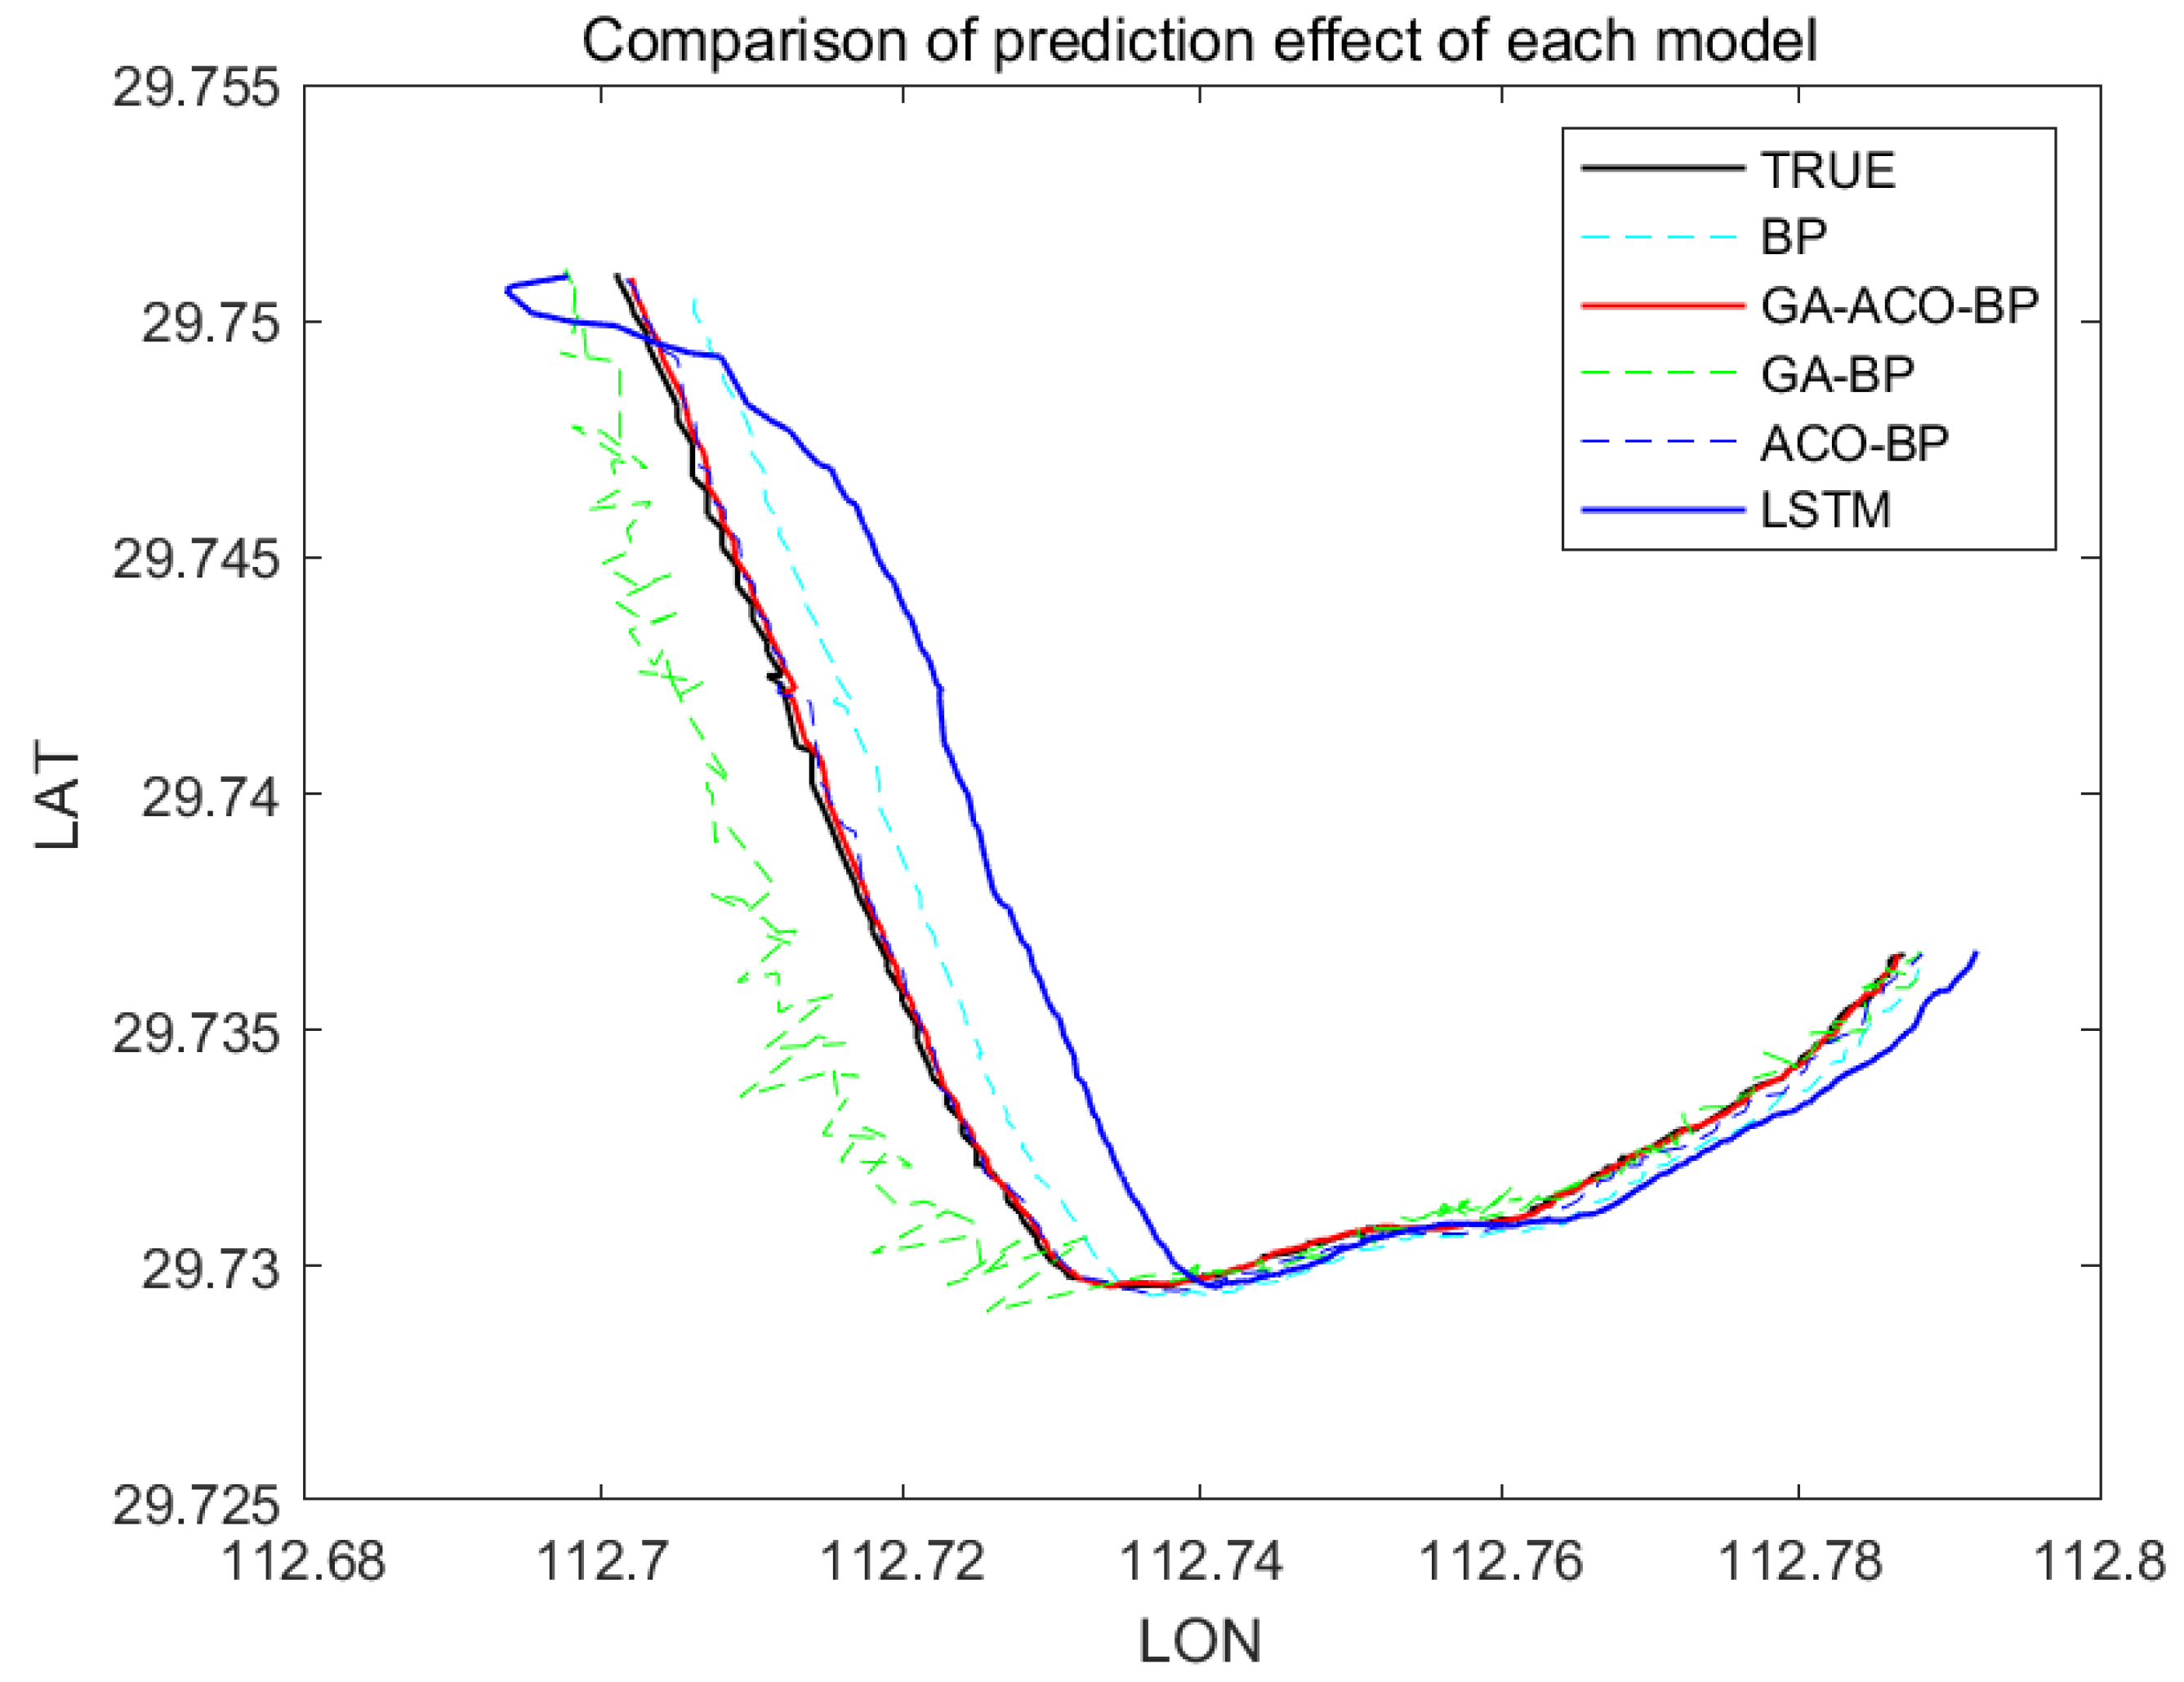
Figure 10, Figure 11 and Figure 12 show the comparison of the AIS data of different channels and the prediction effect of different models after integration.
As can be seen from Figure 7, Figure 8, Figure 9, Figure 10, Figure 11 and Figure 12 above, the prediction effect of a single BP neural network model for longitude and latitude is significantly worse than that of the GA–ACO–BP neural network model, especially for irregular speed changes, as the prediction of a single BP neural network deviates greatly, while the GA–ACO–BP neural network model can still maintain a good prediction effect, which represents that the network model optimized based on the hybrid genetic–ant colony algorithm is compared with the BP neural network model and the optimized network model based on the genetic algorithm. The BP neural network, its prediction accuracy is greatly improved. In order to further illustrate the advantages of the GA–ACO–BP neural network model in terms of convergence speed, this paper compares the number of iterations under different network parameters.
Compared with LSTM model, this model can make a rapid response. Particularly for the small amount of data training under curved channel, the prediction error of this model has obvious advantages over that of LSTM model. Under the premise of no significant difference in training time, the optimization algorithm of this model greatly improves the prediction accuracy, and is adapted to a variety of different channels, and the prediction effect is stable.
5. Conclusions
The effectiveness of ship trajectory prediction depends on data quality and the prediction model. Considering the influence of these two aspects on trajectory prediction, this paper proposes a trajectory prediction method based on a hybrid genetic–ant colony algorithm to optimize the BP neural network. The method includes data preprocessing and neural network prediction. In the data preprocessing part, for the huge amount of redundant data and noise in the original AIS data, the relevant data subsets required for prediction are extracted. In the prediction part of the neural network, motion laws are found from a large number of trajectories with different characteristics to improve the accuracy and efficiency of prediction. Through the experimental verification of a large number of AIS data, it is proved that the prediction accuracy of the hybrid model is significantly better than that of the single BP neural network model and the BP neural network model optimized based on the genetic algorithm. The training speed and testing speed of the model are greatly reduced; at the same time, the model changes the evolutionary iteration purpose of the genetic algorithm, which greatly reduces the genetic evolution algebra required by the model under the relative accuracy, and speeds up the neural network convergence speed. It is proved that the hybrid genetic–ant colony algorithm can better adapt to the BP neural network model in terms of computational time consumption and prediction accuracy, so as to achieve a better prediction effect. Through the above work, it is proved that the method proposed in this paper is practical and effective in improving the accuracy and efficiency of track prediction.
At the same time, although the algorithm is suitable for trajectory prediction under various types of inland waterways, when predicting the trajectory of ships sailing in continuous curves, due to the changing circumstances, ant colony optimization needs to increase the pheromone volatilization coefficient and other parameters, which will undoubtedly increase the time for model training. This involves a balance problem. How to maintain the accuracy of prediction at the fastest possible training speed is also a problem that will be further discussed in the future. For example, more combined meta heuristic algorithms are used to optimize the neural network to meet the small, fast and accurate prediction objectives of inland rivers and provide more regulatory means for water traffic management.
Author Contributions
Conceptualization, Y.Z.; data curation, X.L. (Xuemeng Lv) and L.Q.; formal analysis, X.L. (Xuemeng Lv); funding acquisition, Y.Z.; investigation, Y.Z.; methodology, L.Q.; resources, X.L. (Xinyu Liu) All authors have read and agreed to the published version of the manuscript.
Funding
The research is financially supported by National Nature Science Foundation of China (51979215; 52171350).
Institutional Review Board Statement
Not applicable.
Informed Consent Statement
Not applicable.
Data Availability Statement
Not applicable.
Conflicts of Interest
The authors declare that they have no known competing financial interest or personal relationship that could have appeared to influence the work reported in this paper.
References
- Yoo, Y.; Kim, T. An Improved Ship Collision Risk Evaluation Method for Korea Maritime Safety Audit Considering Traffic Flow Characteristics. J. Mar. Sci. Eng. 2019, 7, 448. [Google Scholar] [CrossRef]
- He, Z.; Shao, Z.; Zeng, J. Ship navigation safety risk assessment based on genetic algorithm and BP neural network. Sci. Res. Rev. 2020, 13, 117. [Google Scholar]
- Xu, T.; Zhang, Q. Ship Traffic Flow Prediction in Wind Farms Water Area Based on Spatiotemporal Dependence. J. Mar. Sci. Eng. 2022, 10, 295. [Google Scholar] [CrossRef]
- Lv, P.; Zhuang, Y.; Yang, K. Prediction of Ship Traffic Flow Based on BP Neural Network and Markov Model. MATEC Web Conf. 2016, 81, 04007. [Google Scholar] [CrossRef]
- Bukhari, A.C.; Tusseyeva, I.; Kim, Y.G. An intelligent real-time multi-vessel collision risk assessment system from VTS view point based on fuzzy inference system. Expert Syst. Appl. 2013, 40, 1220–1230. [Google Scholar] [CrossRef]
- Xiao, F.; Ligteringen, H.; van Gulijk, C.; Ale, B. Comparison study on AIS data of ship traffic behavior. Ocean. Eng. 2015, 95, 84–93. [Google Scholar] [CrossRef]
- Brian, M.; Prasad, P.L. Ship behavior prediction via trajectory extraction-based clustering for maritime situation awareness. J. Ocean. Eng. Sci. 2021, 7, 1–13. [Google Scholar]
- Capobianco, S.; Millefiori, L.M.; Forti, N.; Braca, P.; Willett, P. Deep Learning Methods for Vessel Trajectory Prediction based on Recurrent Neural Networks. IEEE Trans. Aerosp. Electron. Syst. 2021, 57, 4329–4346. [Google Scholar] [CrossRef]
- Suo, Y.; Chen, W.; Claramunt, C.; Yang, S. A Ship Trajectory Prediction Framework Based on a Recurrent Neural Network. Sensors 2020, 20, 5133. [Google Scholar] [CrossRef] [PubMed]
- Qian, L.; Zheng, Y.; Li, L.; Ma, Y.; Zhou, C.; Zhang, D. A New Method of Inland Water Ship Trajectory Prediction Based on Long Short-Term Memory Network Optimized by Genetic Algorithm. Appl. Sci. 2022, 12, 4073. [Google Scholar] [CrossRef]
- Liu, Y.; Duan, W.; Huang, L.; Duan, S.; Ma, X. The input vector space optimization for LSTM deep learning model in real-time prediction of ship motions. Ocean. Eng. 2020, 213, 107681. [Google Scholar] [CrossRef]
- Tang, H.; Yin, Y.; Shen, H. A model for vessel trajectory prediction based on long short-term memory neural network. J. Mar. Eng. Technol. 2022, 21, 136–145. [Google Scholar] [CrossRef]
- Zhi-Jun, W.; Shan Tian, L.M. A 4D Trajectory Prediction Model Based on the BP Neural Network. J. Intell. Syst. 2019, 29, 1545–1557. [Google Scholar]
- Song, L.; Shengli, W.; Dingbao, X. Radar track prediction method based on BP neural network. J. Eng. 2019, 2019, 8051–8055. [Google Scholar] [CrossRef]
- Zhou, H.; Chen, Y.; Zhang, S. Ship Trajectory Prediction Based on BP Neural Network. J. Artif. Intell. 2019, 1, 29–36. [Google Scholar] [CrossRef]
- Rong, H.; Teixeira, A.P.; Soares, C.G. Ship trajectory uncertainty prediction based on a Gaussian Process model. Ocean Eng. 2019, 182, 499–511. [Google Scholar] [CrossRef]
- Wen-ying, J.; Yan, L.; Ming, C. An ant colony optimization–genetic algorithm approach for ship pipe route design. Int. Shipbuild. Prog. 2014, 61, 163–183. [Google Scholar]
- Dong, H.C.; Dong, Z.M. Surrogate-assisted grey wolf optimization for high-dimensional, computationally ex pensive black-box problems. Swarm Evol. Ary Comput. 2020, 57, 100713. [Google Scholar] [CrossRef]
- Deng, H.B.; Peng, L.Z.; Zhang, H.B.; Yang, B.; Chen, Z. Ranking based biased learning swarm optimizer for large-scale optimization. Inf. Sci. 2019, 493, 120–137. [Google Scholar] [CrossRef]
Figure 1.
Velocity and course thermodynamic profile. (a) Speed; (b) course.

Figure 2.
MMSI = 413802216 sending time chart.

Figure 3.
GA–ACO–BP neural network prediction model.

Figure 4.
BP neural network topology.

Figure 5.
Optimal hidden layer node graph.

Figure 6.
Longitude prediction error and comparison (GA-ACO-BP).

Figure 7.
Latitude prediction error and comparison (GA–ACO–BP).

Figure 8.
Speed prediction error and comparison.

Figure 9.
The original trajectories of experimental ships.

Figure 10.
Comparison of track prediction effects of each model (Wuhan section).

Figure 11.
Comparison of track prediction effects of each model (YangShan port).

Figure 12.
Comparison of track prediction effects of each model (YueYang section).


Table 1.
Experimental use data table.
| DATA SET | AIS |
|---|---|
| Position | Wuhan |
| Period | 21 June 2021–21 July 2021 19 May 2022–20 May 2022 |
| Time interval | <3 min |
| Raw data | 10,497,031 |
| Total number of tracks after processing | 571 |
| Total AIS data after processing | 180,647 |
| Input indicator | TIME/LON/LAT/SOG/COG/A/ROT |
| Output indicator | LON/LAT/TIME/SOG |
Table 2.
BP network parameters.
| Name | Value |
|---|---|
| Hidden layer nodes | 11 |
| Learn rate | 0.001 |
| Target error | 0.0001 |
| Time step | 25 |
| epochs | 100 |
| Min_grad | 10−6 |
Table 3.
Optimization algorithm network parameters (GA/ACO).
| Name | Value | |
|---|---|---|
| GA | Population size | 30 |
| Hybrid rate | 0.6 | |
| Mutation rate | 0.2 | |
| MaxGeneration | 50 | |
| ACO | MaxGeneration | 100 |
| Ant size | 30 | |
| Time step | 25 | |
| volatility coefficient | 0.3 | |
| Min_grad | 10−6 |
Table 4.
Error comparison table of each model.
| Network Model | MAE | MSE | RMSE | MAPE |
|---|---|---|---|---|
| LSTM | 0.0030329 | 4.8574 × 10⁻⁶ | 0.0022114 | 0.005752% |
| BP neural network | 0.0031725 | 7.4802 × 10⁻⁴ | 0.0038473 | 0.01036% |
| GA–BP neural network | 0.0020121 | 8.2417 × 10⁻⁵ | 0.0022972 | 0.006271% |
| ACO–BP neural network | 0.0040795 | 2.3528 × 10⁻⁵ | 0.0048506 | 0.0035635% |
| GA–ACO–BP neural network | 0.0014547 | 3.3217 × 10⁻⁶ | 0.0018226 | 0.0027472% |
Table 5.
Model efficiency comparison table (YueYang/curved channel).
| Neural Network | Training Duration (s) | Test Duration (s) | ||
|---|---|---|---|---|
| prediction accuracy | 10−4 | 10−5 | 10−4 | 10−5 |
| GA–BP | 45.785745 | 50.524558 | 0.0025646 | 0.0034546 |
| GA–ACO–BP | 32.714566 | 35.456464 | 0.038456 | 0.0039457 |
| ACO–BP | 60.564647 | 67.454645 | 0.0067544 | 0.0078651 |
| LSTM | 41.845995 | 47.456664 | 0.0039671 | 0.0045783 |
Table 6.
Model efficiency comparison table (YangShan/straight channel).
| Neural Network | Training Duration (s) | Test Duration (s) | ||
|---|---|---|---|---|
| prediction accuracy | 10−4 | 10−5 | 10−4 | 10−5 |
| GA–BP | 42.546455 | 45.832545 | 0.0018112 | 0.0022972 |
| GA–ACO–BP | 37.546544 | 41.546544 | 0.0036457 | 0.0038473 |
| ACO–BP | 50.457531 | 55.45788 | 0.0058371 | 0.0063040 |
| LSTM | 31.874541 | 37.418444 | 0.0038757 | 0.0039603 |
Publisher’s Note: MDPI stays neutral with regard to jurisdictional claims in published maps and institutional affiliations. |
© 2022 by the authors. Licensee MDPI, Basel, Switzerland. This article is an open access article distributed under the terms and conditions of the Creative Commons Attribution (CC BY) license (https://creativecommons.org/licenses/by/4.0/).
Share and Cite
MDPI and ACS Style
Zheng, Y.; Lv, X.; Qian, L.; Liu, X. An Optimal BP Neural Network Track Prediction Method Based on a GA–ACO Hybrid Algorithm. J. Mar. Sci. Eng. 2022, 10, 1399. https://doi.org/10.3390/jmse10101399
AMA Style
Zheng Y, Lv X, Qian L, Liu X. An Optimal BP Neural Network Track Prediction Method Based on a GA–ACO Hybrid Algorithm. Journal of Marine Science and Engineering. 2022; 10(10):1399. https://doi.org/10.3390/jmse10101399
Chicago/Turabian StyleZheng, Yuanzhou, Xuemeng Lv, Long Qian, and Xinyu Liu. 2022. "An Optimal BP Neural Network Track Prediction Method Based on a GA–ACO Hybrid Algorithm" Journal of Marine Science and Engineering 10, no. 10: 1399. https://doi.org/10.3390/jmse10101399
Note that from the first issue of 2016, this journal uses article numbers instead of page numbers. See further details here.