
Elemental Composition of Above and Belowground Mangrove Tissue and Sediment in Managed and Unmanaged Compartments of the Matang Mangrove Forest Reserve


Abstract
:1. Introduction
2. Results
2.1. Composition of Elements in Mangrove Leaves, Roots, and Sediments
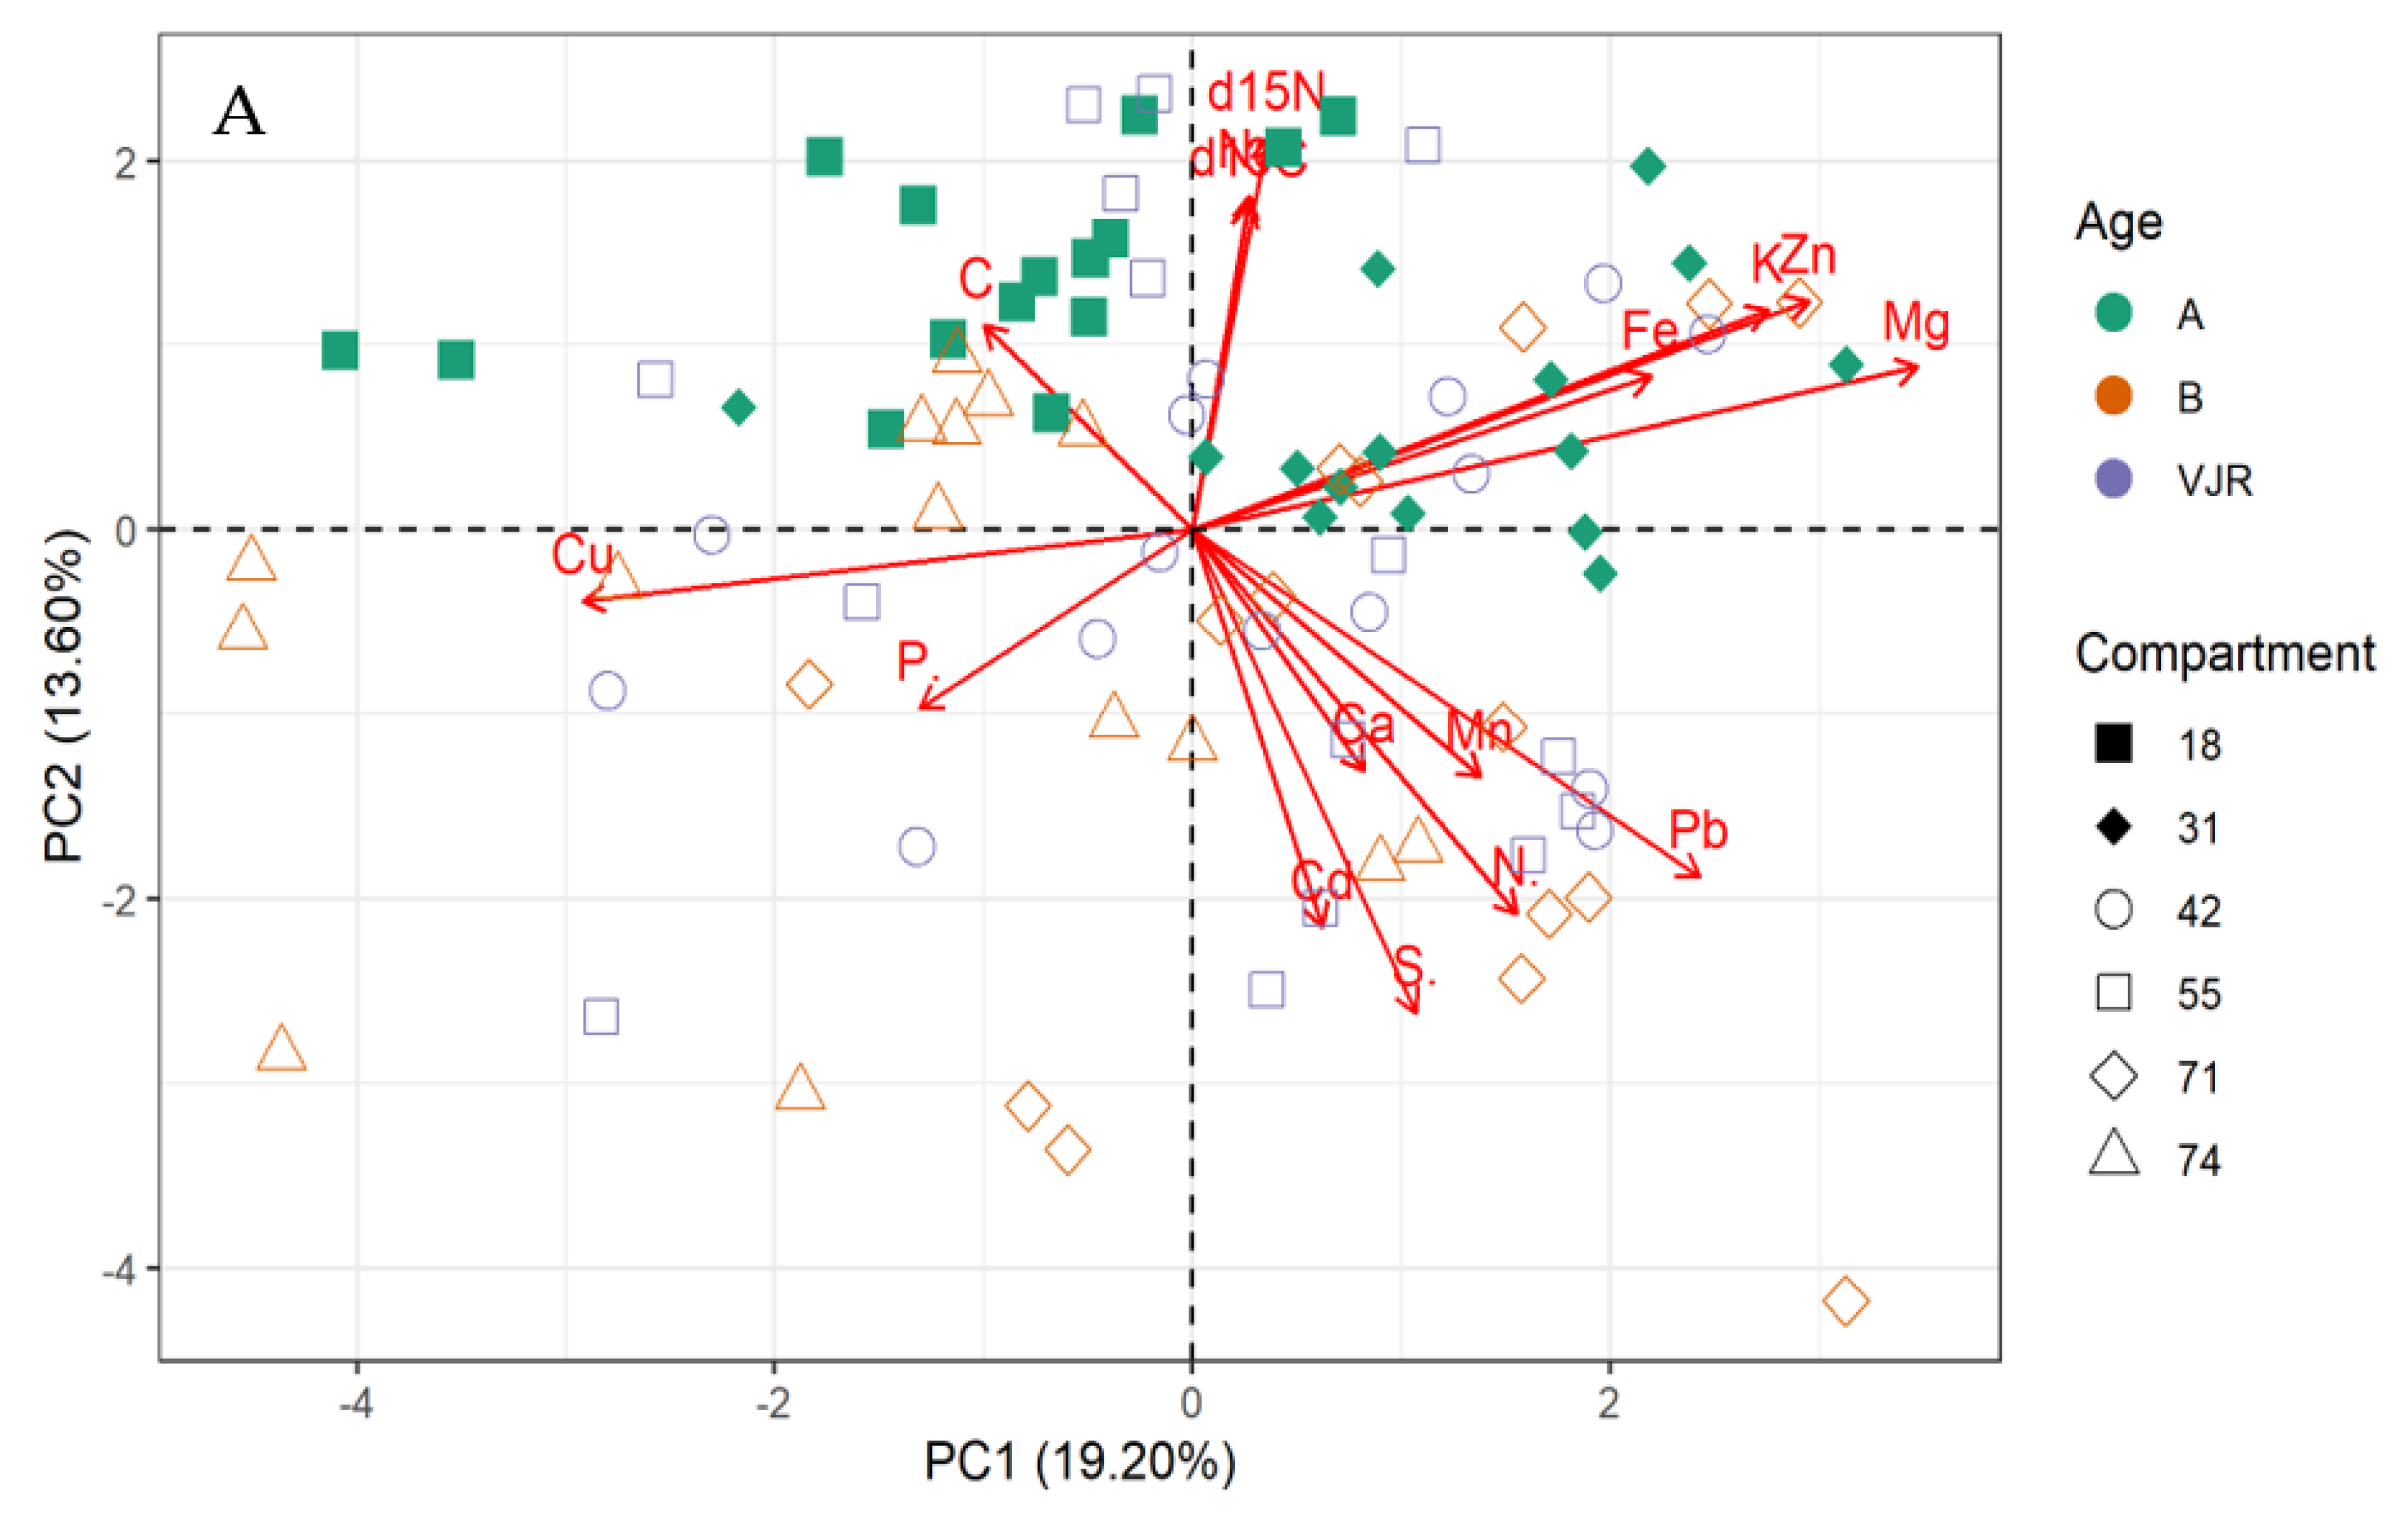
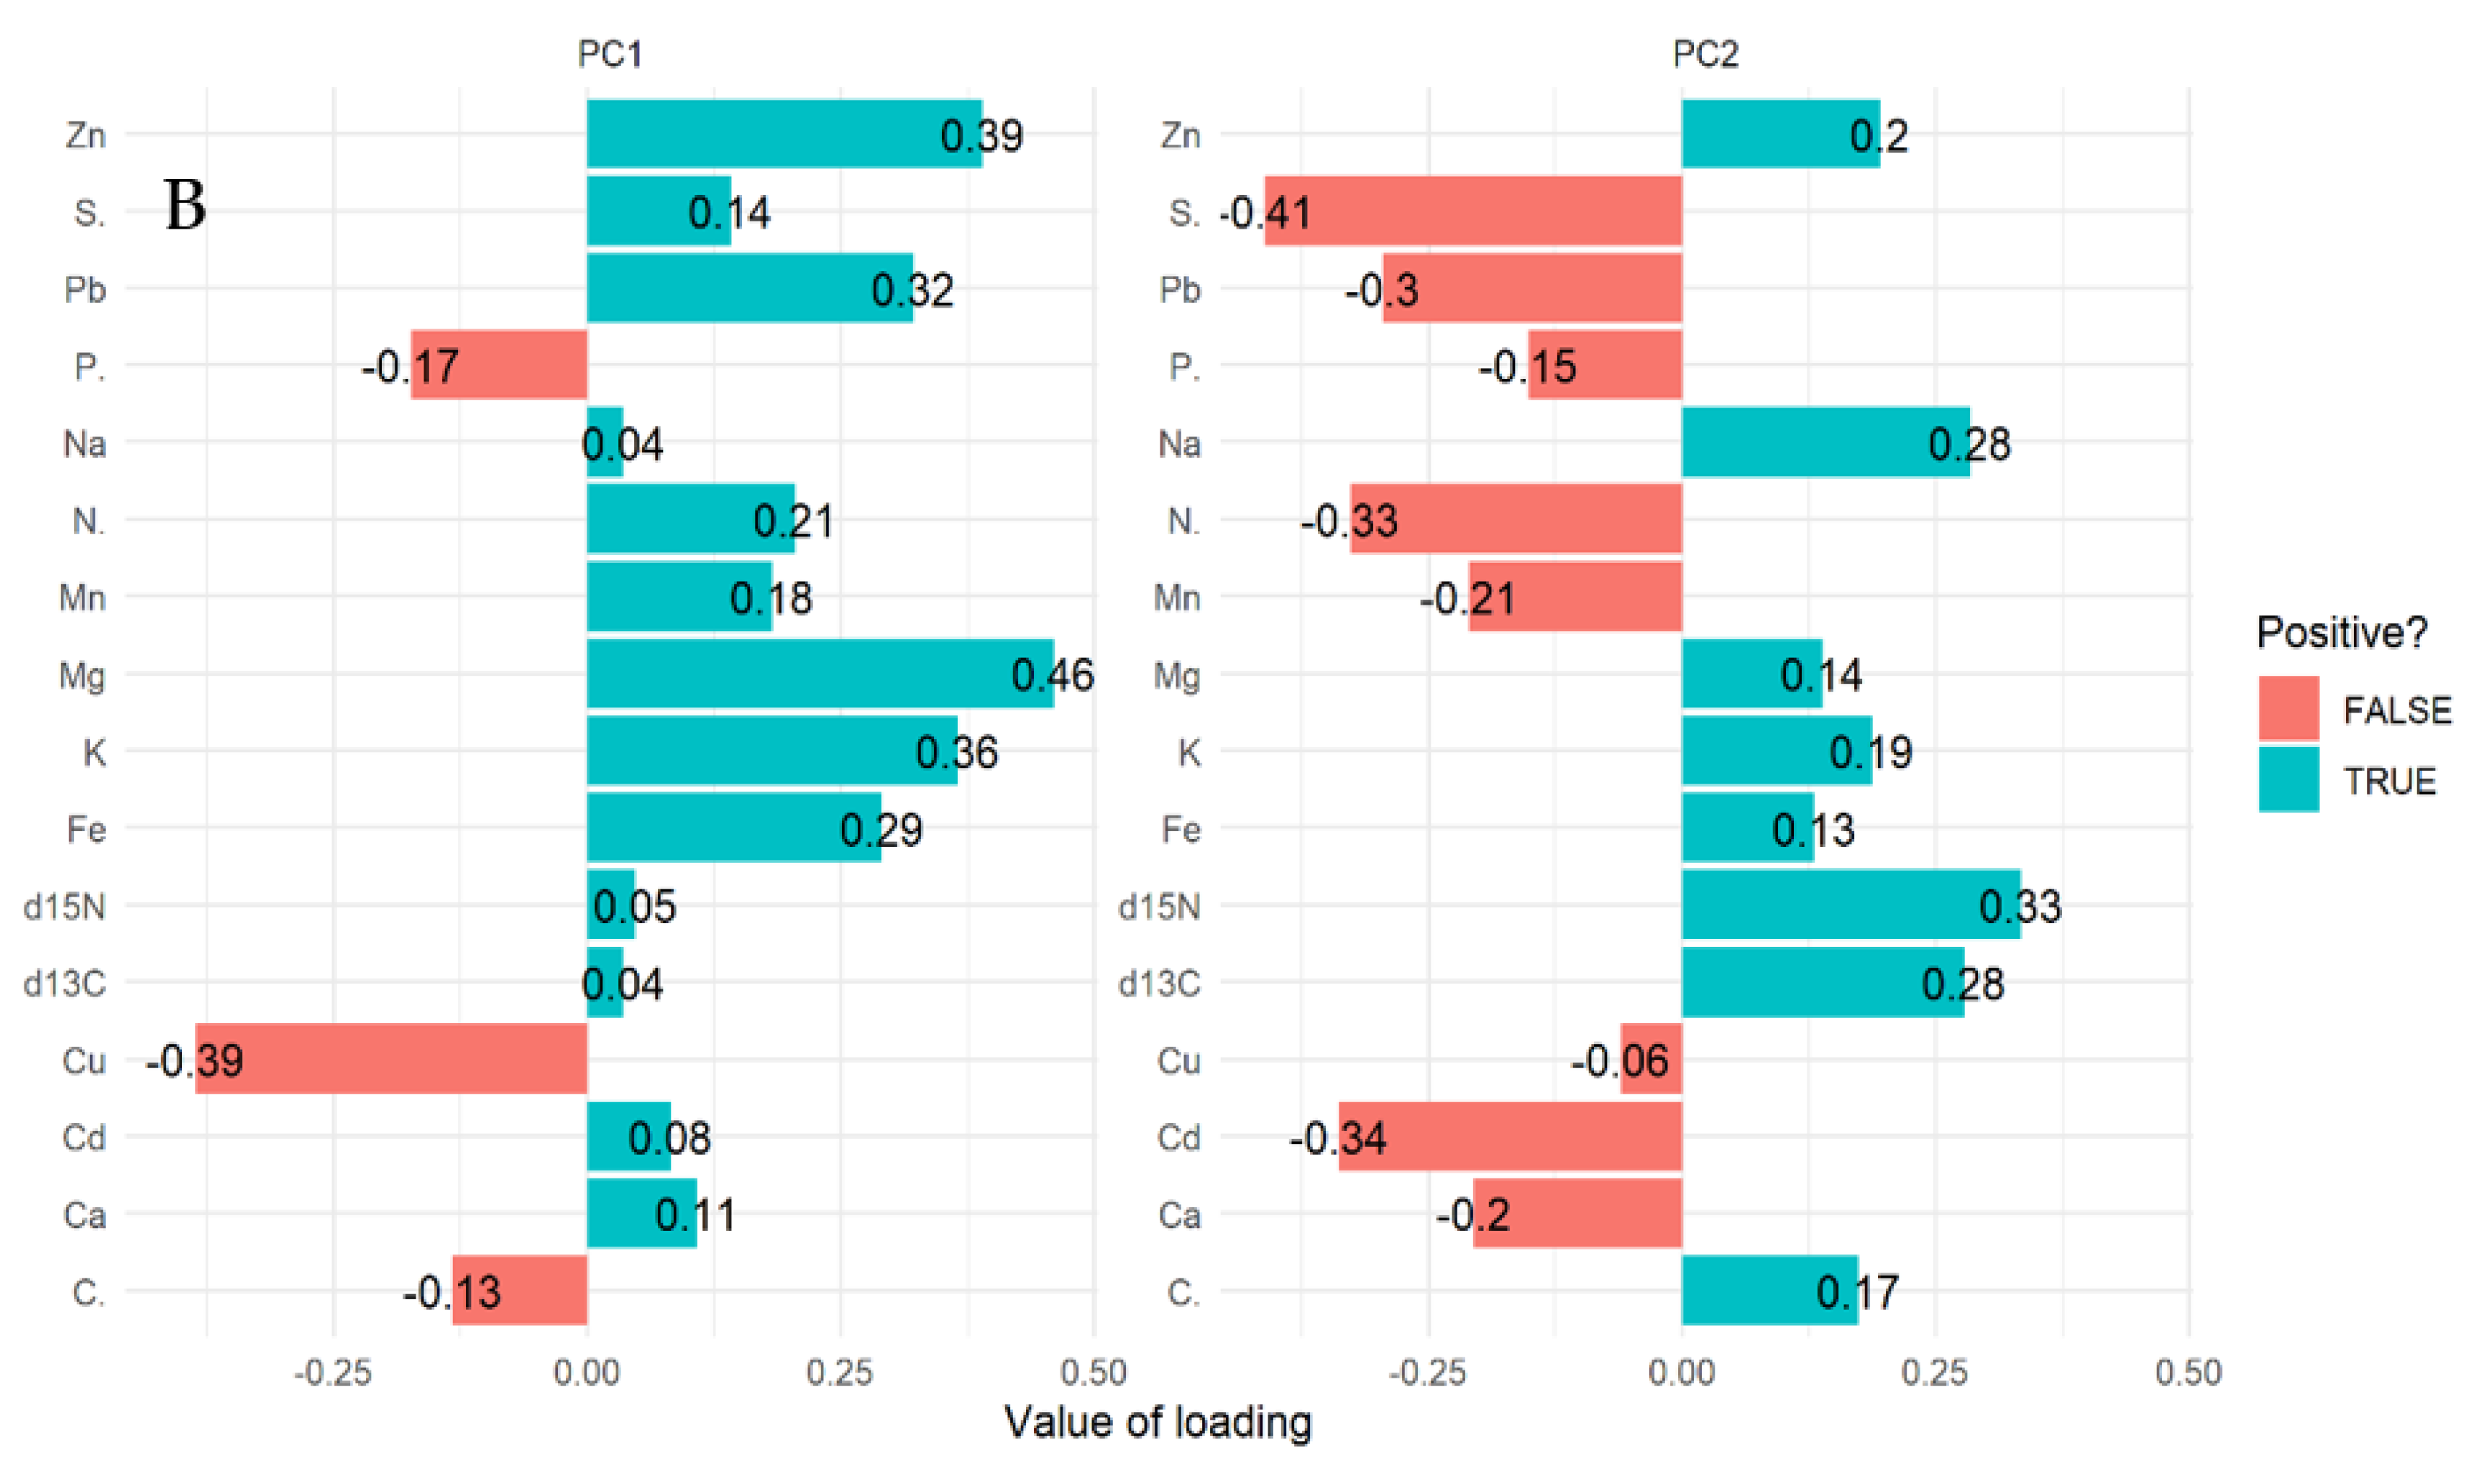
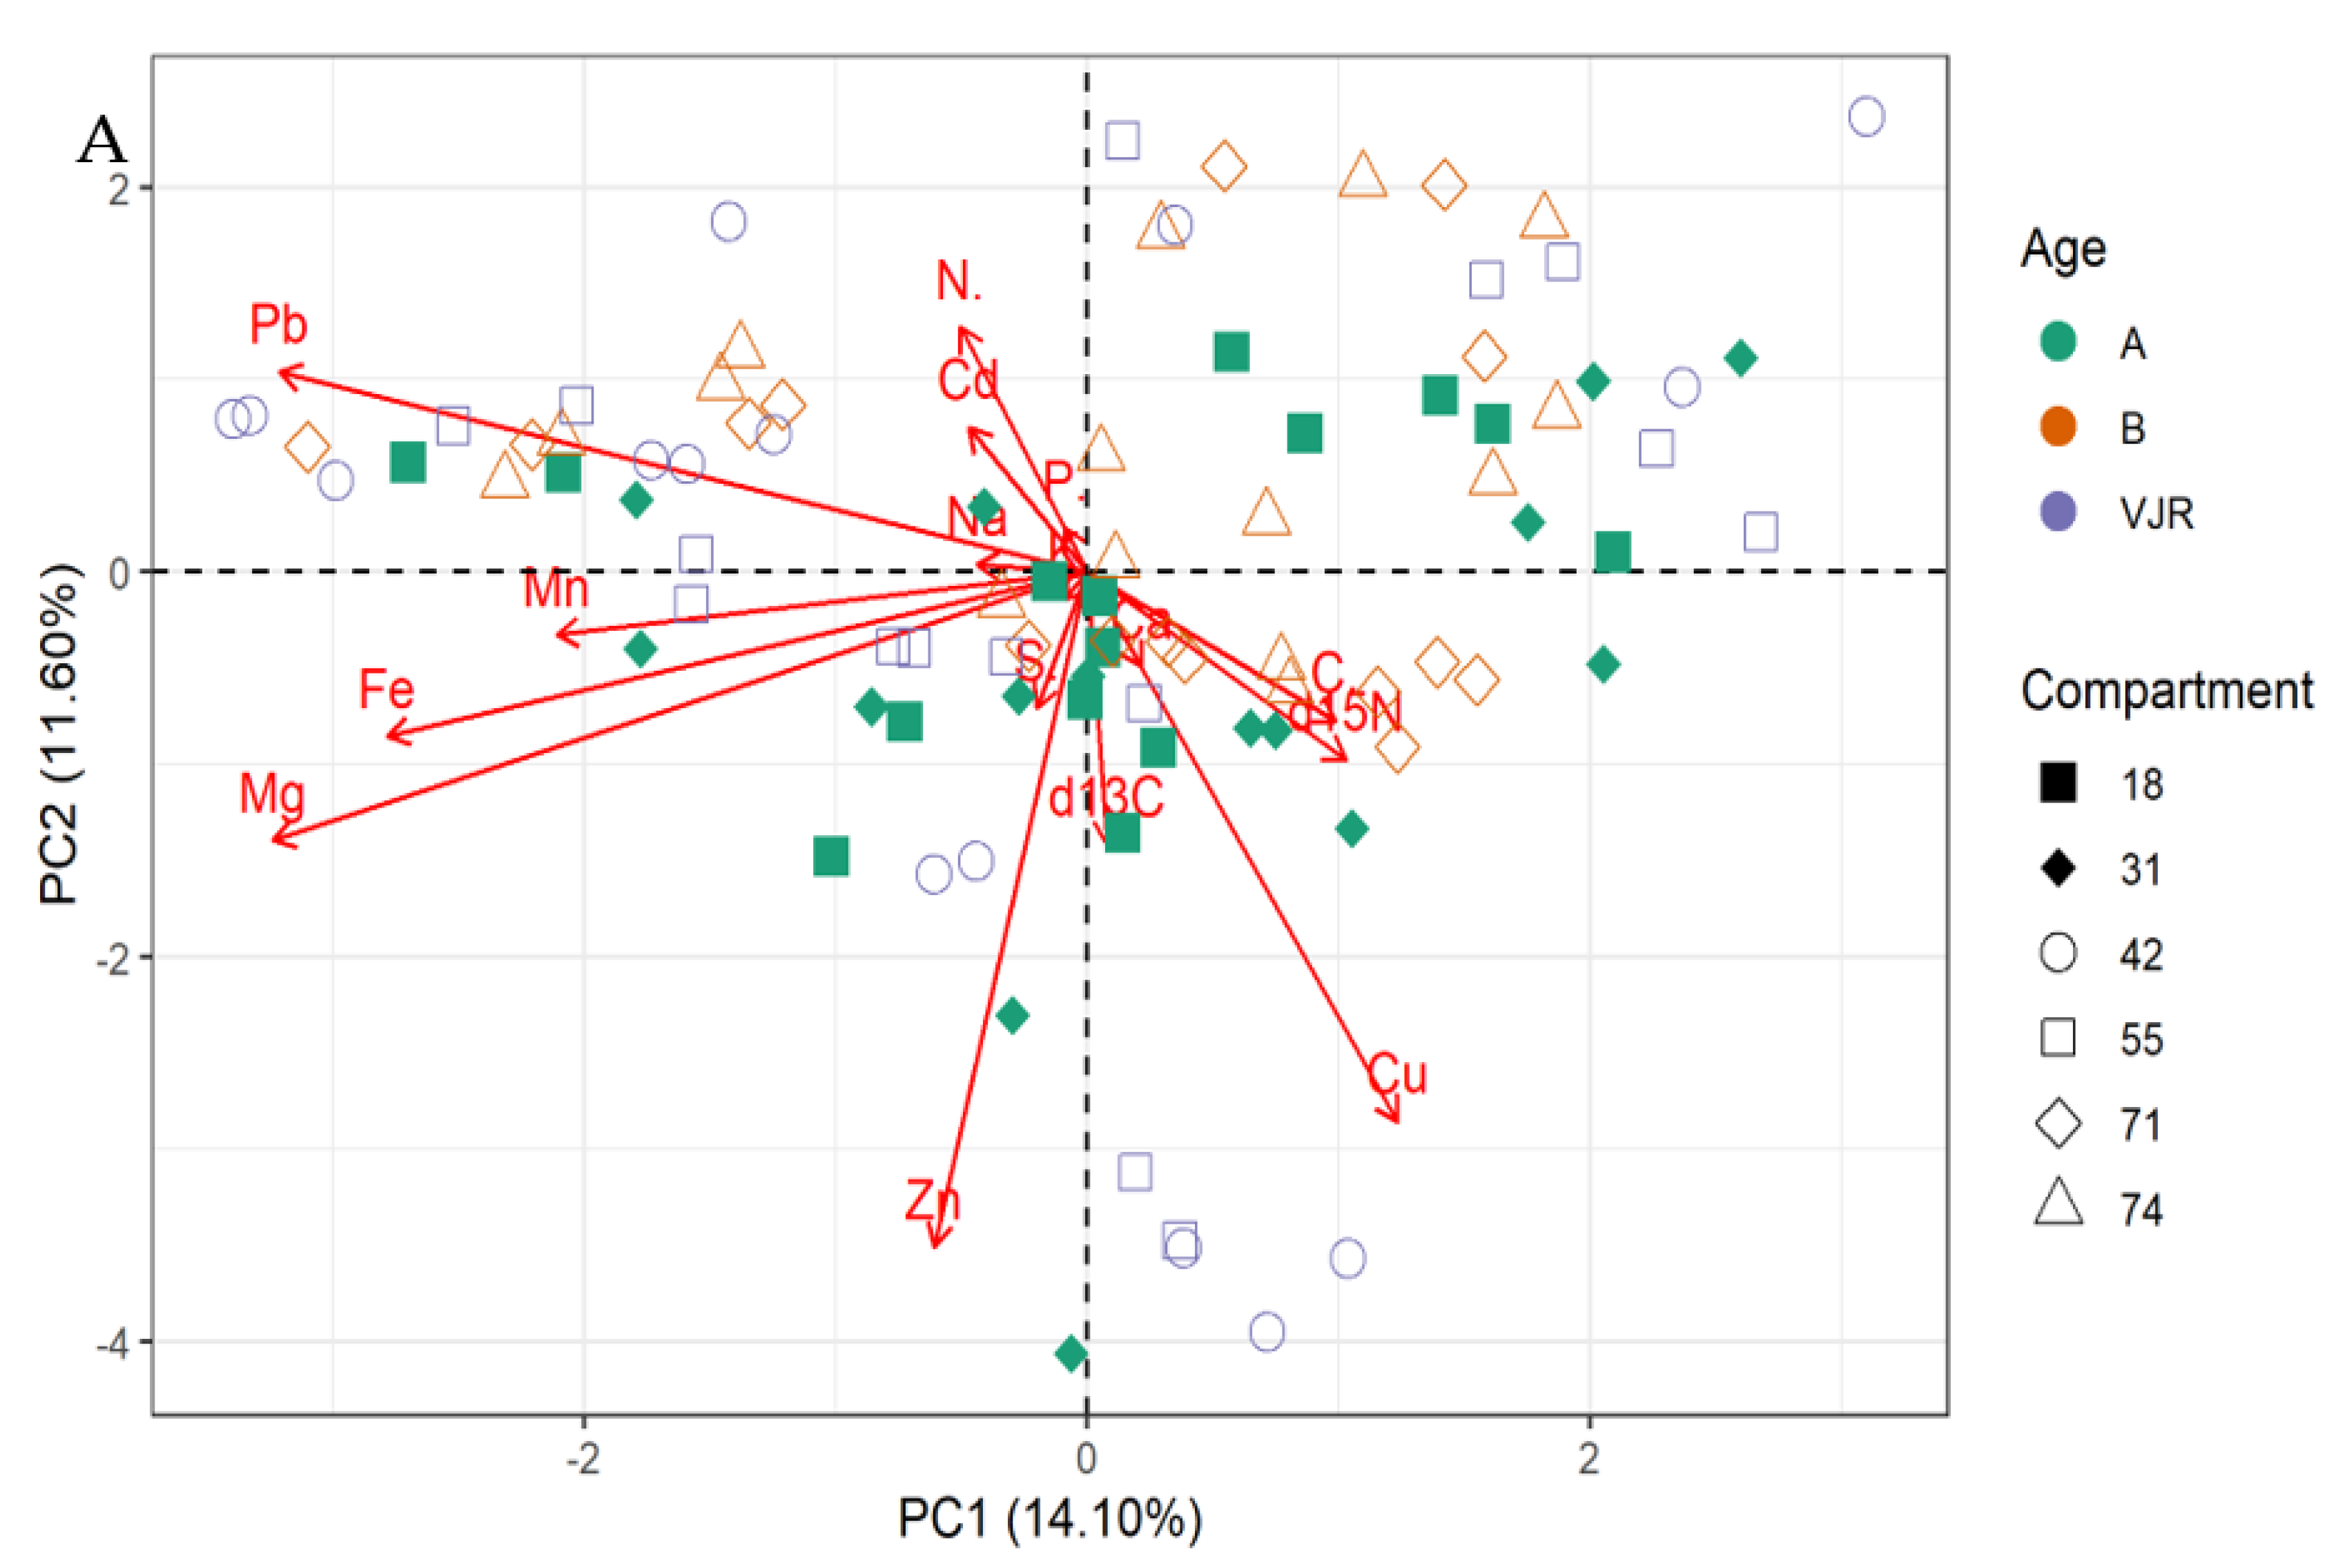
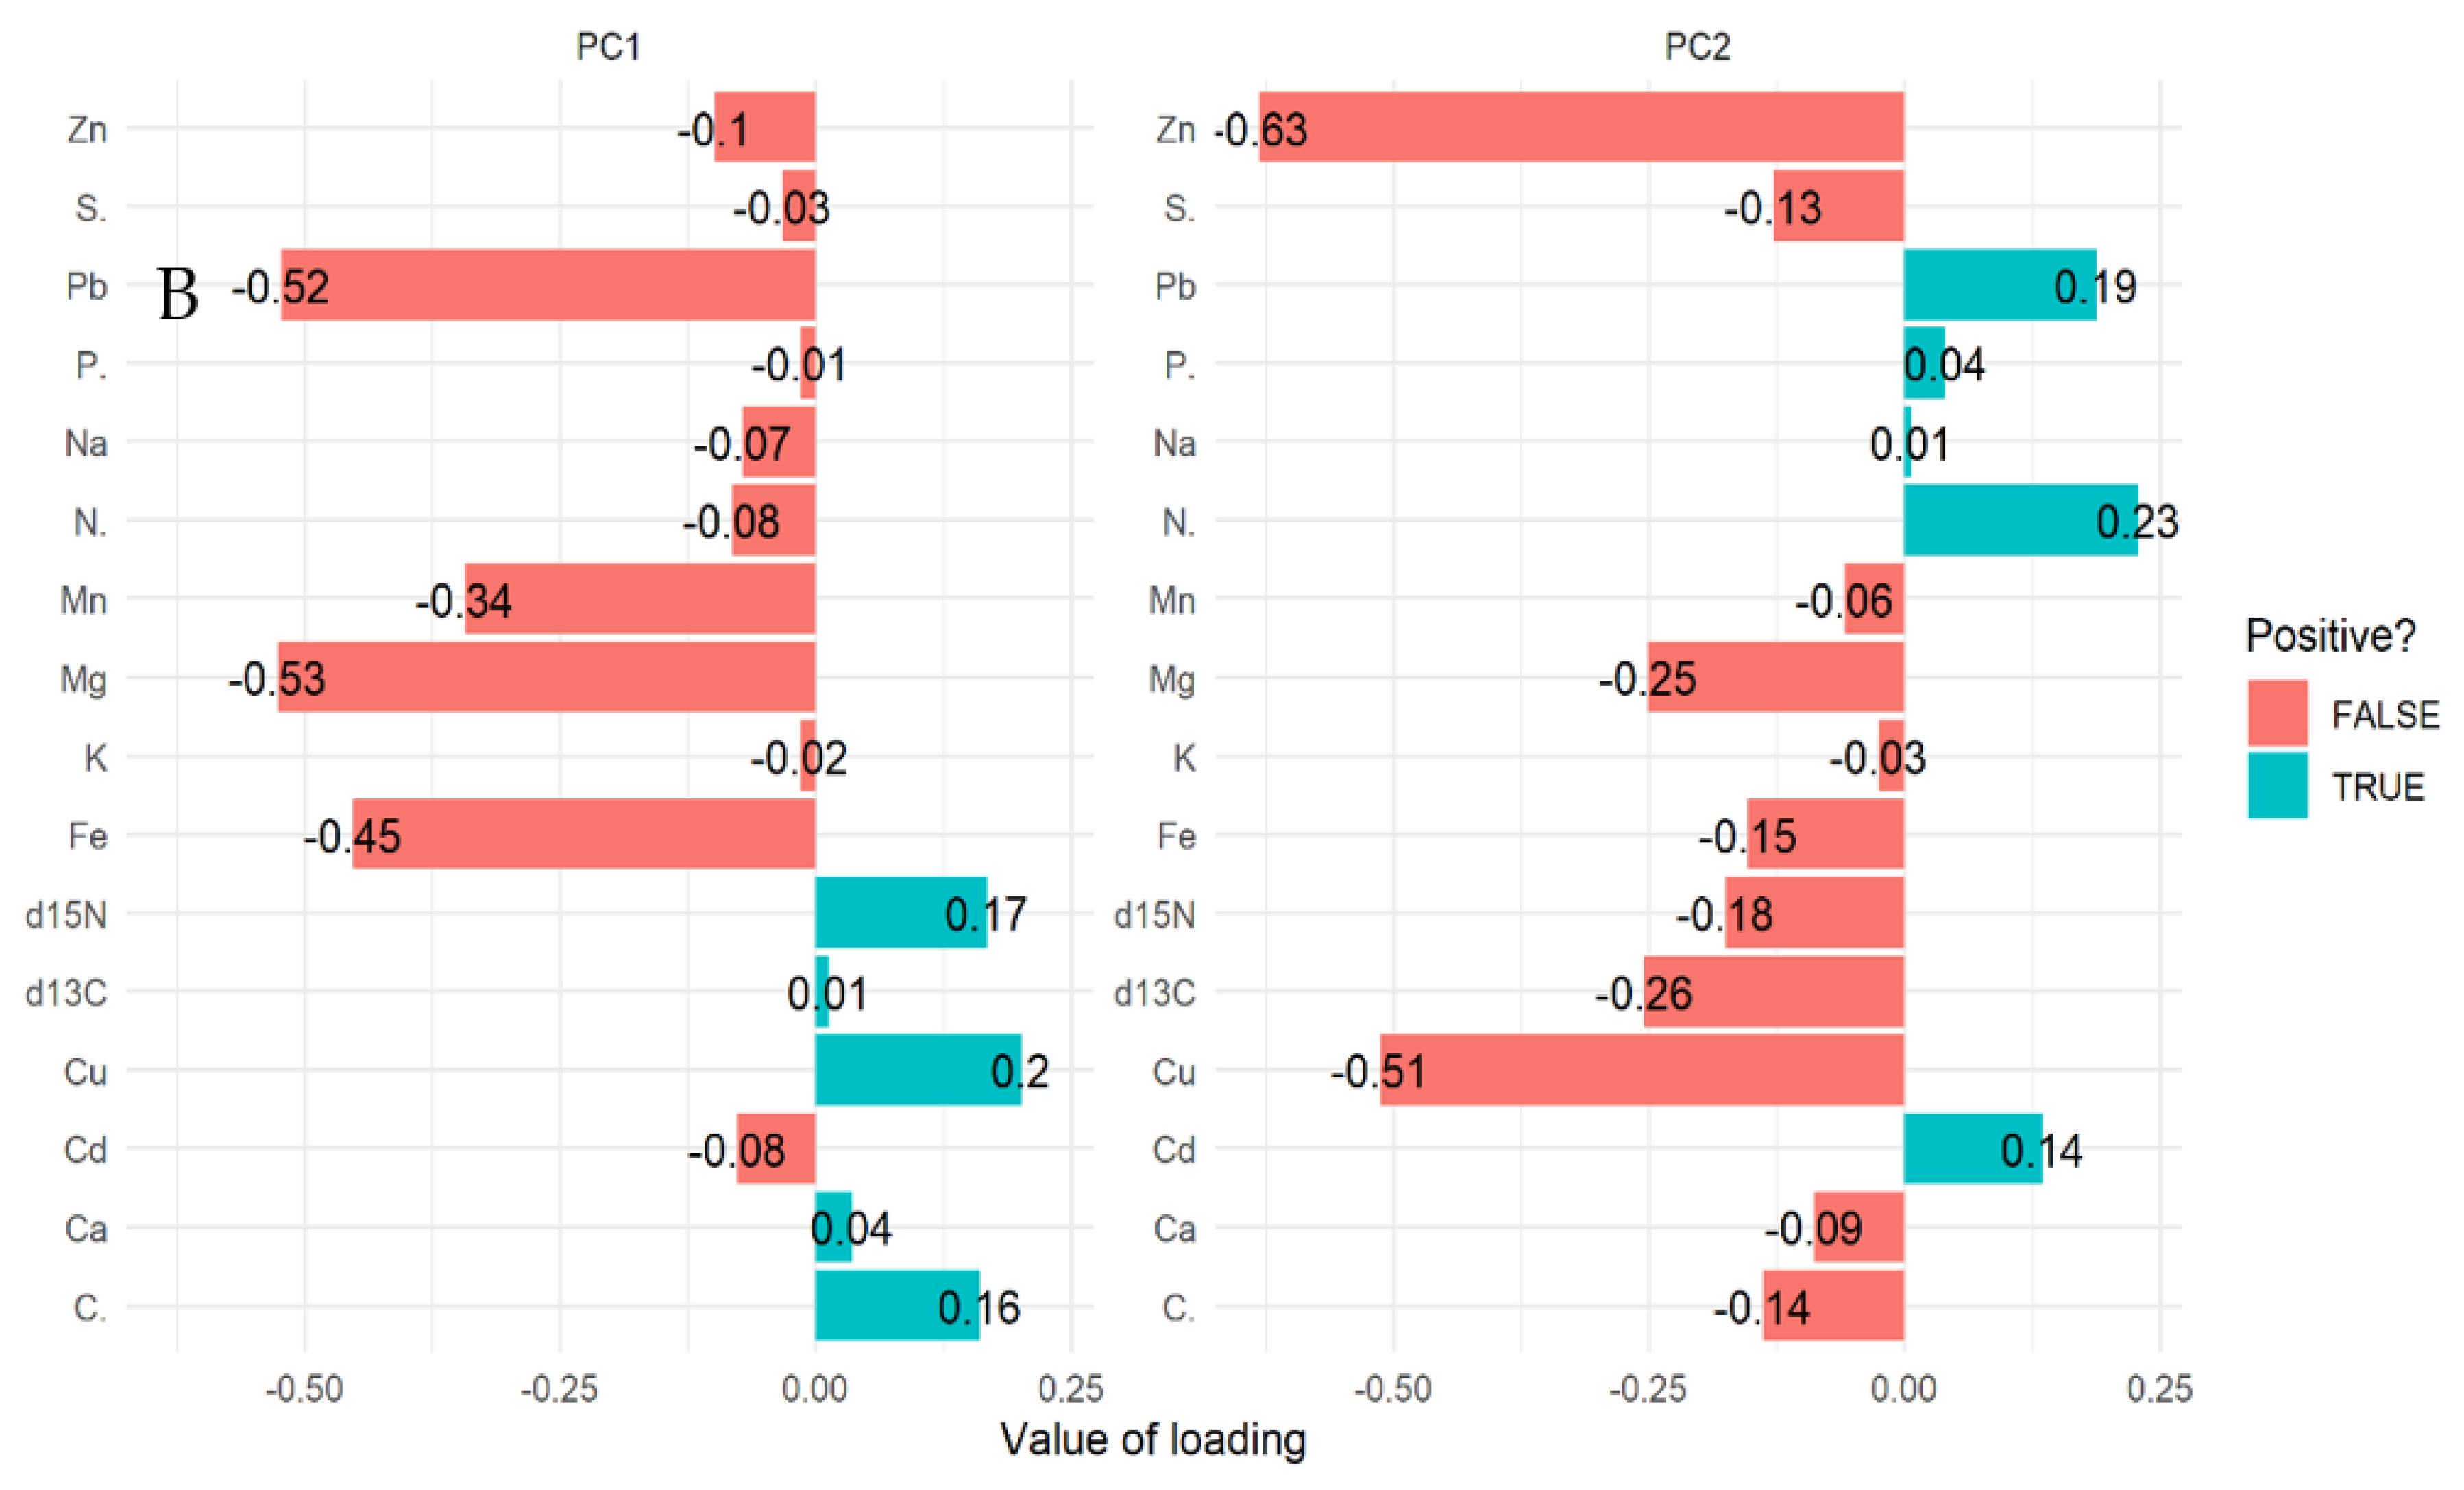
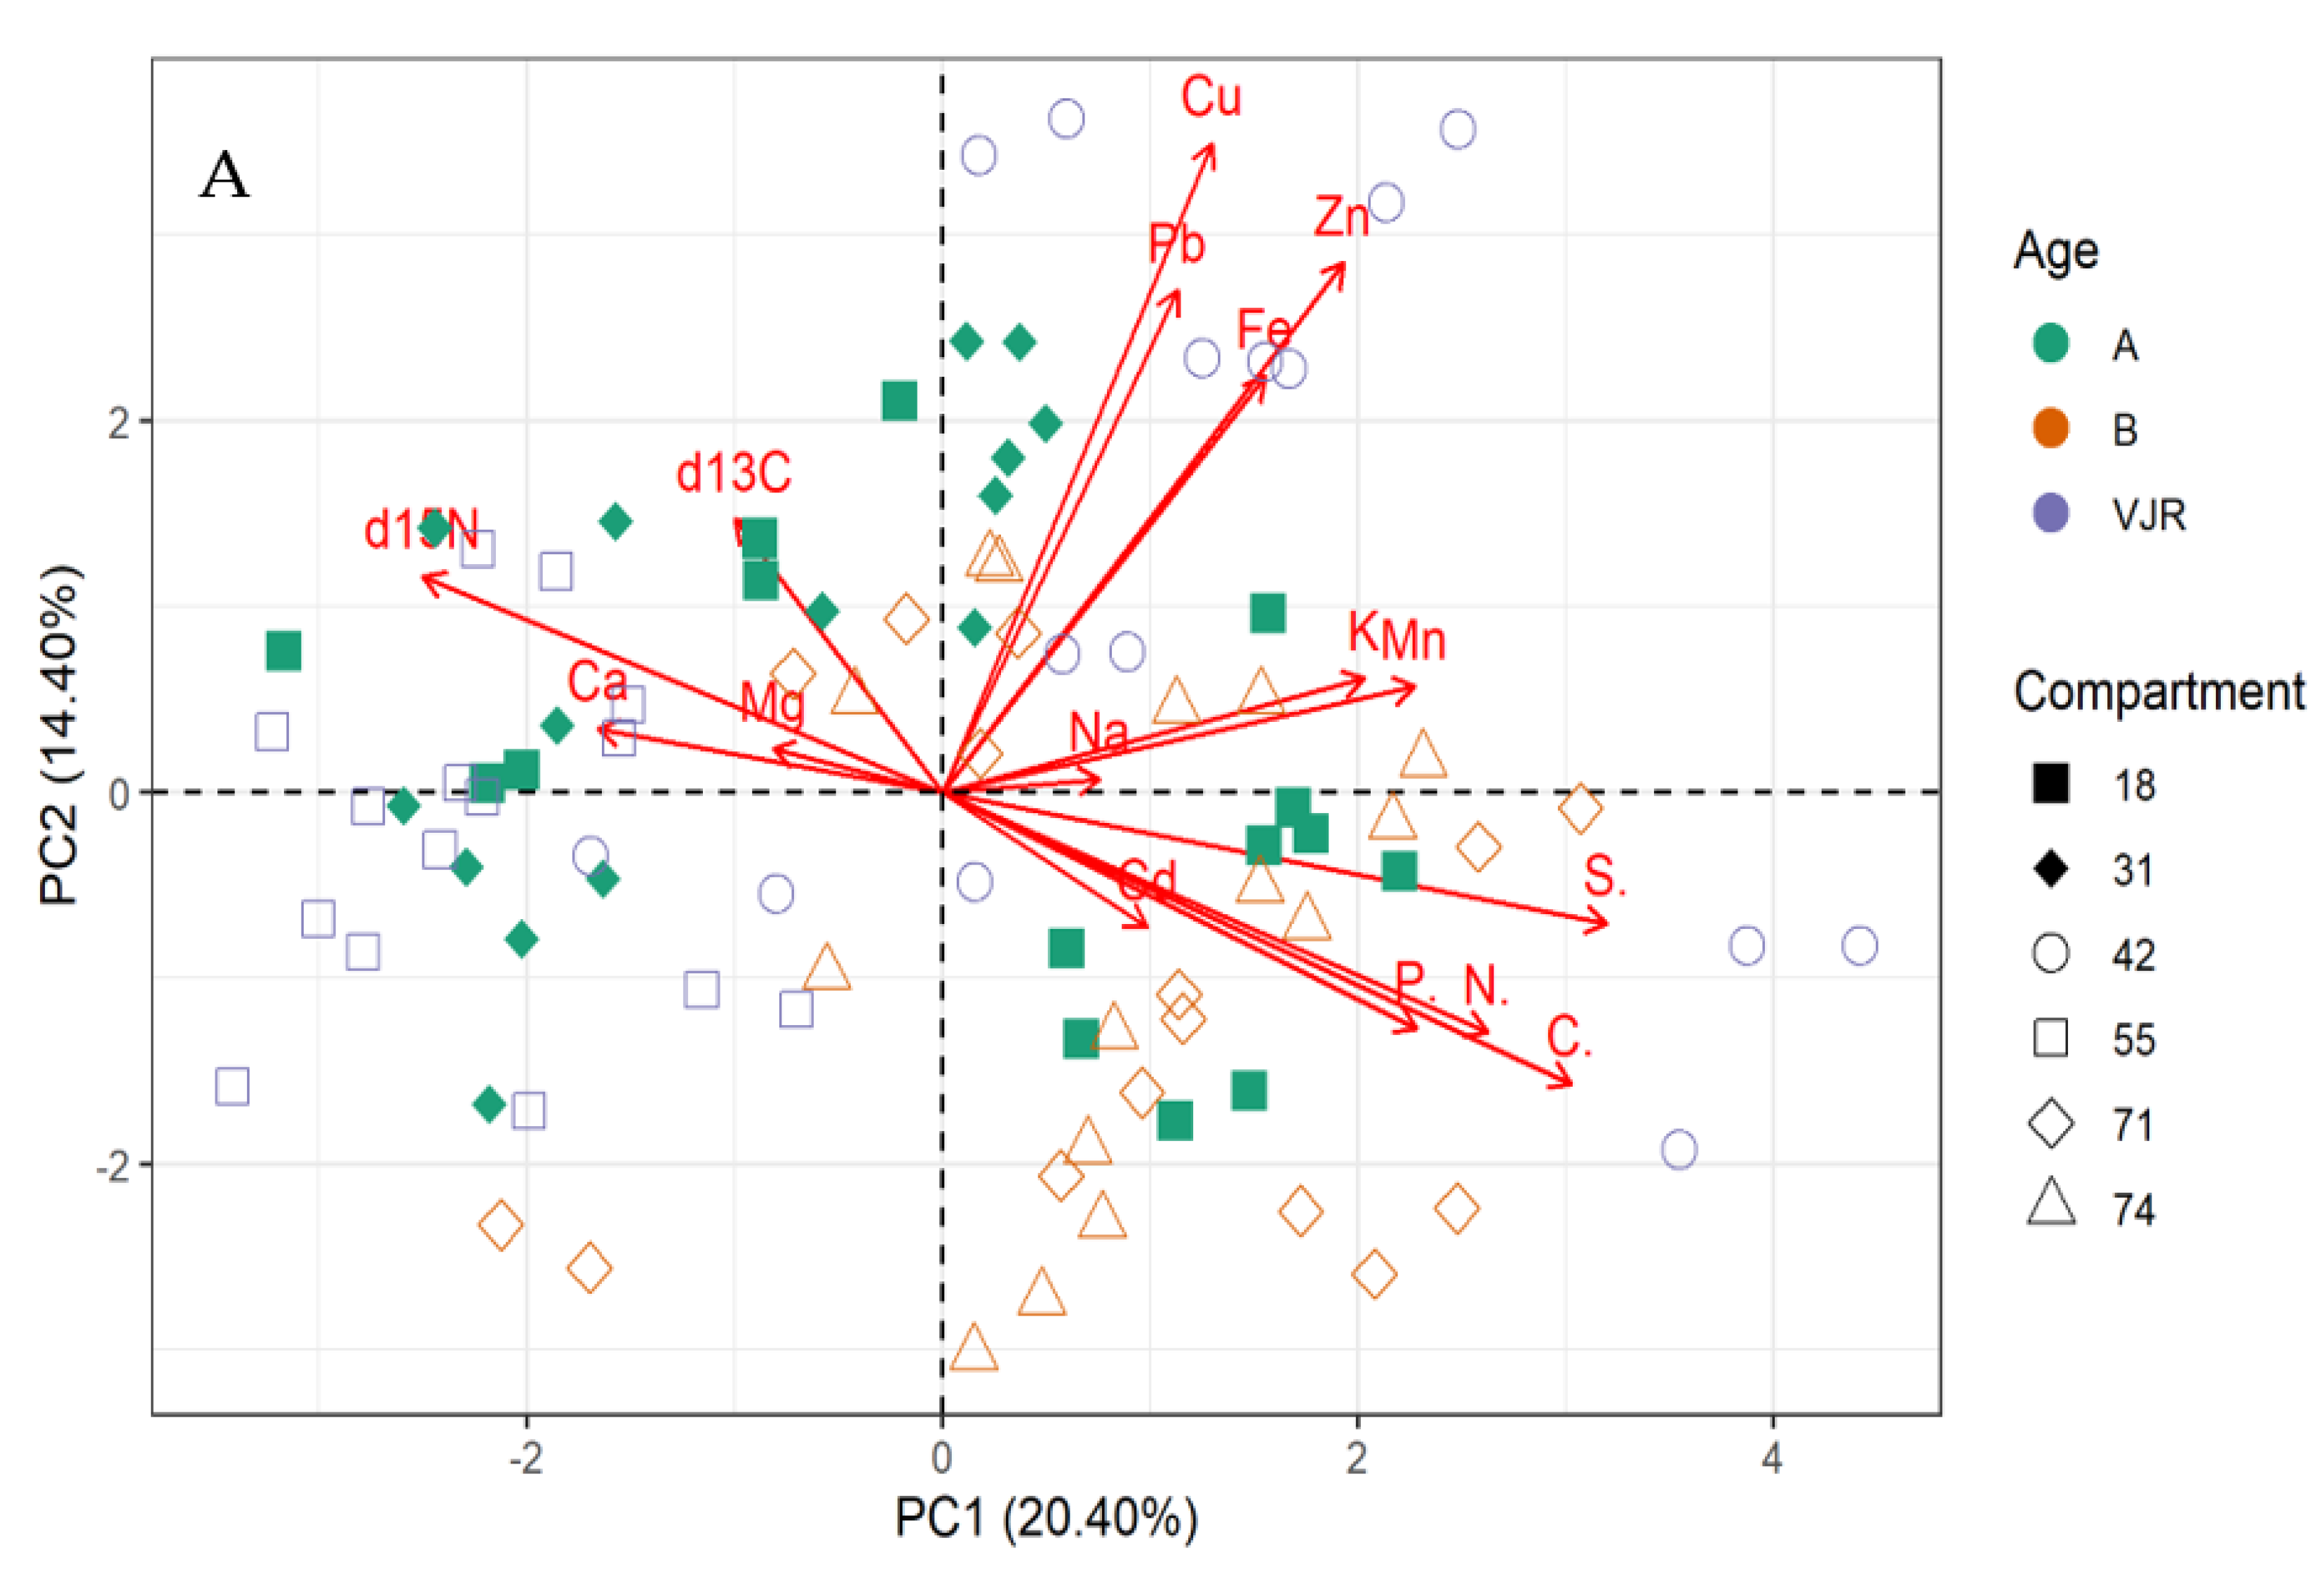
2.2. Multivariate Analysis
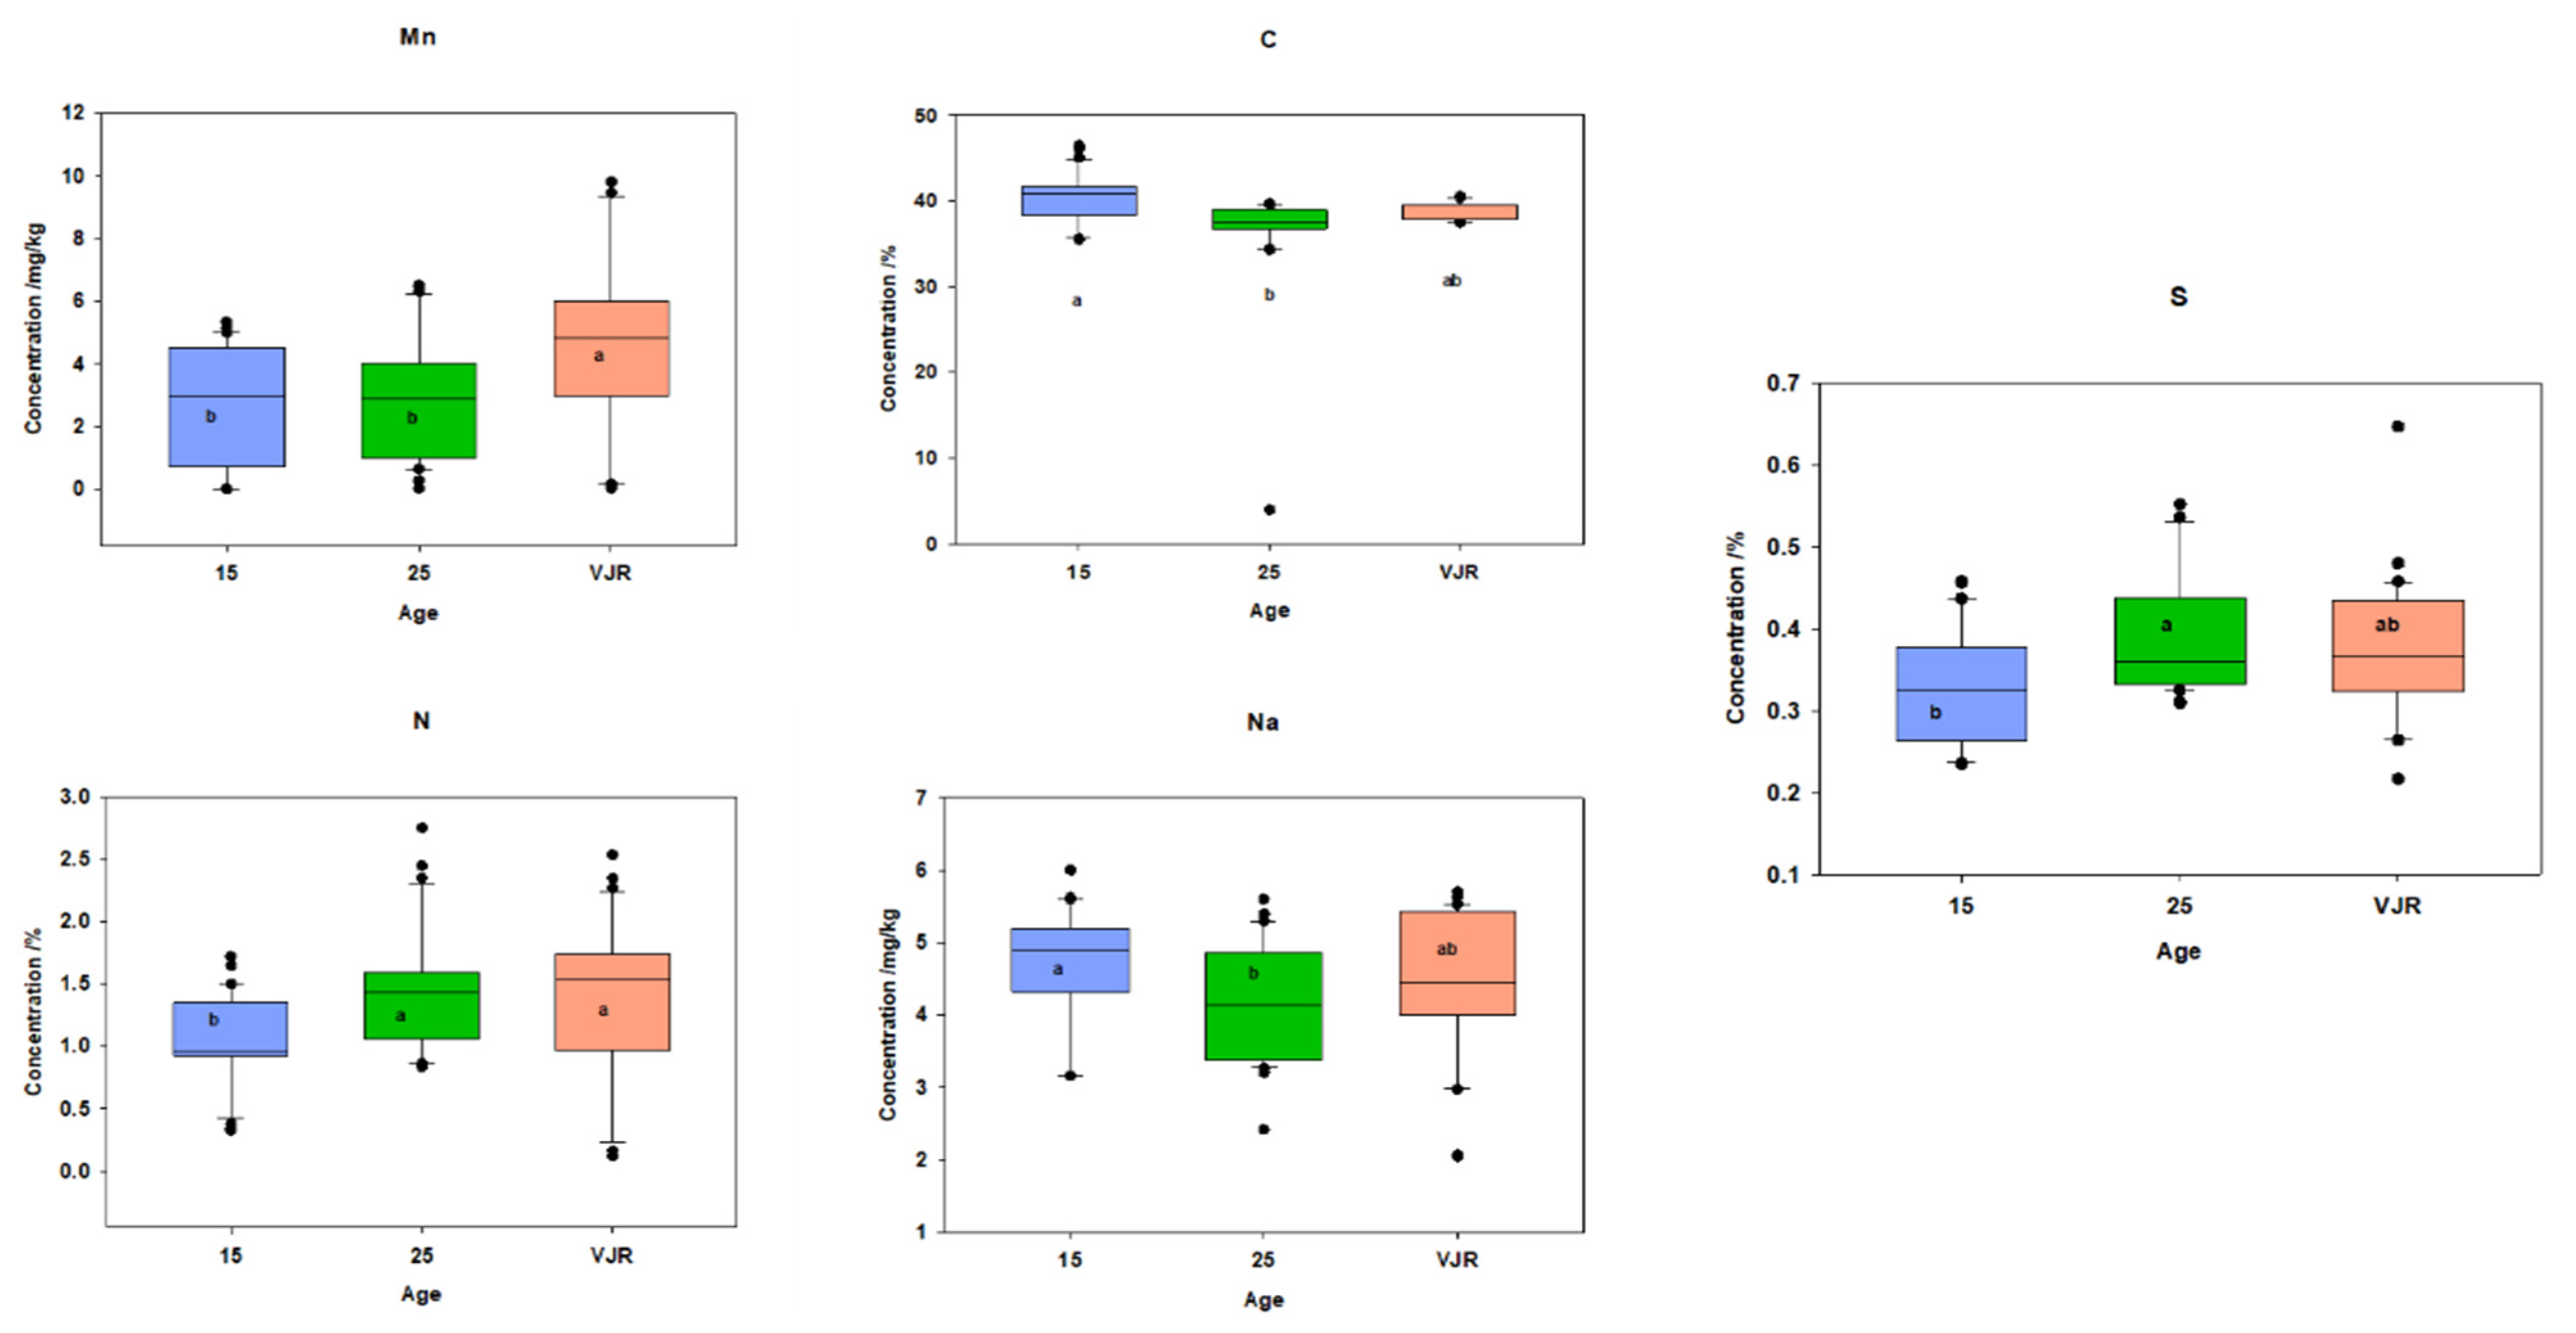
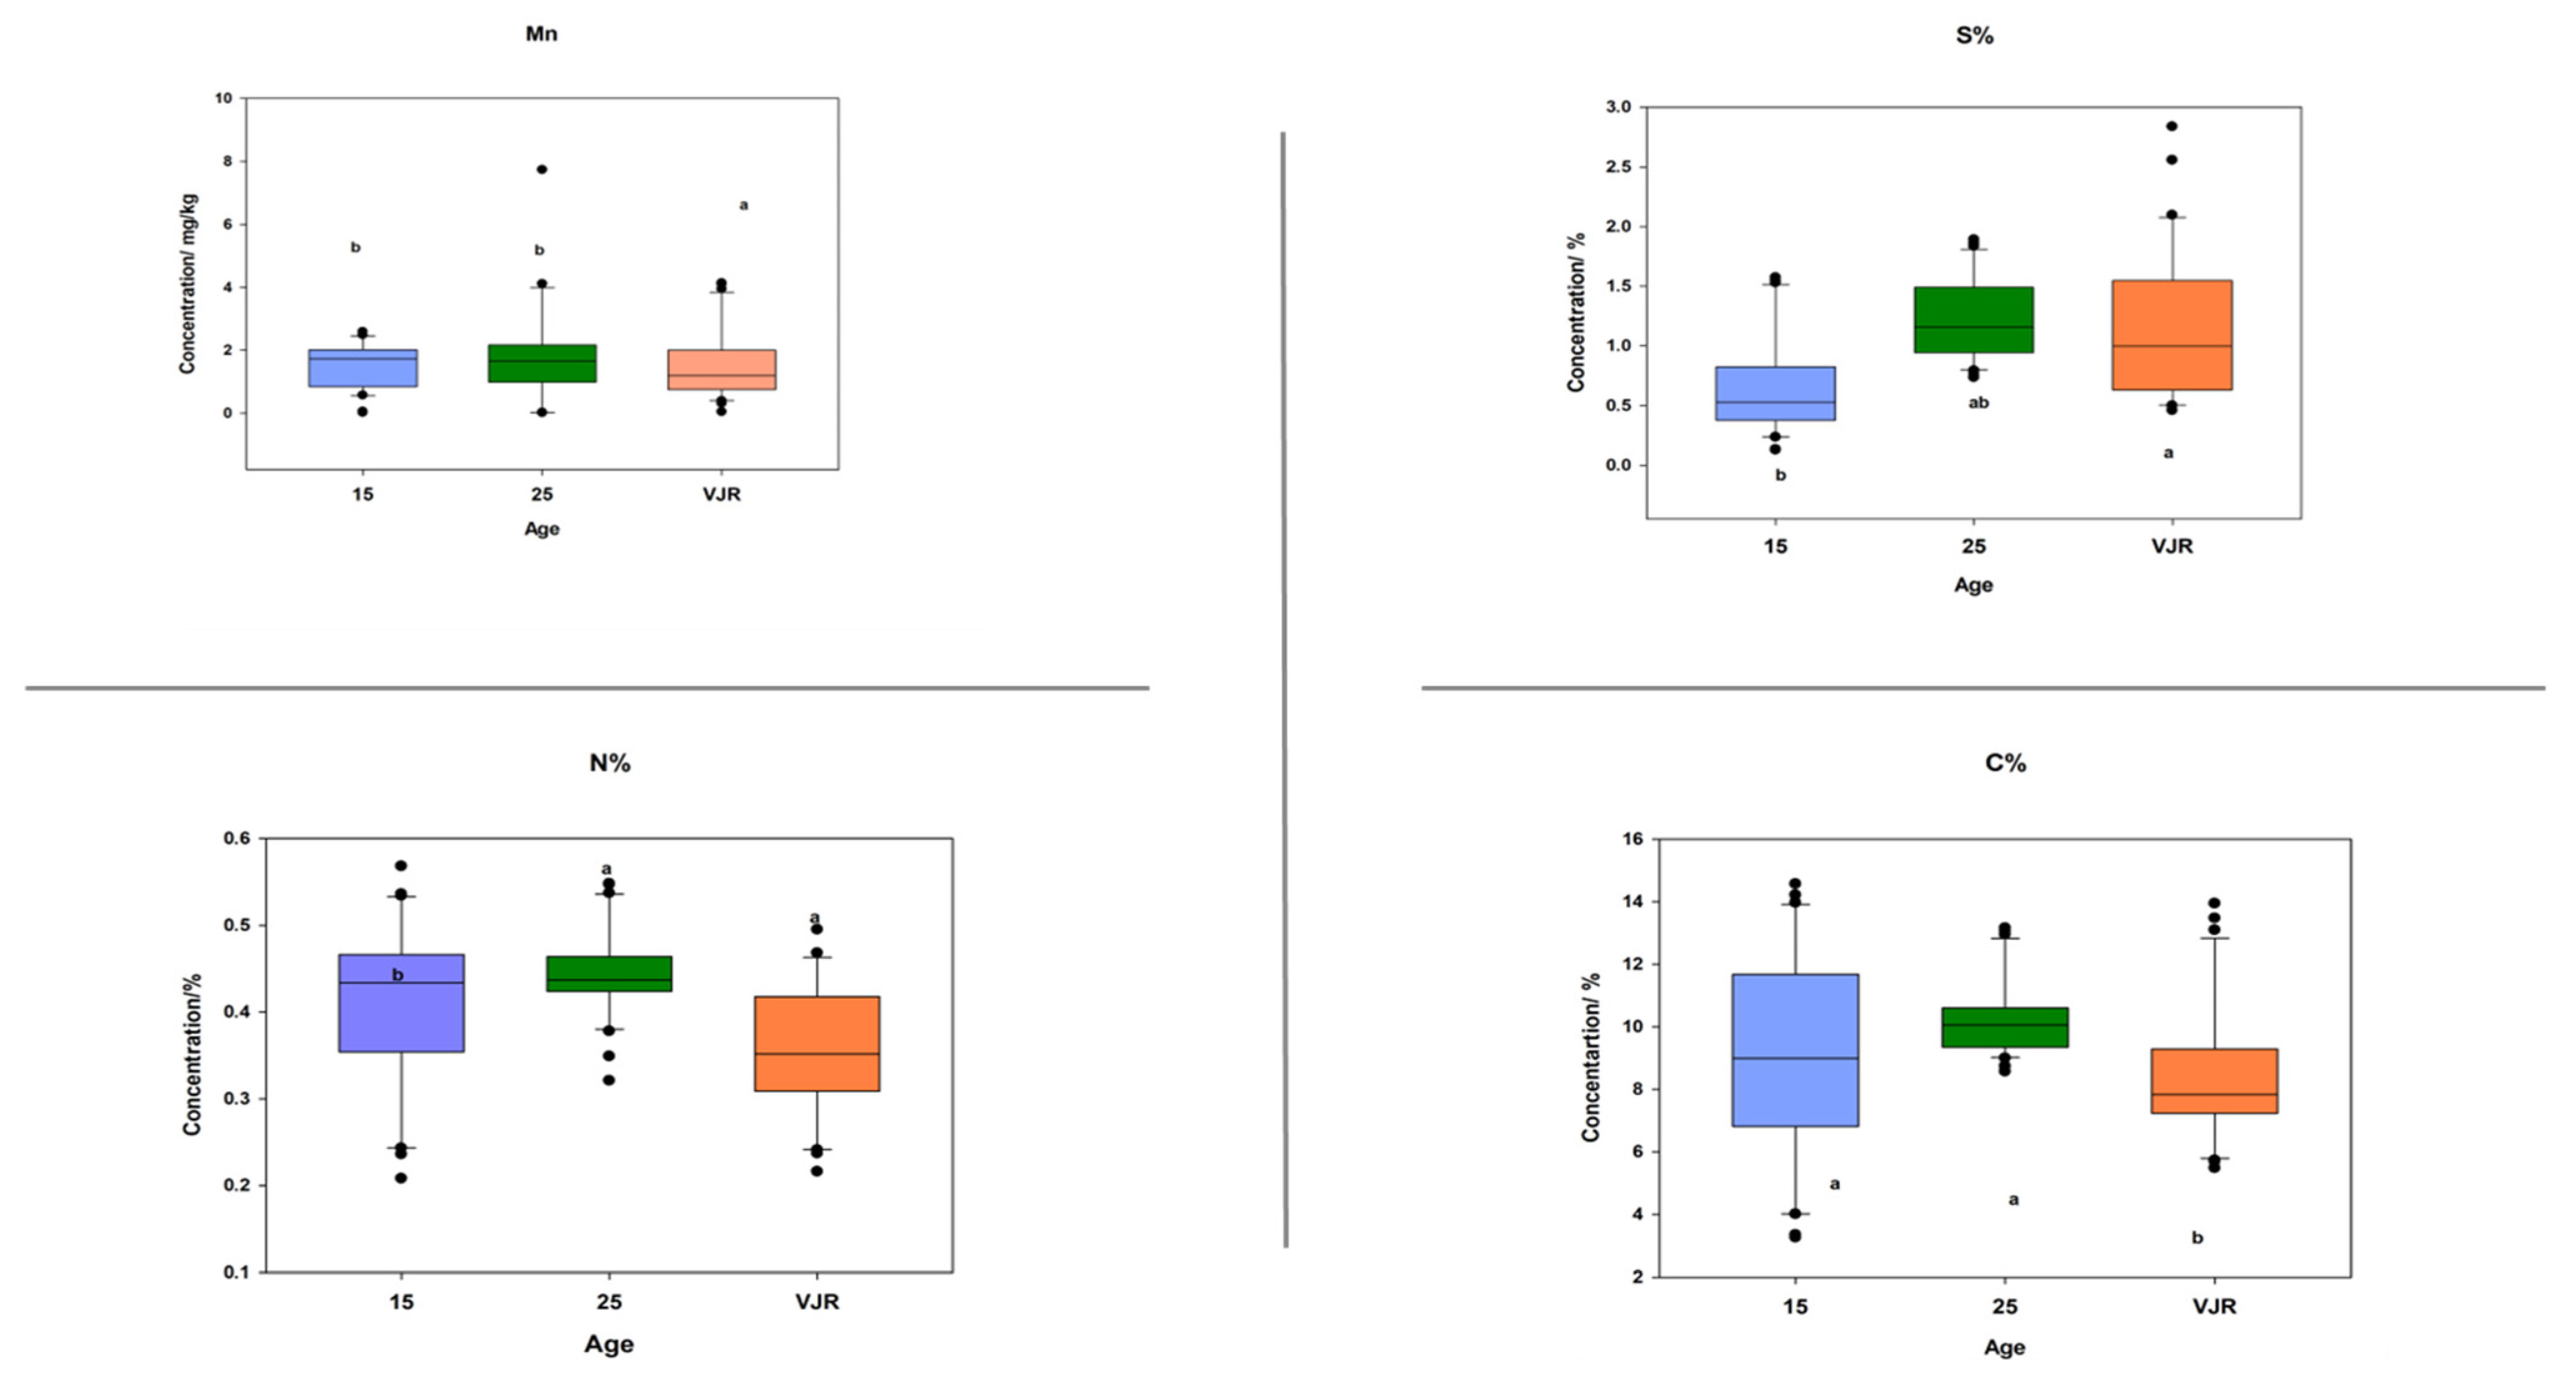
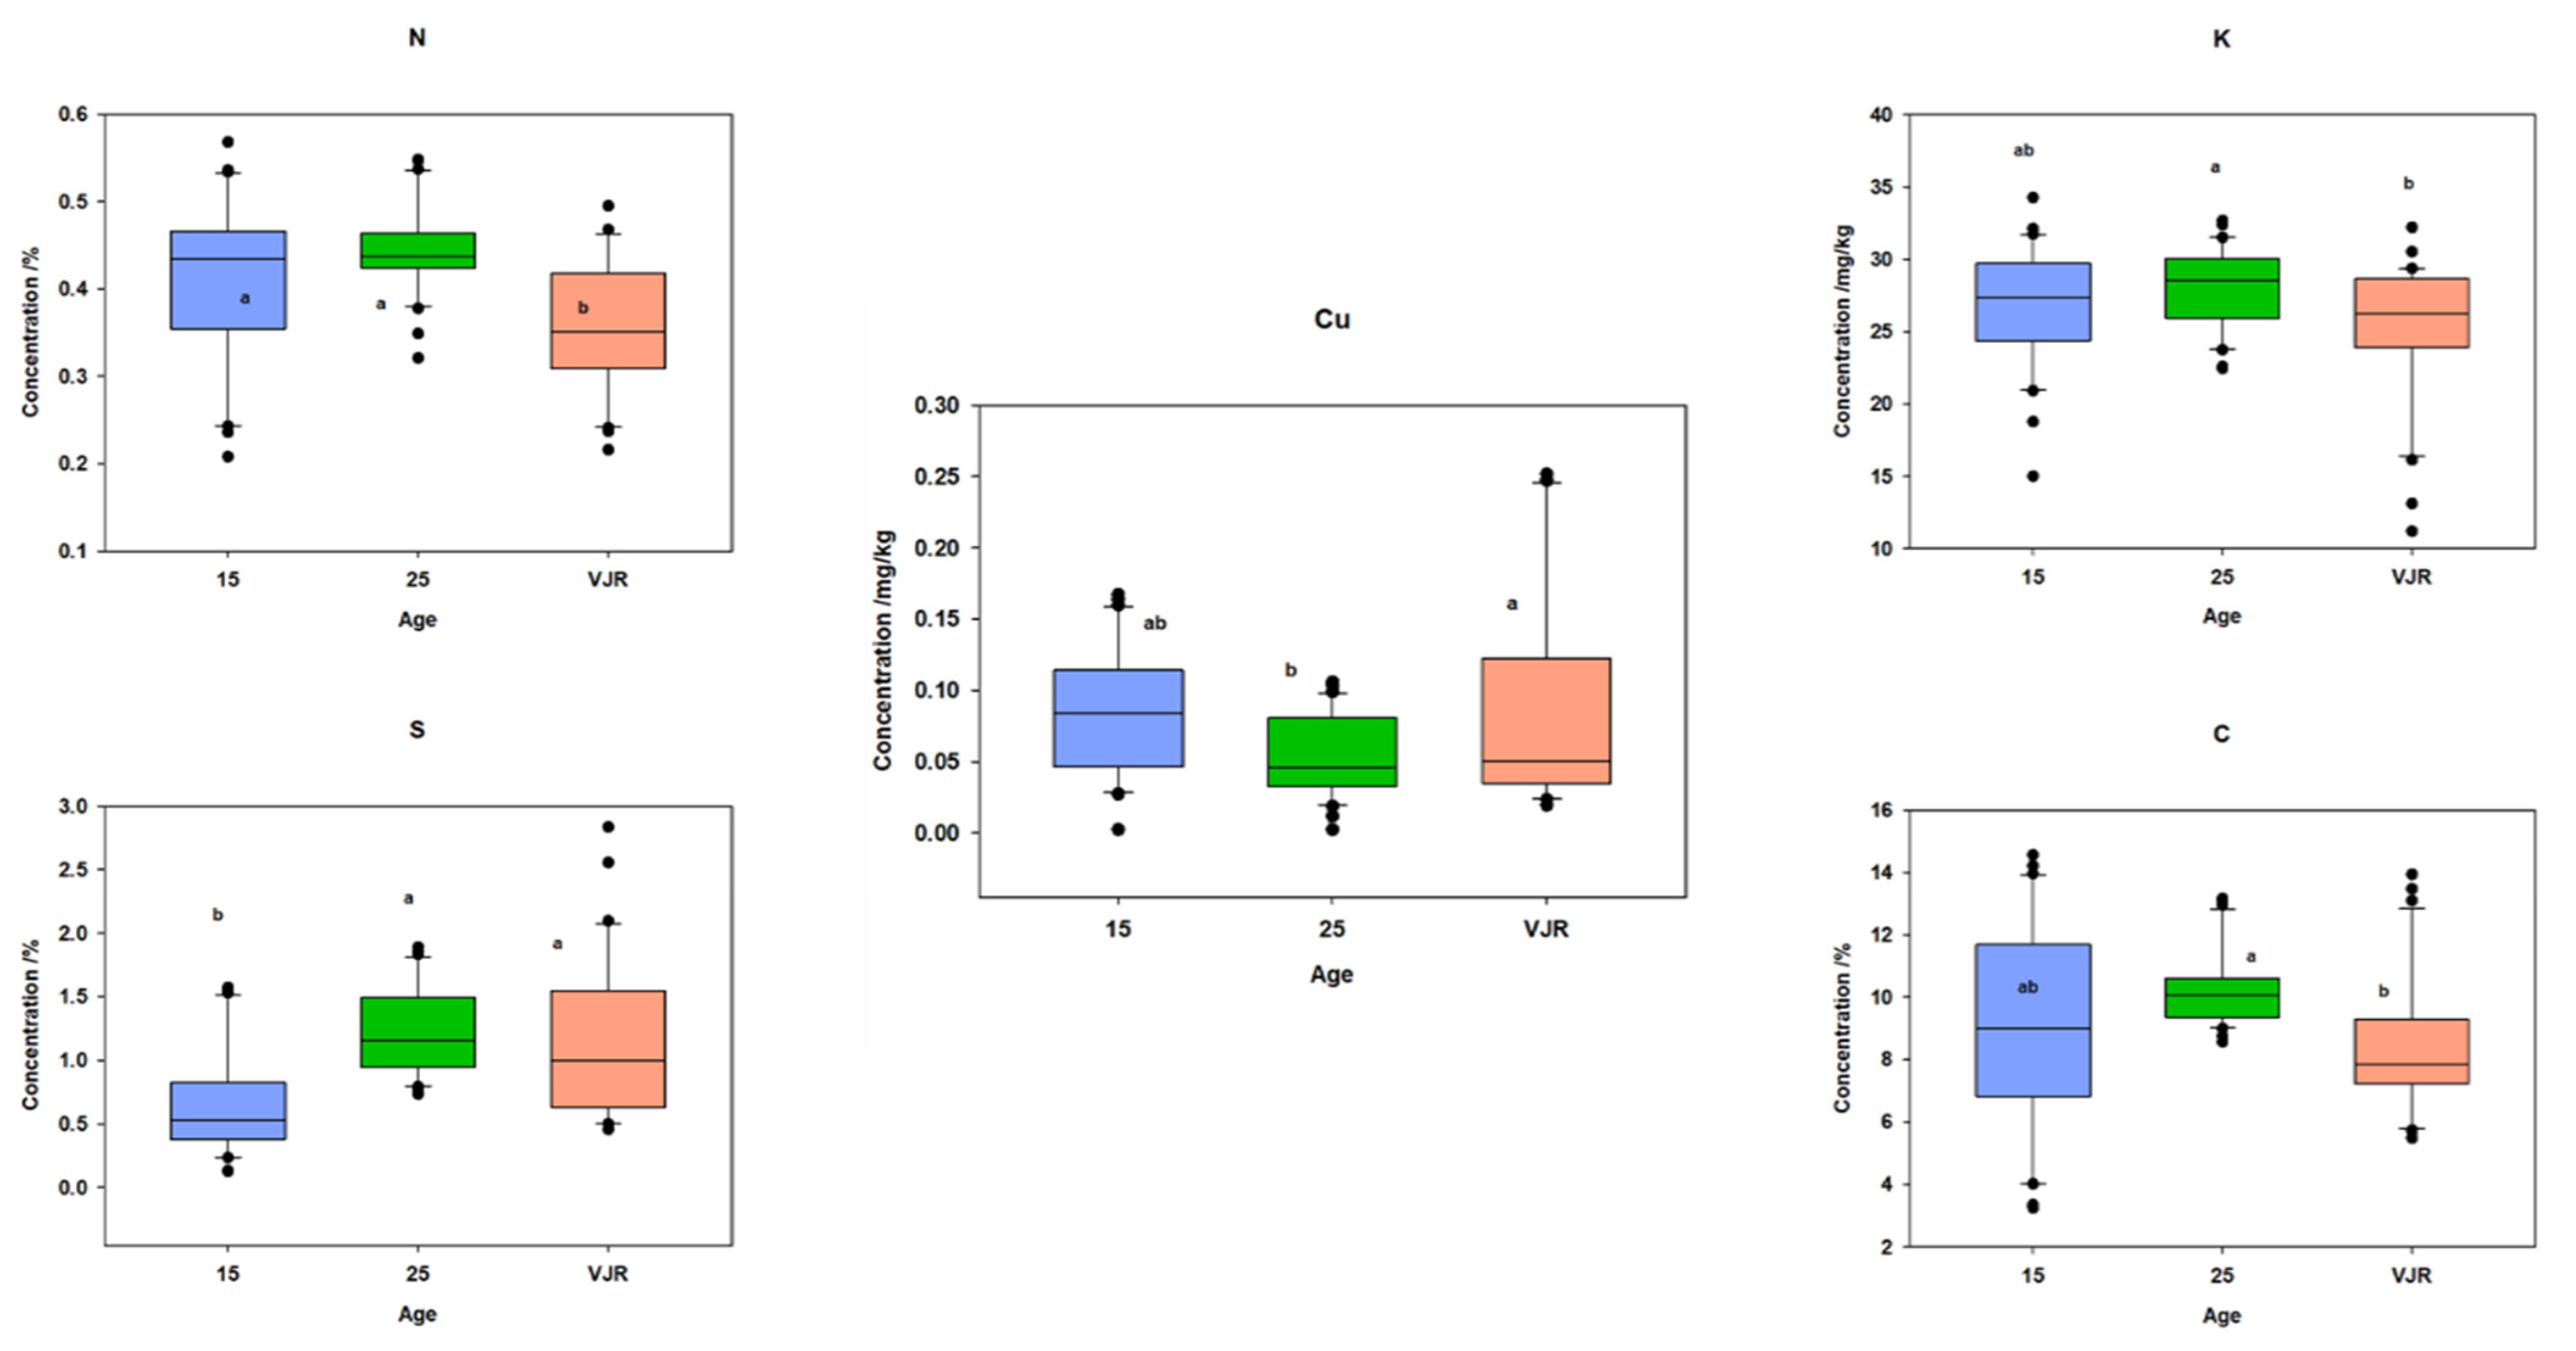
2.3. Elemental Pattern and Mangrove Age
3. Discussion
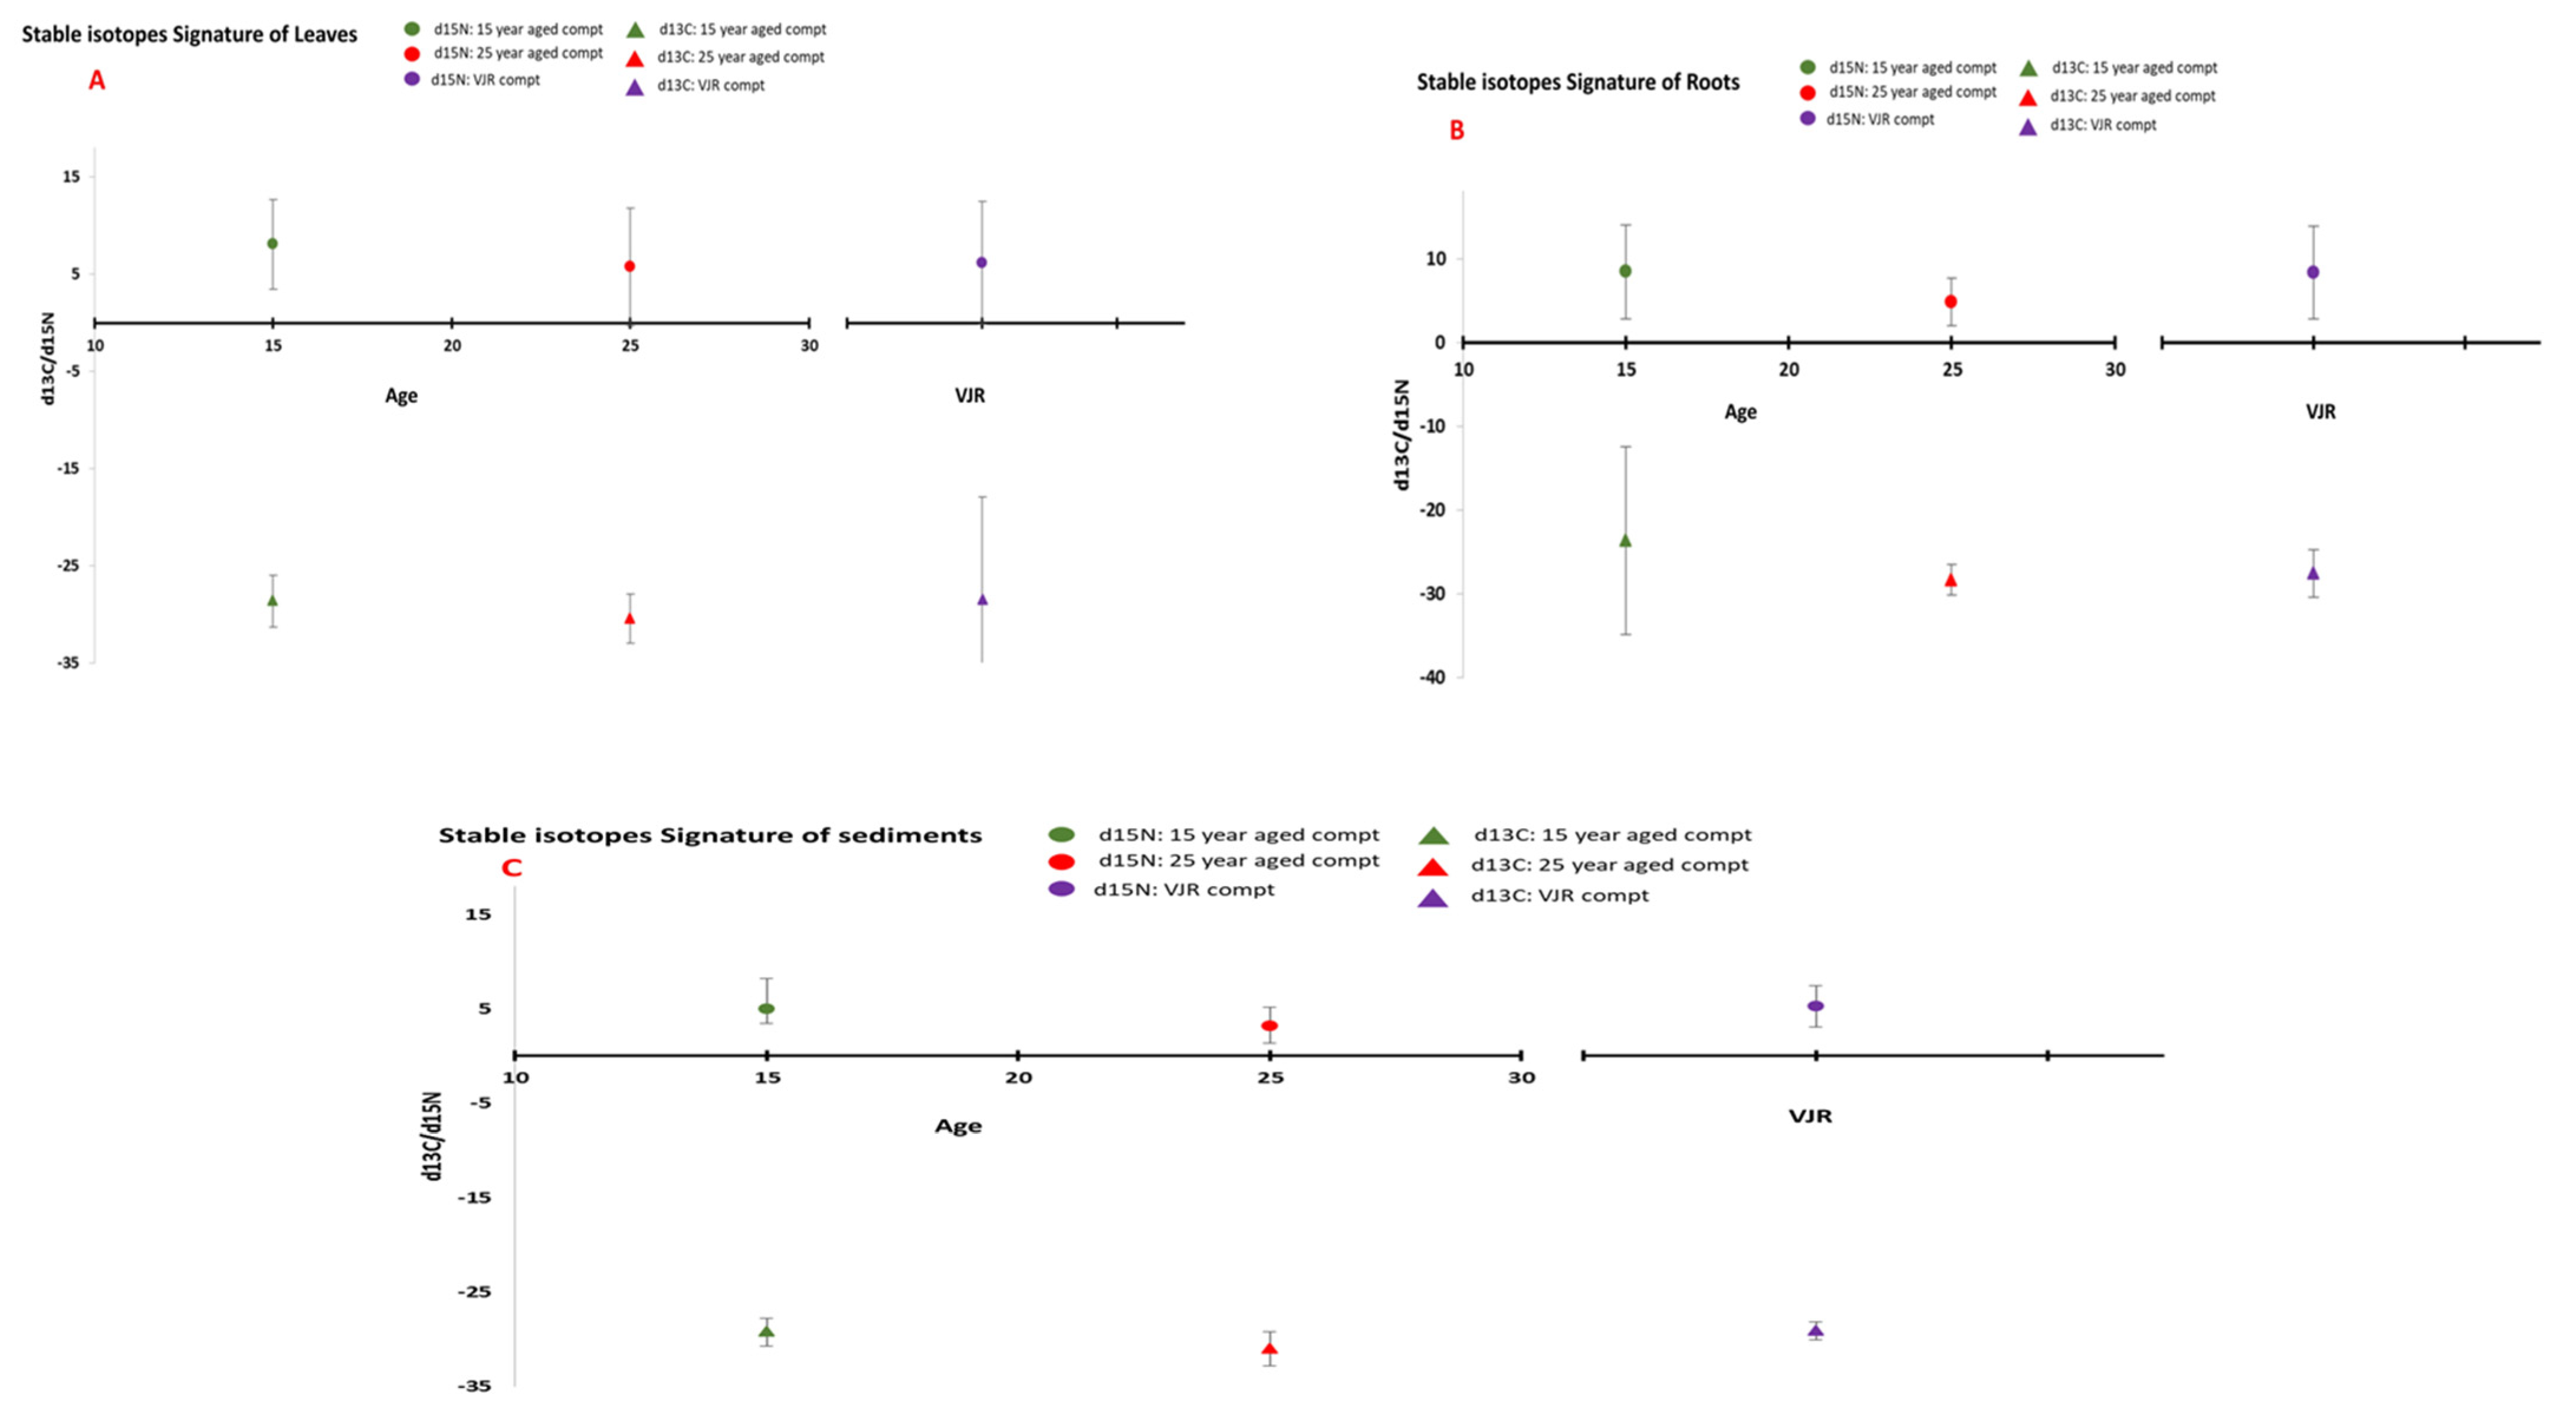
3.1. Stable Isotopes Signatures
3.1.1. Leaves
3.1.2. Roots
3.1.3. Sediment
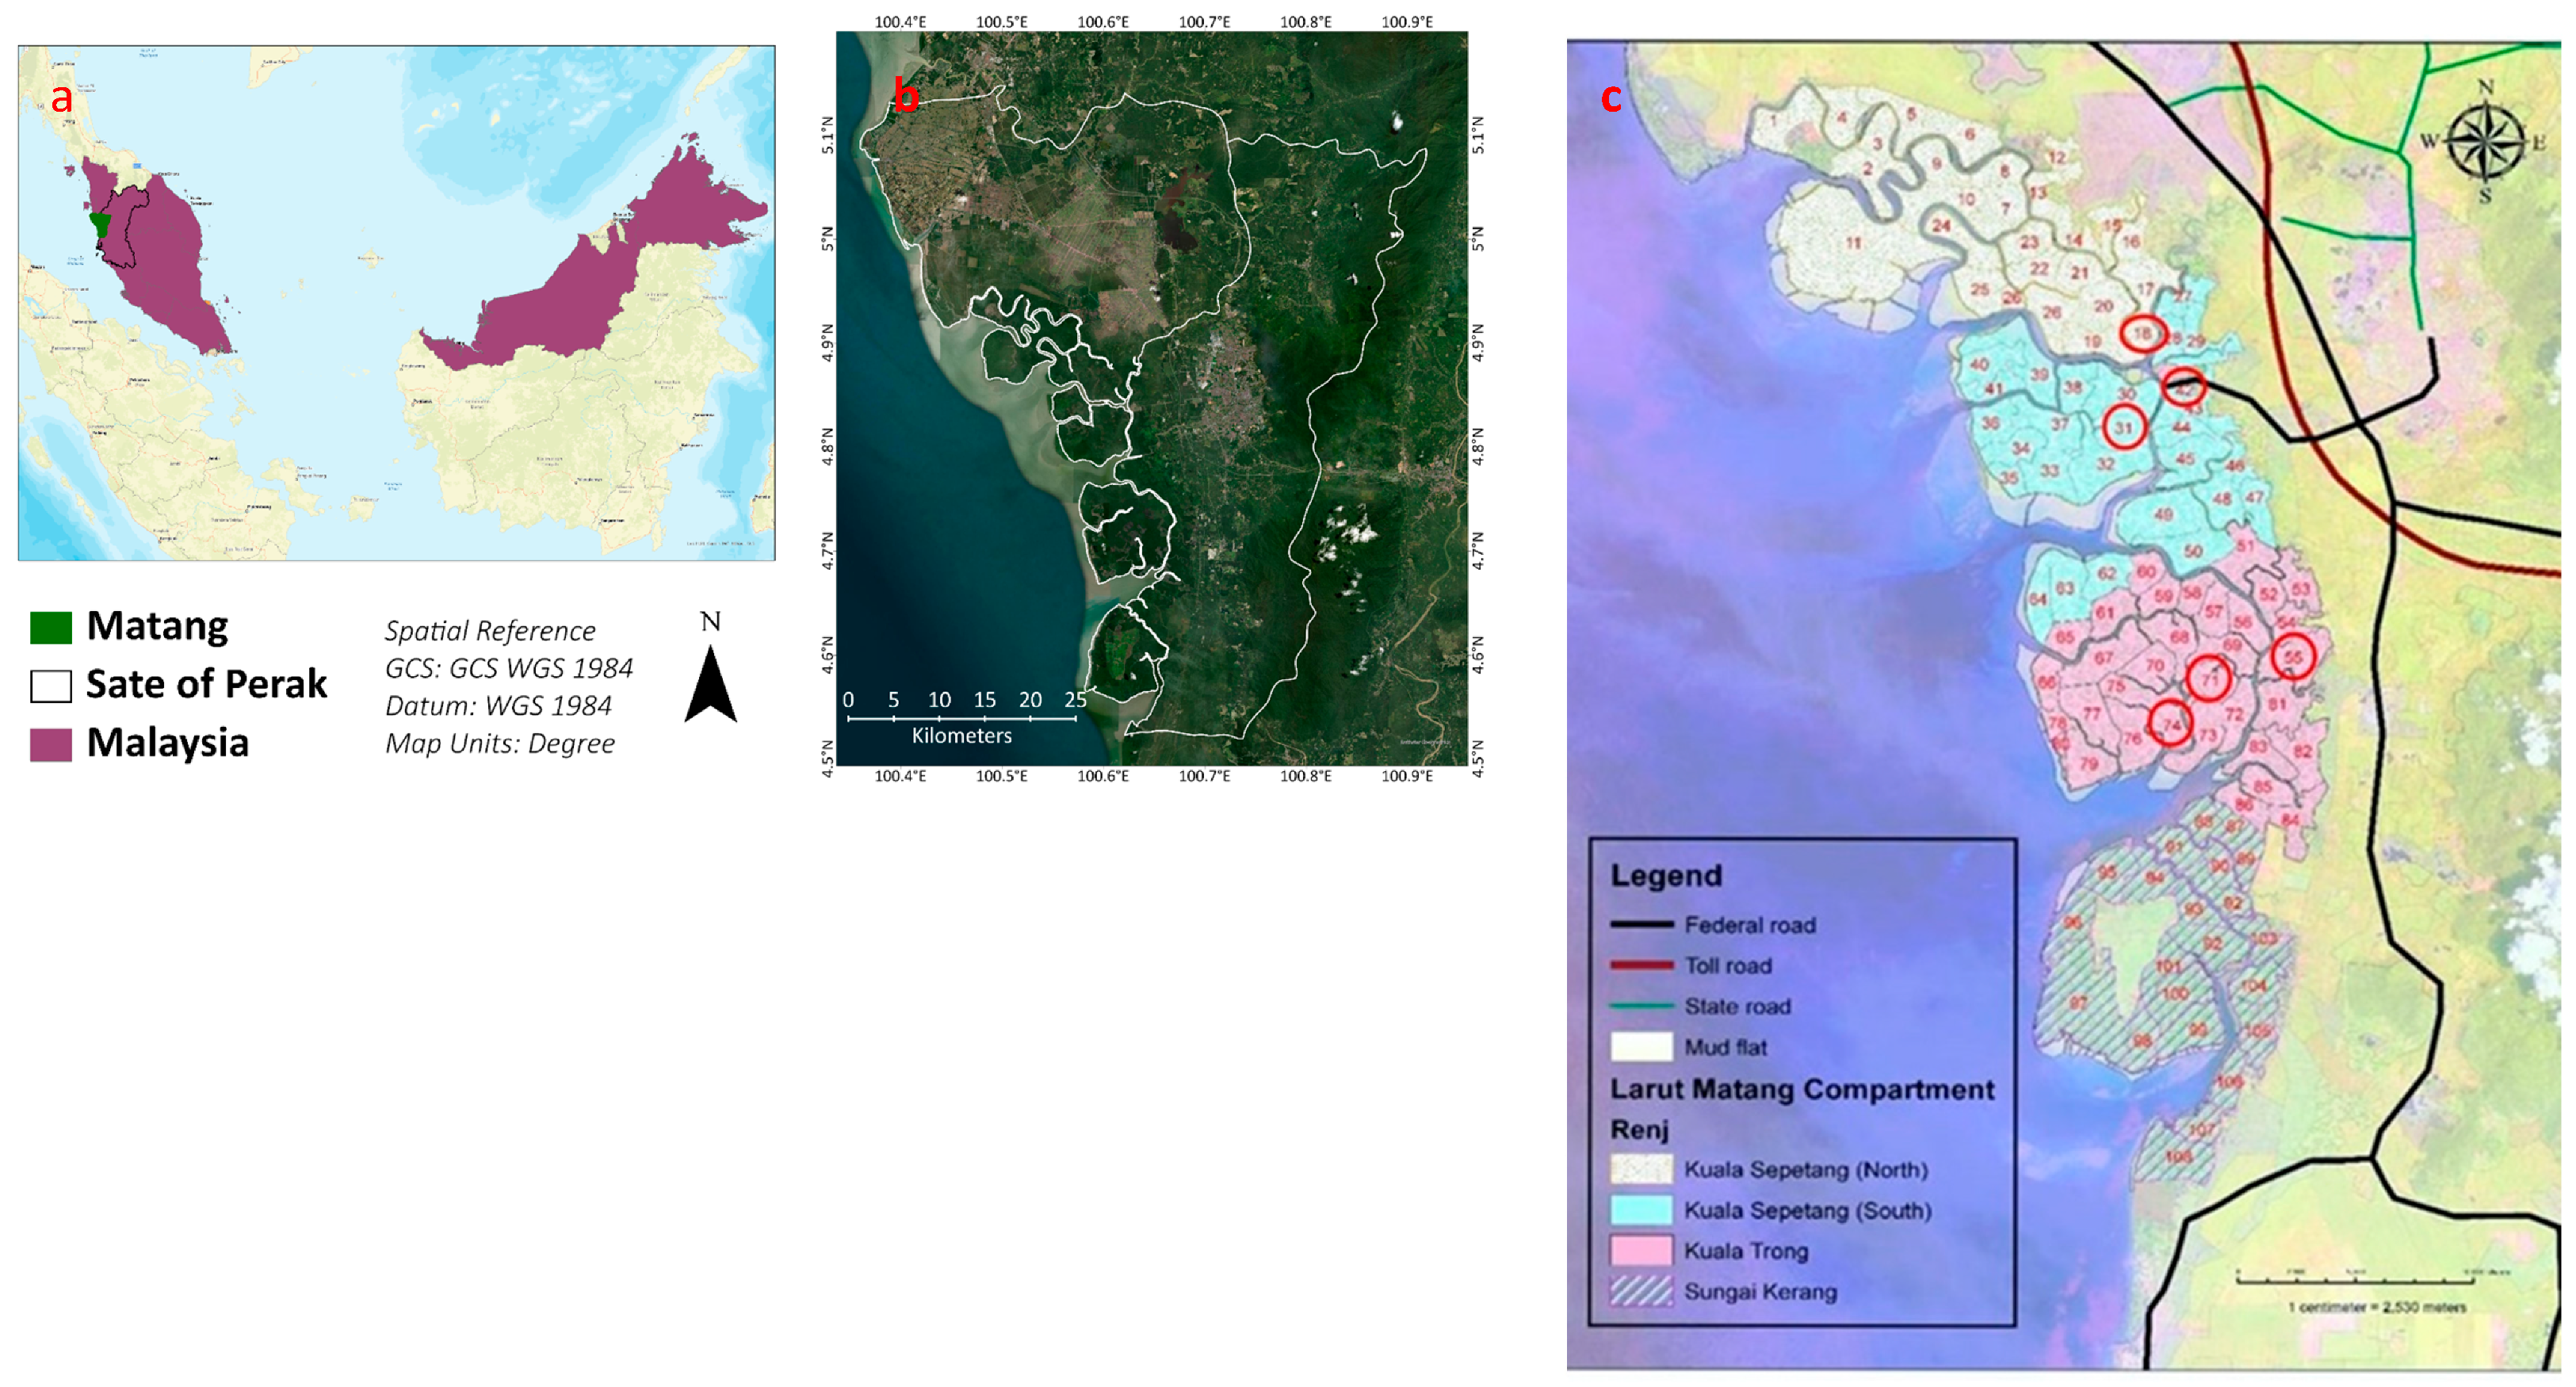
3.2. Sampling Site
3.3. Sample Collection
3.4. Samples Preparation and Chemical Analysis
3.5. Stable Isotopes (13C and 15N) Samples Preparation and Analysis
3.6. Data Analysis
4. Conclusions
Author Contributions
Funding
Institutional Review Board Statement
Informed Consent Statement
Data Availability Statement
Acknowledgments
Conflicts of Interest
References
- Khan, W.; Nazre, M.; Zulkifli, S.; Kudus, K.; Zimmer, M.; Roslan, M.; Mukhtar, A.; Mostapa, R.; Gandaseca, S. Reflection of stable isotopes and selected elements with the inundation gradient at the Matang Mangrove Forest Reserve (MMFR), Malaysia. Int. For. Rev. 2017, 19, 1–10. [Google Scholar] [CrossRef]
- Aljahdali, M.O.; Munawar, S.; Khan, W.R. Monitoring mangrove forest degradation and regeneration: Landsat time series analysis of moisture and vegetation indices at Rabigh Lagoon, Red Sea. Forests 2021, 12, 52. [Google Scholar] [CrossRef]
- Mohamad Pazi, A.M.; Khan, W.R.; Nuruddin, A.A.; Adam, M.B.; Gandaseca, S. Development of Mangrove Sediment Quality Index in Matang Mangrove Forest Reserve, Malaysia: A Synergetic Approach. Forests 2021, 12, 1279. [Google Scholar] [CrossRef]
- Lovelock, C.E.; Feller, I.C.; McKee, K.L.; Thompson, R.C. Variation in mangrove forest structure and sediment characteristics in Bocas del Toro, Panama. Caribb. J. Sci. 2005, 41, 456–464. [Google Scholar]
- Feller, I.C.; Whigham, D.F.; McKee, K.L.; Lovelock, C.E. Nitrogen limitation of growth and nutrient dynamics in a disturbed mangrove forest, Indian River Lagoon, Florida. Oecologia 2003, 134, 405–414. [Google Scholar] [CrossRef]
- Ukpong, I.E. Vegetation and its relation to soil nutrient and salinity in the Calabar mangrove swamp, Nigeria. Mangroves Salt Marshes 1997, 1, 211–218. [Google Scholar] [CrossRef]
- Fry, B.; Cormier, N. Chemical ecology of red mangroves, Rhizophora mangle, in the Hawaiian Islands1. Pac. Sci. 2011, 65, 219–234. [Google Scholar] [CrossRef] [Green Version]
- Feller, I.C.; McKee, K.L.; Whigham, D.F.; O’neill, J.P. Nitrogen vs. phosphorus limitation across an ecotonal gradient in a mangrove forest. Biogeochemistry 2003, 62, 145–175. [Google Scholar] [CrossRef]
- Khan, W.R.; Zulkifli, S.Z.; bin Mohamad Kasim, M.R.; Zimmer, M.; Pazi, A.M.; Kamrudin, N.A.; Rasheed, F.; Zafar, Z.; Mostapa, R.; Nazre, M. Risk Assessment of Heavy Metal Concentrations in Sediments of Matang Mangrove Forest Reserve. Trop. Conserv. Sci. 2020, 13, 1940082920933122. [Google Scholar] [CrossRef]
- Abdullah, F.; Shaari, H.; Satyanarayana, B.; Khalik, W.; Jaafar, M.Z.M. Macro, micro, and non-essential elements in different parts of Rhizophora apiculate. Malays. J. Anal. Sci. 2018, 22, 570–578. [Google Scholar]
- Ryan, M.; Binkley, D.; Fownes, J.H. Age-related decline in forest productivity: Pattern and process. Adv. Ecol. Res. 1997, 27, 213–262. [Google Scholar]
- Alongi, D.; Trott, L.; Wattayakorn, G.; Clough, B. Below-ground nitrogen cycling in relation to net canopy production in mangrove forests of southern Thailand. Mar. Biol. 2002, 140, 855–864. [Google Scholar]
- Alongi, D.; Wattayakorn, G.; Pfitzner, J.; Tirendi, F.; Zagorskis, I.; Brunskill, G.; Davidson, A.; Clough, B. Organic carbon accumulation and metabolic pathways in sediments of mangrove forests in southern Thailand. Mar. Geol. 2001, 179, 85–103. [Google Scholar] [CrossRef]
- Alongi, D.; Wattayakorn, G.; Boyle, S.; Tirendi, F.; Payn, C.; Dixon, P. Influence of roots and climate on mineral and trace element storage and flux in tropical mangrove soils. Biogeochemistry 2004, 69, 105–123. [Google Scholar] [CrossRef]
- Bakshi, M.; Ghosh, S.; Chakraborty, D.; Hazra, S.; Chaudhuri, P. Assessment of potentially toxic metal (PTM) pollution in mangrove habitats using biochemical markers: A case study on Avicennia officinalis L. in and around Sundarban, India. Mar. Pollut. Bull. 2018, 133, 157–172. [Google Scholar] [CrossRef] [PubMed]
- Aljahdali, M.O.; Alhassan, A.B. Ecological risk assessment of heavy metal contamination in mangrove habitats, using biochemical markers and pollution indices: A case study of Avicennia marina L. in the Rabigh lagoon, Red Sea. Saudi J. Biol. Sci. 2020, 27, 1174–1184. [Google Scholar] [CrossRef]
- Alhassan, A.B.; Aljahdali, M.O. Sediment metal contamination, bioavailability, and oxidative stress response in mangrove Avicennia marina in central Red Sea. Front. Environ. Sci. 2021, 9, 185. [Google Scholar] [CrossRef]
- Aljahdali, M.O.; Alhassan, A.B. Spatial variation of metallic contamination and its ecological risk in sediment and freshwater mollusk: Melanoides tuberculata (Müller, 1774) (Gastropoda: Thiaridae). Water 2020, 12, 206. [Google Scholar] [CrossRef] [Green Version]
- Ruiz-Compean, P.; Ellis, J.; Cúrdia, J.; Payumo, R.; Langner, U.; Jones, B.; Carvalho, S. Baseline evaluation of sediment contamination in the shallow coastal areas of Saudi Arabian Red Sea. Mar. Pollut. Bull. 2017, 123, 205–218. [Google Scholar] [CrossRef] [PubMed]
- Van der Oost, R.; Beyer, J.; Vermeulen, N.P. Fish bioaccumulation and biomarkers in environmental risk assessment: A review. Environ. Toxicol. Pharmacol. 2003, 13, 57–149. [Google Scholar] [CrossRef]
- Aljahdali, M.O.; Alhassan, A.B.; Zhang, Z. Environmental Factors Causing Stress in Avicennia marina Mangrove in Rabigh Lagoon Along the Red Sea: Based on a Multi-Approach Study. Front. Sci. 2021, 8. [Google Scholar] [CrossRef]
- Xie, Z.; Zhu, G.; Xu, M.; Zhang, H.; Yi, W.; Jiang, Y.; Liang, M.; Wang, Z. Risk assessment of heavy metals in a typical mangrove ecosystem-A case study of Shankou Mangrove National Natural Reserve, southern China. Mar. Pollut. Bull. 2022, 178, 113642. [Google Scholar] [CrossRef] [PubMed]
- Gu, C.; Zhang, Y.; Peng, Y.; Leng, P.; Zhu, N.; Qiao, Y.; Li, Z.; Li, F. Spatial Distribution and Health Risk Assessment of Dissolved trace elements in Groundwater in southern china. Sci. Rep. 2020, 10, 7886. [Google Scholar] [CrossRef] [PubMed]
- Aljahdali, M.O.; Alhassan, A.B. Rare Earth Elements and Bioavailability in Northern and Southern Central Red Sea Mangroves, Saudi Arabia. Molecules 2022, 27, 4335. [Google Scholar] [CrossRef] [PubMed]
- Harada, Y.; Connolly, R.M.; Fry, B.; Maher, D.T.; Sippo, J.Z.; Jeffrey, L.C.; Bourke, A.J.; Lee, S.Y. Stable isotopes track the ecological and biogeochemical legacy of mass mangrove forest dieback in the Gulf of Carpentaria, Australia. Biogeosciences 2020, 17, 5599–5613. [Google Scholar] [CrossRef]
- McKee, K.L.; Feller, I.C.; Popp, M.; Wanek, W. Mangrove isotopic (δ15N and δ13C) fractionation across a nitrogen vs. phosphorus limitation gradient. Ecology 2002, 83, 1065–1075. [Google Scholar] [CrossRef]
- Santini, N.S.; Reef, R.; Lockington, D.A.; Lovelock, C.E. The use of fresh and saline water sources by the mangrove Avicennia marina. Hydrobiologia 2015, 745, 59–68. [Google Scholar] [CrossRef]
- Hayes, M.A.; Jesse, A.; Welti, N.; Tabet, B.; Lockington, D.; Lovelock, C.E. Groundwater enhances above-ground growth in mangroves. J. Ecol. 2019, 107, 1120–1128. [Google Scholar] [CrossRef]
- Elbasiouny, H.; El-Ramady, H.; Elbehiry, F.; Rajput, V.D.; Minkina, T.; Mandzhieva, S. Plant Nutrition under Climate Change and Soil Carbon Sequestration. Sustainability 2022, 14, 914. [Google Scholar] [CrossRef]
- Passos, T.; Penny, D.; Sanders, C.; De França, E.; Oliveira, T.; Santos, L.; Barcellos, R. Mangrove carbon and nutrient accumulation shifts driven by rapid development in a tropical estuarine system, northeast Brazil. Mar. Pollut. Bull. 2021, 166, 112219. [Google Scholar] [CrossRef]
- Alhassan, A.B.; Aljahdali, M.O. Nutrient and physicochemical properties as potential causes of stress in mangroves of the central Red Sea. PLoS ONE 2021, 16, e0261620. [Google Scholar] [CrossRef]
- Khan, W.R.; Zulkifli, S.Z.; Kasim, M.R.B.; Pazi, A.M.; Mostapa, R.; Nazre, M. Mangrove productivity estimation using modelling approach and tree parameters assessment. Trop. Conserv. Sci. 2019, 12, 1940082919872137. [Google Scholar] [CrossRef]
- Gritcan, I.; Duxbury, M.; Leuzinger, S.; Alfaro, A.C. Leaf stable isotope and nutrient status of temperate mangroves as ecological indicators to assess anthropogenic activity and recovery from eutrophication. Front. Plant Sci. 2016, 7, 1922. [Google Scholar] [CrossRef] [PubMed] [Green Version]
- Almahasheer, H.; Duarte, C.M.; Irigoien, X. Leaf nutrient resorption and export fluxes of Avicennia marina in the Central Red Sea area. Front. Mar. Sci. 2018, 5, 204. [Google Scholar] [CrossRef]
- Bourgeois, C.; Alfaro, A.C.; Dencer-Brown, A.; Duprey, J.L.; Desnues, A.; Marchand, C. Stocks and soil-plant transfer of macro-nutrients and trace metals in temperate New Zealand estuarine mangroves. Plant Soil 2019, 436, 565–586. [Google Scholar] [CrossRef]
- Silva, C.A.R.; Lacerda, L.D.; Rezende, C.E. Metals reservoir in a red mangrove forest. Biotropica 1990, 22, 339–345. [Google Scholar] [CrossRef]
- Jayasekera, R. Chemical composition of the mangrove, Rhizophora mangle L. J. Plant Physiol. 1991, 138, 119–121. [Google Scholar] [CrossRef]
- Yan, X.; Liu, M.; Zhong, J.; Guo, J.; Wu, W. How human activities affect heavy metal contamination of soil and sediment in a long-term reclaimed area of the Liaohe River Delta, North China. Sustainability 2018, 10, 338. [Google Scholar] [CrossRef] [Green Version]
- Aerts, R.; Chapin III, F.S. The Mineral Nutrition of Wild Plants Revisited: A Re-evaluation of Processes and Patterns. In Advances in Ecological Research; Elsevier: Amsterdam, The Netherlands, 1999; Volume 30, pp. 1–67. [Google Scholar]
- Harun, N.; Nurhidayu, S.; Roslan, K. Water Quality Characteristics in Relation to Mangrove Disturbance Levels. In Proceedings of the International Conference on Sustainable Forest Development in View of Climate Change (SFDCC2016), Putrajaya, Malaysia, 8–11 August 2016. [Google Scholar]
- Alongi, D.M. The impact of climate change on mangrove forests. Curr. Clim. Change Rep. 2015, 1, 30–39. [Google Scholar] [CrossRef]
- Tognella, M.; Soares, M.; Cuevas, E.; Medina, E. Heterogeneity of elemental composition and natural abundance of stables isotopes of C and N in soils and leaves of mangroves at their southernmost West Atlantic range. Braz. J. Biol. 2016, 76, 994–1003. [Google Scholar] [CrossRef] [Green Version]
- Craine, J.M.; Elmore, A.J.; Aidar, M.P.; Bustamante, M.; Dawson, T.E.; Hobbie, E.A.; Kahmen, A.; Mack, M.C.; McLauchlan, K.K.; Michelsen, A. Global patterns of foliar nitrogen isotopes and their relationships with climate, mycorrhizal fungi, foliar nutrient concentrations, and nitrogen availability. New Phytol. 2009, 183, 980–992. [Google Scholar] [CrossRef] [PubMed]
- Bouillon, S.; Connolly, R.; Lee, S. Organic matter exchange and cycling in mangrove ecosystems: Recent insights from stable isotope studies. J. Sea Res. 2008, 59, 44–58. [Google Scholar] [CrossRef] [Green Version]
- Srikanth, S.; Lum, S.K.Y.; Chen, Z. Mangrove root: Adaptations and ecological importance. Trees 2016, 30, 451–465. [Google Scholar] [CrossRef]
- Ellison, A.M.; Farnsworth, E.J.; Twilley, R.R. Facultative mutualism between red mangroves and root-fouling sponges in Belizean mangal. Ecology 1996, 77, 2431–2444. [Google Scholar] [CrossRef]
- Huxham, M.; Langat, J.; Tamooh, F.; Kennedy, H.; Mencuccini, M.; Skov, M.W.; Kairo, J. Decomposition of mangrove roots: Effects of location, nutrients, species identity and mix in a Kenyan forest. Estuar. Coast. Shelf Sci. 2010, 88, 135–142. [Google Scholar] [CrossRef] [Green Version]
- Ember, L.; Williams, D.; Morris, J. Processes that influence carbon isotope variations in salt marsh sediments. Mar. Ecol. Prog. Ser. 1987, 36, 33–42. [Google Scholar] [CrossRef]
- Lacerda, L.D.; Rezende, C.D.; Martinelli, L.; Ovalle, A.; Mozeto, A.; Nogueira, F.; Victoria, R.; Aragon, G.; Cunha, C.D.; Souza, C. Composição isotópica de carbono em componentes de um ecossistema de manguezal na Baía de Sepetiba, Rio de Janeiro. Ciênc. Cult. 1986, 38, 1714–1717. [Google Scholar]
- Martinelli, L.; Piccolo, M.; Townsend, A.; Vitousek, P.; Cuevas, E.; McDowell, W.; Robertson, G.; Santos, O.; Treseder, K. Nitrogen stable isotopic composition of leaves and soil: Tropical versus temperate forests. Biogeochemistry 1999, 46, 45–65. [Google Scholar] [CrossRef] [Green Version]
- Khan, W.R.; Rasheed, F.; Zulkifli, S.Z.; Kasim, M.R.b.M.; Zimmer, M.; Pazi, A.M.; Kamrudin, N.A.; Zafar, Z.; Faridah-Hanum, I.; Nazre, M. Phytoextraction potential of Rhizophora apiculata: A case study in Matang mangrove forest reserve, Malaysia. Trop. Conserv. Sci. 2020, 13, 1940082920947344. [Google Scholar] [CrossRef]
- Zulkifli, S.Z.; Mohamat-Yusuff, F.; Mukhtar, A.; Ismail, A.; Miyazaki, N. Biomagnification of selected toxic trace elements (Cr, As, Cd, Pb) in a mangrove ecosystem: Insights from stable isotope analysis. Pollut. Res. 2016, 35, 211–219. [Google Scholar]
- Dick, W.; Tabatabai, M. Determination of Orthophosphate in Aqueous Solutions Containing Labile Organic and Inorganic Phosphorus Compounds; Wiley Online Library: Hoboken, NJ, USA, 1977; pp. 47–2425. [Google Scholar]
- Nakamura, Y.; Horinouchi, M.; Shibuno, T.; Tanaka, Y.; Miyajima, T.; Koike, I.; Kurokura, H.; Sano, M. Evidence of ontogenetic migration from mangroves to coral reefs by black-tail snapper Lutjanus fulvus: Stable isotope approach. Mar. Ecol. Prog. Ser. 2008, 355, 257–266. [Google Scholar] [CrossRef]


| Compartment 18 n = 15 | Compartment 31 n = 15 | Compartment 71 n = 15 | Compartment 74 n = 15 | Compartment 42 n = 15 | Compartment 55 n = 15 | ||||||||
|---|---|---|---|---|---|---|---|---|---|---|---|---|---|
| Parameter | Units | Mean | 95%CL | Mean | 95%CL | Mean | 95%CL | Mean | 95%CL | Mean | 95%CL | Mean | 95%CL |
| δ15N | ‰ | 7.52 a | 3.005 | 8.67 a | 2.06 | 7.92 a | 4.37 | 3.57 a | 1.23 | 5.03 a | 2.28 | 7.07 a | 3.71 |
| δ13C | ‰ | −27.90 a | 1.9 | −29.34 a | 0.78 | −30.54 a | 1.97 | −30.37 a | 0.36 | −31.43 a | 6.17 | −29.67 a | 2.22 |
| Cd | mg/kg | 0.0046 b | 0.0020 | 0.016 a | 0.002 | 0.0107 a | 0.003 | 0.0098 ab | 0.004 | 0.006 ab | 0.004 | 0.0135 a | 0.005 |
| Cu | mg/kg | 0.107 c | 0.007 | 0.052 abc | 0.016 | 0.067 ab | 0.025 | 0.117 bc | 0.013 | 0.085 bc | 0.024 | 0.076 a | 0.021 |
| Fe | mg/kg | 2.156 a | 1.036 | 7.116 a | 4.63 | 2.59 a | 1.18 | 1.505 a | 0.731 | 3.75 a | 1.88 | 2.145 a | 1.60 |
| K | mg/kg | 29.40 a | 2.33 | 31.04 a | 1.64 | 29.41 a | 1.61 | 27.17 a | 4.07 | 30.70 a | 1.76 | 29.81 a | 3.29 |
| Mg | mg/kg | 1.78 a | 0.13 | 1.85 a | 0.08 | 1.84 a | 0.08 | 1.65 a | 0.17 | 1.82 a | 0.1 | 1.82 a | 0.01 |
| Mn | mg/kg | 2.03 b | 0.088 | 3.14 ab | 1.17 | 3.57 ab | 1.26 | 2.30 b | 0.75 | 5.36 a | 2.07 | 4.14 a | 0.89 |
| Pb | mg/kg | 0.046 c | 0.18 | 0.11 ab | 0.037 | 0.143 a | 0.026 | 0.071 bc | 0.03 | 0.066 bc | 0.034 | 0.099 bc | 0.03 |
| Zn | mg/kg | 0.428 b | 0.127 | 0.757 a | 0.164 | 0.536 ab | 0.162 | 0.382 b | 0.126 | 0.573 ab | 0.239 | 0.445 b | 0.1 |
| Na | mg/kg | 4618.20 ab | 380.32 | 4806.66 a | 470.48 | 3881.06 b | 400.32 | 4414.06 ab | 542.94 | 4520.06 ab | 568.8 | 4946.80 a | 385.13 |
| Ca | mg/kg | 11,237.73 ab | 309.47 | 10,788.63 b | 269.91 | 10,996.73 ab | 364.67 | 10,808.86 ab | 435.65 | 11,378.40 a | 195.72 | 11,362.26 ab | 393.5 |
| C | % | 41.74 a | 1.51 | 39.096 ab | 1.19 | 34.25 b | 4.6 | 38.80 b | 0.42 | 39.98 b | 1.65 | 39.007 b | 0.5 |
| N | % | 0.970 a | 0.213 | 12.01 a | 11.42 | 1.67 a | 0.27 | 1.21 a | 0.19 | 1.55 a | 0.28 | 1.26 a | 0.367 |
| P | % | 0.222 b | 0.02 | 0.276 a | 0.07 | 0.246 a | 0.03 | 0.328 a | 0.05 | 0.290 a | 0.03 | 0.283 ab | 0.06 |
| S | % | 0.287 b | 0.02 | 0.367 ab | 0.04 | 0.419 ab | 0.04 | 0.357 a | 0.02 | 0.402 a | 0.02 | 0.344 ab | 0.06 |
| Compartment 18 n = 15 | Compartment 31 n = 15 | Compartment 71 n = 15 | Compartment 74 n = 15 | Compartment 42 n = 15 | Compartment 55 n = 15 | ||||||||
|---|---|---|---|---|---|---|---|---|---|---|---|---|---|
| Parameter | Units | Mean | 95%CL | Mean | 95%CL | Mean | 95%CL | Mean | 95%CL | Mean | 95%CL | Mean | 95%CL |
| δ15N | ‰ | 7.314 ab | 3.44 | 9.486 a | 2.688 | 4.473 b | 1.794 | 5.158 ab | 1.388 | 6.862 ab | 2.466 | 9.863 a | 3.437 |
| δ13C | ‰ | −26.598 b | 2.635 | −20.641 a | 8.178 | −28.292 b | 1.132 | −28.317 b | 0.8 | −28.409 b | 1.3 | −26.696 b | 1.6 |
| Cd | mg/kg | 0.0088 a | 0.004 | 0.0065 a | 0.002 | 0.0097 a | 0.002 | 0.0095 a | 0.005 | 0.0094 a | 0.002 | 0.007 a | 0.003 |
| Cu | mg/kg | 0.0994 a | 0.0413 | 0.0682 a | 0.02 | 0.0672 a | 0.02 | 0.0602 a | 0.015 | 0.106 a | 0.08 | 0.115 a | 0.08 |
| Fe | mg/kg | 5.985 a | 2.9 | 5.381 a | 3.06 | 5.608 a | 3.09 | 4.910 a | 2.51 | 6.656 a | 4.64 | 7.693 a | 3.836 |
| K | mg/kg | 28.074 a | 3.079 | 26.987 a | 3.44 | 26.552 a | 2.76 | 27.065 a | 3.63 | 23.928 a | 3.51 | 24.07 a | 3.44 |
| Mg | mg/kg | 1.833 a | 0.1 | 1.794 a | 0.18 | 1.832 a | 0.1 | 1.763 a | 0.13 | 1.764 a | 0.22 | 1.760 a | 0.17 |
| Mn | mg/kg | 0.834 a | 0.19 | 1.051 a | 0.23 | 0.582 a | 0.24 | 0.587 a | 0.15 | 2.069 a | 0.65 | 0.750 a | 0.27 |
| Pb | mg/kg | 0.0879 a | 0.034 | 0.0694 a | 0.036 | 0.0677 a | 0.033 | 0.0850 a | 0.032 | 0.0820 a | 0.031 | 0.0854 a | 0.0251 |
| Zn | mg/kg | 0.442 a | 0.125 | 0.513 a | 0.207 | 0.488 a | 0.154 | 0.412 a | 0.146 | 0.526 a | 0.237 | 0.470 a | 0.178 |
| Na | mg/kg | 5238.46 a | 309.06 | 5125 a | 431.2 | 5330.6 b | 252.5 | 5105.06 a | 118.96 | 5372.93 a | 241.4 | 5798.60 a | 453.98 |
| Ca | mg/kg | 10,843 b | 385.12 | 10,929.26 b | 401.26 | 9579.26 b | 1676.38 | 10,765.68 b | 466.07 | 10,992.86 b | 443.11 | 11,329.40 a | 467.35 |
| C | % | 39.534 a | 1.09 | 40.094 a | 1.20 | 39.660 a | 0.67 | 39.405 a | 1.05 | 38.452 b | 1.03 | 37.0307 b | 0.85 |
| N | % | 0.463 ab | 0.04 | 0.392 b | 0.03 | 0.551 a | 0.07 | 0.542 a | 0.05 | 0.507 a | 0.047 | 0.547 a | 0.058 |
| P | % | 0.262 a | 0.03 | 0.253 a | 0.03 | 0.224 a | 0.016 | 0.244 a | 0.028 | 0.268 a | 0.085 | 0.200 a | 0.014 |
| S | % | 0.211 b | 0.013 | 0.194 b | 0.009 | 0.246 a | 0.019 | 0.266 a | 0.033 | 0.535 a | 0.409 | 0.277 a | 0.051 |
| Compartment 18 n = 15 | Compartment 31 n = 15 | Compartment 71 n = 15 | Compartment 74 n = 15 | Compartment 42 n = 15 | Compartment 55 n = 15 | ||||||||
|---|---|---|---|---|---|---|---|---|---|---|---|---|---|
| Parameter | Units | Mean | 95%CL | Mean | 95%CL | Mean | 95%CL | Mean | 95%CL | Mean | 95%CL | Mean | 95%CL |
| δ15N | ‰ | 3.219 b | 1.22 | 6.675 a | 1.85 | 2.664 b | 1.4 | 3.649 b | 0.68 | 3.933 b | 0.9 | 6.556 a | 1.07 |
| δ13C | ‰ | −29.272 a | 0.9 | −29.176 a | 0.72 | −30.738 b | 0.71 | −31.272 b | 1.2 | −28.825 a | 0.65 | −29.307 a | 0.33 |
| Cd | mg/kg | 0.017 a | 0.009 | 0.12 a | 0.11 | 0.015 a | 0.005 | 0.016 a | 0.006 | 0.0113 a | 0.005 | 0.112 a | 0.102 |
| Cu | mg/kg | 0.068 ab | 0.02 | 0.098 ab | 0.028 | 0.052 bc | 0.017 | 0.55 bc | 0.51 | 0.135 a | 0.049 | 0.041 c | 0.01 |
| Fe | mg/kg | 40.552 a | 14.43 | 39.232 a | 12.92 | 39.329 a | 13.68 | 42.152 a | 16.27 | 46.321 a | 13.53 | 36.253 a | 11.97 |
| K | mg/kg | 28.930 a | 1.77 | 24.351 bc | 2.23 | 27.958 ab | 1.37 | 28.119 a | 1.78 | 28.016 ab | 1.14 | 22.088 a | 2.91 |
| Mg | mg/kg | 1.65 a | 0.13 | 1.94 a | 0.07 | 1.923 a | 0.11 | 1.967 a | 0.08 | 1.942 a | 0.09 | 1.928 a | 0.09 |
| Mn | mg/kg | 1.824 a | 0.3 | 1.126 ab | 0.4 | 1.514 ab | 1.01 | 2.032 a | 0.62 | 2.163 a | 0.73 | 0.882 b | 0.196 |
| Pb | mg/kg | 0.244 a | 0.056 | 0.283 a | 0.06 | 0.204 a | 0.056 | 0.236 a | 0.06 | 0.268 a | 0.039 | 0.185 a | 0.053 |
| Zn | mg/kg | 0.727 ab | 0.186 | 0.722 ab | 0.15 | 0.629 b | 0.15 | 0.703 ab | 0.155 | 0.998 a | 0.16 | 0.500 b | 0.05 |
| Na | mg/kg | 5156.68 a | 172.78 | 5069.06 a | 234.3 | 5084.06 a | 167.82 | 5122.46 a | 110.44 | 5099.93 a | 222.69 | 4851.66 a | 261.44 |
| Ca | mg/kg | 10,812.26 a | 186.59 | 10,624.86 a | 213.14 | 10,793.40 a | 353.3 | 10799 a | 305.13 | 9448.2 b | 1599.9 | 10,817.86 a | 348 |
| C | % | 9.425 abc | 2.59 | 8.876 bc | 0.861 | 10.842 a | 0.74 | 9.657 ab | 0.36 | 9.565 ab | 1.27 | 7.278 c | 0.7 |
| N | % | 0.380 bc | 0.066 | 0.437 ab | 0.034 | 0.477 a | 0.027 | 0.415 a | 0.02 | 0.386 bc | 0.031 | 0.319 c | 0.044 |
| P | % | 0.376 a | 0.028 | 0.201 b | 0.009 | 0.281 b | 0.05 | 0.380 a | 0.05 | 0.337 ab | 0.05 | 0.261 b | 0.05 |
| S | % | 0.760 bc | 0.323 | 0.542 c | 0.06 | 1.156 b | 0.188 | 1.262 ab | 0.18 | 1.705 a | 0.26 | 0.610 c | 0.05 |
| Compartments | Leaves Samples No. | Root Samples No. | Soil Samples No. | Compartment Age | Water Salinity (ppt) | Water Ph | River Name | Species | Status | DBH (cm) | Density (ha−1) | Phytomass (T ha−1) |
|---|---|---|---|---|---|---|---|---|---|---|---|---|
| 18 | 15 | 15 | 15 | 15 years | 20.3 | 4.6 | Crying river | R. apiculata | Unmanaged | 5–15 | 2075 | 235 |
| 31 | 15 | 15 | 15 | 15 years | 18.9 | 5 | Sanga besar | R. apiculata | Unmanaged | 6–15 | 1901 | 168 |
| 42 | 15 | 15 | 15 | VJR | 20.7 | 4.9 | Crying river | R. apiculata | Managed | 4–15 | 1084 | 125 |
| 71 | 15 | 15 | 15 | 25 years | 18.8 | 6.2 | Mongokok | R. apiculata | Unmanaged | 7–35 | 1287 | 241 |
| 74 | 15 | 15 | 15 | 25 years | 23.2 | 4.5 | Sungai tiram dilam | R. apiculata | Unmanaged | 6–36 | 1175 | 283 |
| 55 | 15 | 15 | 15 | VJR | 19.8 | 4.8 | Sungai trong | R. apiculata | Managed | 6–35.3 | 1690 | 266 |
Publisher’s Note: MDPI stays neutral with regard to jurisdictional claims in published maps and institutional affiliations. |
© 2022 by the authors. Licensee MDPI, Basel, Switzerland. This article is an open access article distributed under the terms and conditions of the Creative Commons Attribution (CC BY) license (https://creativecommons.org/licenses/by/4.0/).
Share and Cite
Khan, W.R.; Aljahdali, M.O. Elemental Composition of Above and Belowground Mangrove Tissue and Sediment in Managed and Unmanaged Compartments of the Matang Mangrove Forest Reserve. Plants 2022, 11, 2916. https://doi.org/10.3390/plants11212916
Khan WR, Aljahdali MO. Elemental Composition of Above and Belowground Mangrove Tissue and Sediment in Managed and Unmanaged Compartments of the Matang Mangrove Forest Reserve. Plants. 2022; 11(21):2916. https://doi.org/10.3390/plants11212916
Chicago/Turabian StyleKhan, Waseem Razzaq, and Mohammed Othman Aljahdali. 2022. "Elemental Composition of Above and Belowground Mangrove Tissue and Sediment in Managed and Unmanaged Compartments of the Matang Mangrove Forest Reserve" Plants 11, no. 21: 2916. https://doi.org/10.3390/plants11212916