Article

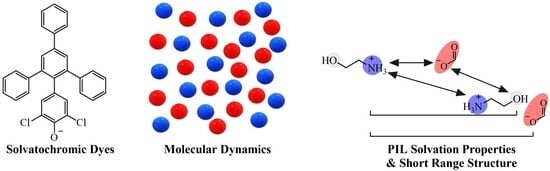
Exploring Solvation Properties of Protic Ionic Liquids by Employing Solvatochromic Dyes and Molecular Dynamics Simulation Analysis

School of Science, STEM College, RMIT University, Melbourne, VIC 3000, Australia
*
Author to whom correspondence should be addressed.
Liquids 2024, 4(1), 288-304; https://doi.org/10.3390/liquids4010014
Submission received: 15 January 2024 / Revised: 1 February 2024 / Accepted: 5 March 2024 / Published: 20 March 2024

Abstract

:
Solvation properties are key for understanding the interactions between solvents and solutes, making them critical for optimizing chemical synthesis and biochemical applications. Designable solvents for targeted optimization of these end-uses could, therefore, play a big role in the future of the relevant industries. The tailorable nature of protic ionic liquids (PILs) as designable solvents makes them ideal candidates. By alteration of their constituent structural groups, their solvation properties can be tuned as required. The solvation properties are determined by the polar and non-polar interactions of the PIL, but they remain relatively unknown for PILs as compared to aprotic ILs and their characterization is non-trivial. Here, we use solvatochromic dyes as probe molecules to investigate the solvation properties of nine previously uncharacterized alkyl- and dialkylammonium PILs. These properties include the Kamlet–Aboud–Taft (KAT) parameters: π* (dipolarity/polarizability), α (H-bond acidity) and β (H-bond basicity), along with the ET(30) scale (electrophilicity/polarizability). We then used molecular dynamics simulations to calculate the radial distribution functions (RDF) of 21 PILs, which were correlated to their solvation properties and liquid nanostructure. It was identified that the hydroxyl groups on the PIL cation increase α, π* and ET(30), and correspondingly increase the cation–anion distance in their RDF plots. The hydroxyl group, therefore, reduces the strength of the ionic interaction but increases the polarizability of the ions. An increase in the alkyl chain length on the cation led to a decrease in the distances between cations, while also increasing the β value. The effect of the anion on the PIL solvation properties was found to be variable, with the nitrate anion greatly increasing π*, α and anion–anion distances. The research presented herein advances the understanding of PIL structure–property relationships while also showcasing the complimentary use of molecular dynamics simulations and solvatochromic analysis together.

Graphical Abstract

1. Introduction

Ionic liquids (ILs) are a unique class of solvents possessing tailorable physicochemical properties through varying their chemical structure [1,2,3]. They are often defined as liquid salts with melting points ≤100 °C, though MacFarlane et al. (2018) proposed expanding this definition to include IL-solvent mixtures [4]. In both industry and research applications, the beneficial properties that can be provided by ILs include low viscosity, negligible vapor pressure, control over thermal phase transitions, support for amphiphilic self-assembly and even biocompatibility and biodegradation [4,5,6,7,8,9]. A key property of many ILs is the ability to solvate a combination of polar and non-polar compounds due to containing both ionic components and organic alkyl groups [5,10,11,12]. Despite this duality, the majority of ILs are considered polar solvents based on a generalization of IL solvent properties. This highlights the complexity of solvent properties, and their challenging nature to define and characterize. Specifically, the International Union of Pure and Applied Chemistry (IUPAC) defines polarity as ‘the action of all possible intermolecular interactions between solute ions or molecules and solvent molecules, excluding interactions leading to definite chemical alterations of the ions or molecules of the solute’ [13]. Not surprisingly, the literature, therefore, lacks a comprehensive understanding of select structure–property relationships describing the solvent properties of ILs.
Characterization of solvent–solute interactions is a non-trivial task, and many different techniques have been used for this purpose. These include but are not limited to, 1H and 13C NMR [14], UV/vis absorption and fluorescence [15,16,17,18,19], octanol-water partition [20], chromatography [20,21,22] and analyzing the solvent effect based on standard chemical reactions [23,24,25,26,27,28]. Physical properties can also provide insight into the macroscopic polar properties of a solvent through for example, refractive index and molar refractivity [29,30], but do not provide detail on intermolecular electrostatic and polarization forces between the solute and solvent. The technique that is arguably most effective at comparing solvent properties across ILs is the use of UV/visible spectroscopy with optimized solvatochromic/solvatofluorochromic dyes [23,30,31,32]. The absorbance/fluorescence shift of these dyes occurs due to their interactions with the solvent and can be measured via spectroscopy and calculated on an empirical basis [33,34,35,36,37]. They have previously been used to develop the Kamlet–Aboud–Taft (KAT) parameters as a multi-parameter approach that has been shown to be suitable for ILs [30,31,32,38]. Using this method, the solvation properties of a solvent are described using three unique parameters [33,34,35,36,37]. These include, π* (dipolarity/polarizability), α (H-bond donating (HBD) acidity) and β (H-bond accepting (HBA) basicity). Another well-utilised empirical scale of polarity is the ET(30) electronic transition scale [29,39]. It is calculated from the maximum absorbance wavelength shift of Reichardt’s betaine dye or Reichardt’s dye 30 and is a result of solvent dipolarity/polarizability and H-bond acidity. However, we have previously noted significant solubility and protonation issues when applying Reichardt’s dye 30 during experimentation with ILs. Therefore, Reichardt’s dye 33 (RD33) [40] has been used as a substitute, producing an ET(33) value that can be correlated to ET(30) via a linear relationship. Combined, these four parameters account for the diverse interactions possible between an IL solvent and solute.
Protic ILs (PILs) are an easy-to-synthesize, non-aqueous solvent class with applications in a variety of areas, such as biomolecule stability and activity and chemical catalysis [11,41,42,43,44,45]. PILs differ from aprotic ILs due to the proton transfer that occurs during synthesis from the neutralization of a Brønsted acid by a Brønsted base, producing a solvent capable of hydrogen bonding. Their overall polarity is, therefore, based on the combination of hydrogen bonds, dipole–dipole interactions and electrostatic interactions. These multiple contributing factors and the non-specific nature of polarity mean that the use of a multi-parameter analysis method is a necessity. Previously, 11 solvatochromic dyes were trialed for the characterization of PIL solvation properties, identifying N,N-diethyl-4-nitroaniline (DE4A), 4-nitroaniline (4NA) and RD33 as the optimal choice [38]. To date, solvation properties of only 16 alkylammonium nitrate, formate, acetate and thiocyanate PILs have previously been fully reported [21,38]. Comparatively, alkylammonium cations were shown to have weaker H-bond basicity and elevated π* as compared to tetraalkylammonium sulfonate aprotic ILs [21,46]. These literature studies concluded that H-bond acidity was shown to be a result of both cation and anion structural groups, while H-bond basicity was dominated by the anion. The nitrate anion was identified as a stronger H-bond anion and more polarizable than the organic carboxylate anions. Additionally, a decrease in π* with increasing alkyl chain length has been observed for PILs. However, the impact of hydroxyl groups on the anion remains an unexplored area of PIL solvation properties, and it is unknown how robust these trends are across ion series.
Molecular dynamics (MD) simulations provide additional and complementary information to the experimental investigation of molecular interactions of a solvent, such as information on the specific interactions of PILs based on their structure. The literature on MD of ILs has primarily focused on interactions and the structure of aprotic ILs. For example, Miao et al. (2022) modeled the liquid structure of choline-amino acid-based ILs through their internal H-bonds and atom–atom pair correlation functions then correlated this with their ability to solvate lignin [47]. Previously, Eyckens et al. (2016) combined KAT parameters with the modeled structure of tri- and tetraglyme with lithium bis(trifluoromethyl)sulfonimide [48]. The low β value of the system was attributed to the chelation of each glyme to the bis(trifluoromethyl)sulfonimide anion and confirmed with MD simulations. More recently, MD simulations were compared to diffusion coefficients of guanidinium-based PILs. This study found that H-bonding was the main interaction between cation and anion and specifically, anions with high proton affinities showed a clear localization of the acidic proton of the cation [49]. Therefore, the KAT multi-parameter method and MD analysis of IL solvent properties is a potent combination but has not been explored for PILs.
Herein, we combine experimentally determined KAT parameters with radial distribution functions (RDFs) from MD simulations for the expansion of our understanding of PIL properties. First, we present the KAT and ET(30) solvation parameters of twelve PILs, nine of which were previously uncharacterized, using the dyes DE4A, 4NA and RD33 (Figure 1a). The focus on PILs as a subclass of ILs in this study is due to a lack of representation in the literature. The molecular structures of these PILs are presented in Figure 1b. These PILs have been selected to investigate the effect of hydroxyl groups, alkyl chain length, cation substitution and choice of anion on PIL solvation properties. Each of these structural properties has shown considerable impact on PIL physicochemical properties observed in previous studies [50]. MD simulations were then conducted for the nine PILs in combination with a further twelve PILs (Figure 1c) where their KAT and ET(30) solvation parameters had been previously reported in the literature [38]. In total, 21 sets of RDF plots have been calculated for these PILs and compared to their experimentally determined solvation properties. This combination of experimental and computational analysis allows for a deeper understanding of the structure–property trends of alkyl- and dialkylammonium PILs liquid structure and solvation properties.

2. Method

2.1. PIL Synthesis

All reagents for the synthesis of ILs were used as received. The precursors included diethanolamine (98.0%), ethanolamine (99.5%), ethylamine (66.0% in water), propylamine (98.0%), butylamine (99.5%), pentylamine (99.0%), acetic acid (99.0%), glycolic acid (99.0%) and lactic acid (85.0%), purchased from Sigma-Aldrich (St. Louis, MO, USA). Formic acid (98.0%) was purchased from Merck (Darmstadt, Germany). The molecular solvents were used as received and include dimethylsulfoxide (DMSO) (>99.9%) and methanol (MeOH) (99.8%) from Sigma-Aldrich, acetonitrile (ACN) (>99.9%) from Merck and MilliQ water from a Merck Synergy system with UV, Type 1 water (18.2 MΩ·cm at 25 °C ultrapure water).
Each PIL was synthesized via the dropwise addition of a Brønsted acid to a Brønsted base for stoichiometric neutralization in an ethanol bath (<5 °C) according to the literature method reported [1,50]. Each synthesis was kept below 10 °C to avoid the amide side reaction in batches of 20 g per PIL (102–220 mmol of reagent). After synthesis, each PIL was dried to remove excess water using a rotary evaporator for 24 h followed by approximately 72 h below 0.3 mbar on a freeze dryer. The water content was then measured using a combination of coulometric Karl-Fischer titration for <1 wt% water content and volumetric Karl-Fischer titration for PILs with >1 wt% water content. The final water content of each of the PILs is provided in Table S1 of the ESI.

2.2. UV/Visible Spectroscopy Analysis

The dye molecules used were N,N-diethyl-4-nitroaniline (99%, Santa Cruz Biotechnology, Dallas, TX, USA), 4-nitroaniline (99%, Fluka, Thermo Fisher Scientific, Waltham, MA, USA), and Reichardt’s Dye 33 (99%, Aurora Fine Chemicals, San Diego, CA, USA). The chemical structures of these dyes are shown in Figure 1a.
Solutions of solvatochromic dyes in PILs were prepared according to our previously recorded method [38]. This was accomplished by serial dilution of each dye in methanol, and then the methanol was evaporated via a vacuum oven. Once the methanol was completely evaporated, each solvent of interest was added for a final dye concentration of 0.014 mM, 0.02 mM and 0.63 mM of DE4A, 4NA and RD33, respectively. It should be noted, that for PILs with particularly high viscosity, a combination of manual stirring, a benchtop vortex and time (approximately 12 h) was used to ensure full dispersion of the solubilized dye. The PILs with high viscosity were EAL, EAH, EtAA, EtAL, PAG, PAL, BAL, BAG, PeAG, PeAL and DEtAA.
The spectroscopic measurements were performed using a PerkinElmer EnSight Multimode plate reader (PerkinElmer, Waltham, MA, USA) and the spectral range for absorbance measurements was 300–600 nm with a bandwidth of 1 nm for all absorbance measurements.

2.3. KAT Formulation

The ET(33) parameter was calculated using Equation (1), where λmax is the wavelength corresponding to the maximum absorbance of the solvatochromic dye RD33. ET(33) was then calculated from ET(30) using the linear relationship shown in Equation (2) [38]. For a more detailed description of the inception and application of the equations used here, consult the original papers as referenced here [29,33,34,36].
E T 33 k c a l · m o l 1 = 28591.5 λ m a x
E T 30 = 0.9442 E T 33 5.7329
The KAT parameter π* was calculated using Equation (3). The calculation of π* uses the maximum absorbance frequency of the dye DE4A ( v m a x ) , where s = −3.182 and v O = 27.52 kK where each are constants that have been reported previously in the literature [36,38].
v m a x = v O + s π *
The parameter α is calculated from a combination of the ET(30) and π* values in Equation (4).
α = 0.0649 E T 30 0.72 π * 2.03
Finally, parameter β was obtained using Equation (5) where λ D E 4 A is the maximum absorbance wavelength of the dye DE4A and λ 4 N A is the maximum absorbance wavelength of the dye 4NA.
β = 1.035 10 4 λ D E 4 A 10 4 λ 4 N A + 2.64 2.80
The PILs of EAN, PAN and EAF, as well as the molecular solvents DMSO, ACN, water and MeOH, were used as controls to compare to previous studies. All calculated results, including wavelength of maximum absorbance, are reported in Table 1.

2.4. Molecular Dynamics Simulations

All systems comprised 500 cations and 500 anions randomly packed into a 60 × 60 × 60 Å3 unit cell using PACKMOL [51]. Initial atomic partial charges were calculated using Gaussian 16 [52], and the general amber force field (GAFF) [53] standard protocol for partial charge calculation (HF/6-31G*) was applied to all atoms using the Antechamber program of the AMBER 20 package [54]. All MD simulations were performed using the GROMACS 2019.3 software [55]. ACEPYPE [56] was used to convert the topology from AMBER format to GROMACS format. Prior to the MD simulation, a molecular mechanics minimization was performed on each structure employing the steepest descent method, with a maximum force convergence criterion of 20 kJ mol−1 nm−1. Each simulation was equilibrated by 500 ps of annealing where the temperature was increased linearly from 298.15 K to 600 K in the first 250 ps, then reduced to 298.15 K in the final 250 ps. Production MD simulations, with atomic coordinates saved every 10 ps, were run for 100 ns in the NPT ensemble at 298.15 K and 1 bar with the Nose–Hoover thermostat and Parrinello–Raman barostat. The LINCS algorithm was applied to all bonds to allow a 2 fs timestep, and a 10 Å cutoff was applied to electrostatic and van der Waals interactions, with the particle-mesh Ewald scheme applied to long-range electrostatics. Analysis was carried out using VMD 1.9.3 [57].

3. Results

3.1. KAT Parameter Characterisation of PILs

The maximum absorbance wavelengths of DE4A, 4NA and RD(33) were obtained for 12 PILs and four molecular solvents and are provided in Table 1. From each of these the KAT parameters π* (polarizability), α (H-bond acidity) and β (H-bond basicity) in conjunction with the ET(30) scale were calculated and these values are also provided in Table 1. By using a consistent method and dyes, it is, therefore, possible to compare to our previous work.
Table 1. The maximum absorbance wavelength of the solvatochromic dyes in each of the PILs and their corresponding calculated solvation parameters.
Max Absorbance Wavelength (nm)π*
(±0.01)
α
(±0.03)
β
(±0.03)
ET(30) (±0.3)
DE4A
(±1)
4NA
(±1)
RD(33) (±1)
NovelPAF4103854260.951.030.6857.6
PAG4013834400.781.020.8455.6
BAG3973824440.701.040.9055.1
PeAG3953824470.671.040.9554.7
EAL4073854330.891.000.7556.6
PAL3983834400.721.060.9155.6
BAL3953834430.671.070.9855.2
EtAA4143884301.020.940.6757.0
DEtAA4123854260.981.000.6457.6
ControlDMSO4133905291.000.190.7445.30
acetonitrile402368-0.80-0.43-
methanol3963704420.691.070.6255.34
water4293774061.271.000.0960.76
EAN417380-1.07-0.41-
PAN4143834111.021.130.5559.95
EAF4113854230.961.050.6658.09
The KAT parameters (π*, α and β) are a unitless scale relative to each dye while ET(30) is measured as kcal/mol.

3.1.1. ET(30) Scale

The ET(30) scale or electrophilicity is a measure of the energy required to transfer charge through the PILs. The dominating charged contributions to this measurement are the H-bond donors (acidity), dipole–dipole and dipole/induced dipole interactions of the PILs. The ET(30) values are shown in Figure 2 where the newly characterized PILs and data from this study are presented as circles, and the previously reported values as triangles. The two molecular solvents presented here are water and methanol with relatively high and low ET(30) values, respectively. The ET(30) of the PILs studied here is approximately within the two molecular solvents and ranges from 54.7 to 57.6 kcal/mol.
Structural changes of the PIL cation of alkyl chain length, hydroxyl groups and primary or secondary substitution all had an effect on the ET(30) values. Decreasing the alkyl chain length induced an increase in ET(30) values, as seen with the glycolate and lactate alkylammonium series, with the order of PAG > BAG > PeAG and EAL > PAL > BAL. There was a noticeable increase in ET(30) when substitution increased from primary to secondary ammonium cations, shown by DEAF > EAF, DEtAF > EtAF, and DEtAA > EtAA, likely due to the increased number of functional groups. This is consistent with the previous study where the ET(30) of DEtAF was slightly higher than EtAF [38]. However, from literature results of similar ILs, tertiary and quaternary substituted alkylammonium ILs generally have lower ET(30) values relative to primary and secondary [46]. This may be due to the increased steric hindrance caused by additional structures, reducing the number and/or strength of the interactions of the cation.
The effect of the anion can be seen in Figure 2. For the ethylammonium cation, there is a noticeable difference between anions in the order nitrate > formate > lactate ≈ glycolate ≈ acetate. Notably, nitrate-containing PILs consistently have the highest ET(30). Increasing the alkyl chain length from formate to acetate led to a decrease in ET(30). Interestingly, PILs containing the glycolate or lactate anions had similar ET(30) values, when paired with the same cation. This suggests that the effect of the hydroxyl group on a small-chained carboxylate anion is independent of its position. In contrast to the cation, there was only a minor change in the ET(30) values of the lactate and glycolate PILs as compared to the anion counterparts without a hydroxyl group, e.g., PAG ≈ PAA and PeAG only 0.3 kcal/mol greater than PeAA. We conclude that the hydroxyl groups present on the anion are less capable of acting as H-bond donors as compared to those on the cation [38].

3.1.2. π* (Polarizability)

The polarizability of a solvent depends on multiple solvent interactions, including π–π stacking when available, along with non-specific dipole–dipole interactions and dispersive forces. Since the PILs used in this study consisted of alkylammonium and dialkylammonium cations they are incapable of π–π stacking, and hence the polarizability is characterizing the PILs dipole formation and ion–ion interactions. Values of π* are normalized to DMSO, where DMSO = 1 to ensure consistency with the literature.
The π* values of the PILs in this study are presented in Figure 3, along with those in the literature for PILs, DMSO, ACN and MeOH. A good consistency of π* values with the literature was obtained for most of the ILs, though we note some variability in the measurement of π* in the case of EAF. By order of the trend ‘decreasing π* with increasing alkyl chain length’, the experimental value of PAF (0.95) would be expected to have a π* between the literature values of EAF (0.90) and BAF (0.70). However, the determined value of EAF (0.96) here was higher than the literature value; therefore, PAF aligned with said trend in this study. Contributions from possible water content variation or stoichiometric variance in the PILs may cause shifts in π* as seen in their ability to alter the physical properties of PILs [50,58,59]. In general, increasing the alkyl chain length of the cation led to a decrease in π*, while the presence of a hydroxyl group on the cation led to an increase.
Similarly, the addition of a hydroxyl group on the anion of the PIL increases π*. A comparison between the glycolate/lactate PILs to acetate or formate shows a consistent increase in π*, e.g., PAA has a π* value of 0.68 as compared to PAG at 0.78 and PAL at 0.72. Similarly, the hydroxyl group on the cation increases π*, though to a larger degree as previously reported [38]. Increasing the alkyl chain length of the anion from formate to acetate anion shows a decrease in π*, consistent with results from the literature [38].

3.1.3. α H-Bond Acidity

The α value of a solvent is defined as its ability to donate a H-bond or its H-bond acidity. It was found that α was the KAT parameter with the highest variance between those in this study and those in the literature, with an average variation of only 0.03. This variation may be due to its calculation from not one but two dyes, compounding any variation observed.
All experimental and literature α values are presented in Figure 4. With a range of 0.94 to 1.07 for α, most PILs are higher than water and all are much higher than the molecular solvents DMSO and ACN [38]. Only EtAA was found to have an α less than water, showing that PILs have similar H-bond donating properties to water. This is not surprising as some PILs have been shown to form H-bonding networks similar to that of water [60,61]. The effect of the alkyl chain on the cation shows an increase with increasing alkyl chain length for the glycolate and lactate series. Comparatively, the formate and nitrate series each only vary marginally with no definitive trend. There was an apparent decrease in α with the presence of a hydroxyl group on the cation; however, an additional hydroxyl group supplied by increased substitution of the ammonium group increases α, e.g., EtAF (0.96) < DEtAF (1.00) < EAF (1.05) and EtAA (0.94) < Delta (1.00).
In regard to the anions, the nitrate anion led to PILs with the overall highest α of the anions collated here. As the nitrate group [NO3] is unable to donate H-bonds due to its structure, this is likely due to the high ionizability of the anion, enhancing the H-bond donating ability of the partnered cation [50]. The hydroxyl group on the anion showed a variable effect on α, where the lactate series was generally higher than the glycolate. However, the formate and nitrate anions had consistently higher α than acetate, glycolate and lactate. While the α results here show higher variance as compared to the rest of the solvation properties, the trends presented are consistent with the literature and are a result of both anion and cation contributions [38].

3.1.4. β H-Bond Basicity

As α is the ability of a solvent to donate H-bonds, β is a measure of its ability to accept H-bonds or its H-bond basicity. Figure 5 presents the calculated β values of this study in conjunction with previously reported β from Yalcin et al. [38] As opposite properties, the order of PILs is naturally inverse when comparing β to α, as are their trends. Specifically, the effect of the cation appears varied, as the alkyl chain length of the cation generally increased β, while hydroxyl groups showed a decrease in β. This is not surprising as the molecular structure of alkylammonium cations lends itself to H-bond donating with the ammonium (–NH3+) group. Additional research into cation structures may further shed light on the relationship between cation structure and PILs β.
The presence of a hydroxyl group on the anion appears to generally increase the β of PILs as compared to its effect when on the cation. This can be seen in Figure 5 via a comparison of the glycolate and lactate anions with the ethanolammonium and diethanolammonium cations. Where β values of the hydroxylated anions range from 0.75–0.98 and the hydroxylated cations range from 0.45–0.67 [38]. This work shows the strong influence of anion structure on the β of PILs and its inverse relationship to α, most visible in the nitrate PILs, each with relatively high α, but comparatively low β. Consistent results were obtained for the PILs EAF and PAN with some variation in the EAN β value, potentially due to changes in water content. The molecular solvents across studies had high accuracy with almost identical values for DMSO, ACN and MeOH. Noticeably, the variation between carboxylate-based PIL α and β values are significantly less than that of the molecular solvents as well as the nitrate series of PILs. Therefore, it indicates the contribution of both cation and anion to these properties, specifically –NH3+ to α and –COO to β.

3.2. Radial Distribution Functions of PILs

MD simulations were performed on the 21 alkylammonium PILs shown in Figure 1, and from these, their RDFs were calculated. These 21 PILs include the 9 PILs from this study and the previous 12 where the ET(30) and KAT parameters have been reported. This series of PILs provides systematic structural variation to enable insight into the effect of hydroxyl groups on either the cation or the anion, increased alkyl chain length of the cation, increased branching of the ammonium cation, and variations in the anion between nitrate and carboxylates.
The RDF plots for the PILs containing a formate anion are visualized in Figure 6 and Figure 7 to demonstrate the effect of changes in cation structure on solvation properties. Similarly, the RDF plots for PILs containing the propylammonium cation are included in Figure 8 for determining the effect of the anion structure. The remaining 11 RDF plots are presented in Figures S1–S11. This analysis has used the N+ of the respective cation or the negatively charged O of the anion as the representative position of each ion in the solution and consequently their solvation environment.

3.2.1. The Effect of Cation Structure

The RDFs for the ILs with a formate anion (EAF, PAF, BAF, PeAF, EtAF and DEtAF) are presented in Figure 6, where each structure is overlayed with the atoms of interest and their labels within the RDF analysis. A solvation map of the distances between atoms according to their peaks in the RDF plots is presented in Figure 7. Though not to scale, these plots allow for a visual comparison of the distances between ions and the effects of their different structural groups.
Figure 6. The radial distribution functions of the formate series of PILs (a) EAF, (b) PAF, (c) BAF, (d) PeAF, (e) EtAF and (f) DEtAF. The RDF plots are inset with the molecular structure of each PIL, where the ions are highlighted, N+ in blue with the cation subscript e.g., NEA is the N+ atom on ethylammonium, O in red with the anion subscript e.g., OF is the O atoms of formate. Additional functional groups are highlighted in grey. The terminal carbon in the cation alkyl chain e.g., CPeA is the terminal carbon of the pentylammonium cation, and hydroxyl groups e.g., OEtA is the oxygen atom of the hydroxyl group in the ethanolammonium cation.
Liquids 04 00014 g006
Figure 7. Solvation maps developed based on the RDF plots presented in Figure 6 (not to scale). The effect of hydroxyl groups on interatomic distances is presented in (a) for EAF, EtAF and DEtAF. (b) The effect of the alkyl chain on N–N distances is inversely proportional to its length, where increasing alkyl chain length decreases N–N distance.
Liquids 04 00014 g007
Figure 8. The RDF plots of (a) PAA, (b) PAG, (c) PAL and (d) PAN inlayed with its molecular structure with N+ ions highlighted in blue and O ions in red. Each RDF plot (left) has its corresponding solvation map adjacent (right) with a visualization of the peaks seen in each plot. The solvation maps are not to scale.
Liquids 04 00014 g008
The distance between cation and anion as represented by the distances between Ncation and OF was consistent and was 2.75 Å for the ethyl- to pentylammonium PILs (Figure 6). With the introduction of a hydroxyl group on the cation (EtAF) the cation–anion distance increases to 2.77 Å and then increases further with DEtAF to 2.79 Å (Figure 7a). This indicates the slight rearrangement of charge upon the cation with the presence of hydroxyl groups, possibly due to increased H-bond formation within the PIL which can be seen as an increase in α from EtAF to DEtAF. The distances of H-bonds between the carboxylate anion and the cations hydroxyl groups slightly increased (from 2.55 Å to 2.57 Å) as well as cation–cation (from 4.19 Å to 4.95 Å) and secondary cation–anion distances (from 4.55 Å to 4.61 Å) for EtAF as compared to DEtAF (Figure 7a). It may be possible the branching of DEtAF increased steric hindrance of the structural packing within the solvation environment of the PIL, causing weaker interactions despite the increased availability of hydroxyl groups.
The liquid nanostructure of PILs is a reported phenomenon describing the weak structuring of ions based on the segregation of hydrophilic and hydrophobic domains [62]. Experimentally, this can be observed using small angle scattering, where the peak position measured in inverse angstroms can be used to estimate the correlation distance, e.g., PeAF has a correlation distance of 15.4 Å [50]. This represents the distance between the repeating groups in solution, i.e., the distance between cations segregated by non-polar groups. Liquid nanostructure, therefore, does not describe an ion’s solvation environment but can be correlated to the trends observed. Here it is observed that by increasing the alkyl chain length, a decrease in the N–N distance occurs, indicating the ammonium cations are closer (Figure 7b). This is due to the increased structuring of the system and closer packing of ions [2]. Analysis of EAF NEA–CEA distances shows a sharp peak at 2.55 Å for the alkyl chain of the same molecule; however, beyond that is only a broad increase in g(r) before reaching bulk EAF. This is representative of the weak liquid nanostructure of EAF which is caused by the short chain length (weak hydrophobicity) on the cation and has been observed by previous small angle X-ray scattering experiments (SAXS) [62]. Upon increasing the alkyl chain length, two peaks can be observed for N–C of each cation. The first peak is indicative of the alkyl chain of the same molecule and the second is its neighbor. However, the second peak is closer than the length of a second alkyl chain and, therefore, indicates the grouping of alkyl chains from nearby cations. Representative of the liquid nanostructure observed by SAXS. These alkyl chains form the non-polar domain of their liquid nanostructure, where increasing alkyl chain length increases the distance at which these peaks are observed. Notably, these RDF peaks for N–C are not observed for the ethanolammonium cation and is as expected from the previously reported SAXS analysis of ethanolammonium based PILs [62].

3.2.2. The Effect of Anion Structure

The RDFs for the PILs with a propylammonium cation (PAA, PAG, PAL, PAN) are presented in Figure 8, where each structure is inlaid with the atoms of interest and their labels within the RDF analysis. Through analysis of the RDF plots in Figure 8, individual solvation maps of the PILs were developed and are presented adjacent to their corresponding RDF.
The most noticeable change caused by the anion is the change in distance between anions (e.g., OA–OA for PAA). This difference can be grouped by the type of anion, where PAF and PAA have an O–O distance of 4.45 Å (Figure 6b) and 4.47 Å (Figure 8a), respectively. PAG and PAL have distances of 4.71 Å and 4.69 Å, respectively (Figure 8b,c) and the inorganic anion of PAN has a distance of 5.37 Å (Figure 8d). This increase in O–O distance indicates an increase in the repulsive forces of the anion. Despite increased O-O distance for the glycolate and lactate anions, the distance between the hydroxyl group and the anion carboxylate (OG–OHG and OL–OHL, respectively) does not change as seen in their solvation maps. The RDF of O–OH has two distinct peaks, only 0.8 Å apart. The first peak is representative of O–OH on the same molecule (2.75 Å), while the second peak is the O–OH of an adjacent anion molecule (3.55 Å). Therefore, it is likely that the hydroxyl group is oriented towards the anions to enable H-bonding between anions and help form a polar domain within the liquid structure of the PIL. Comparatively, the distance between the hydroxyl group in EtAF and the formate anion is 2.55 Å (Figure 7), revealing the stronger H-bond donating ability when present on the cation, as compared to the anion. This is supported by the α results obtained during the experimental KAT analysis.
There is an increase in the cation to anion distance in the order PAA (2.73 Å) < PAF (2.75 Å) = PAG (2.75 Å) < PAL (2.77 Å) < PAN (2.81 Å). The overall change in distance from PILs containing the acetate or nitrate anion is 0.8 Å, which indicates slightly weaker ionic interactions from PAA to PAN. This is likely related to the relatively high ΔpKa of nitrate-based PILs and indicative of more strongly dissociated ions in solution [50]. Although it is noted that acid-base dissociation in neat PILs will be energetically different from that in water, so ΔpKa based on acid-base equilibria in water should be employed with caution.

4. Discussion

Structural feature trends can provide design rules for tailored solvents and so the continued characterization of PIL properties remains an important area of study. While there has been much research into aprotic IL solvation properties, many PILs have not been characterized, despite their cheap precursors and ease of synthesis [1]. Due to the nature of PILs and ILs in general, the repeatability of characterization studies is variable as many factors can influence the PILs’ physical and chemical properties [50]. Notably water content, IL ionizability and cation–anion stoichiometry influence these properties [4,59,63], and it is essential for water content to be reported. Here, the water content of all PILs used has been presented in Table S1.
The characterization of PIL solvation properties through the multi-parameter KAT method provides detailed information on the possible interactions of PILs as well as the interaction strengths. However, the solvation parameters of π*, α, β as well as ET(30) are dependent on the chosen solvatochromic dyes, and while they should be representative of interactions with other solutes, variations are expected between studies using different dyes, and for solutes of different sizes. Importantly, while these provide important insights into solvent–solute interactions, they are constructed from specific dyes and will not be transferrable to all solutes. The inclusion of MD simulation data for PILs is advantageous for understanding their solvent structure by investigating the short-range structures of PIL via RDF plots to provide a visualization of the structure surrounding the charged moieties of either cation or anion.
Increasing the length of the cation alkyl chain was influential on all solvation properties, and typically led to an increase in β, and reduction in α, π* and ET(30). In addition, it led to a decrease in the N–N distances in the RDF plots. This is consistent with segregation of polar and non-polar moieties of the ions into separate domains. The increase in β with increasing alkyl chain length is consistent with an increase in the non-polar solvent environment for solutes, due to the increasing proportion of non-polar domains, thus, reducing the number of polarizable interactions with solutes.
The presence of hydroxyl groups in PILs has been shown to be one of the most important structural moieties in relation to the effect of a chemical group on their physicochemical properties [50]. This is also true for their solvation properties [38] and their ability to act as successful solvents for biological molecules [64]. The hydroxyl group on the cation significantly increases α, π* and ET(30) values while decreasing the β value. This solvation change is seen as an increase in the cation–anion distance from the RDF plots, where the structure change allows for weaker ionic interactions and greater polarizability. For DEtAF where there were two hydroxyl groups present, there was an even larger increase in cation–anion distances as well as polarizability. This increase in PIL polarizability is noticeable as an increase in cohesive forces within the PIL, while simultaneously altering the physicochemical properties of the PIL by increasing density, viscosity, surface tension, glass transition temperature and refractive index [50].
The influence of the anions on the solvation properties of the PILs had a different impact compared to the cations, for the ions used in this study. The anion impacted the ET(30) values, with decreasing ET(30) as nitrate > formate > acetate, which was consistent with our previous study [38]. We see this order again in the specific distance from the MD simulations between the cation and anion (NPA–O) of PAN > PAF > PAA. This follows the order of PIL ionicity where the ionicity can be estimated by the ΔpKa of the acid/base pair, with nitric acid and propylamine having the greatest ΔpKa and acetic acid and propylamine having the lowest. Overall PILs containing the nitrate anion led to notably higher π* and α with lower β, than those with formate or acetate anions. This is highly important for the application of PILs towards biomolecules, where the solvent β has been correlated with IL hydrophobicity [65] and IL effect on protein stability [66], and previous studies have shown that the low β of nitrate anions and short cation alkyl chains preserve native protein structures at low PIL concentrations [43,64,67]. In addition, the presence of the hydroxyl group on carboxylate anions showed variability, with comparable π*, α and β relative to the formate and acetate PILs, although it increased β as compared to cation-based hydroxyl groups, revealing β to be predominantly governed by anion structure.

5. Conclusions

The solvation properties of nine PILs were characterized using the KAT multi-parameter method to obtain π*, α, and β, along with ET(30) values. These were combined with literature data of 12 related PILs to develop structure–property relationships. RDF plots from MD simulations were obtained for all 21 PILs to gain insight into the atomic distances and solvation environments of individual ions. Increasing the cation alkyl chain length increased β, while decreasing α, π* and ET(30) and was observed to decrease cation–cation (N–N) distances in the RDF plots. Hydroxyl groups on the cation generally increased α, π* and ET(30) and led to an increase in cation–anion (N–O) distance in their respective RDF plots. Further analysis correlated anions with their polarizability in the order of nitrate > formate > acetate, and the increase in cation–anion distances calculated by RDF plots followed the same order of anions. Overall, nitrate was the most influential and polarizable anion for the PIL solvation properties, followed by glycolate/lactate and then formate/acetate anions. This order correlated to anion–anion distances from the RDF plots, where nitrate had the greatest distance between anions. The research herein is an extension of the current literature on PIL solvent properties, and to the best of our knowledge, is the first combination of RDF analysis and solvatochromic dyes applied to the study of PIL structure–property trends. Further work in this area can be used to investigate the poorly understood effect of non-stoichiometry in PILs. Additionally, reported solvation properties of PIL mixtures in the literature are lacking but would be highly beneficial to applications requiring select biomolecular solvation.

Supplementary Materials

The following supporting information can be downloaded at: https://www.mdpi.com/article/10.3390/liquids4010014/s1, Table S1: Water content of each PIL; Figures S1–S11: RDF plots of the PILs.

Author Contributions

S.J.B.: Conceptualization, Methodology, Formal Analysis, Investigation, Writing—Original Draft, Visualization. A.J.C.: Investigation, Methodology, Writing—Review and Editing. C.J.D.: Resources, Supervision, Writing—Review and Editing. Q.H.: Conceptualization, Formal Analysis, Investigation, Supervision, Writing—Review and Editing, Visualization. T.L.G.: Conceptualization, Resources, Supervision, Writing—Review and Editing, Project Administration. All authors have read and agreed to the published version of the manuscript.

Funding

The authors acknowledge funding support from the Australian Research Council under its Discovery grant Scheme for this work (DP230101712).

Data Availability Statement

Data are contained within the article or Supplementary Materials.

Acknowledgments

S.J.B. acknowledges the financial support of an RMIT PhD Stipend, and a Postgraduate Research Award (PGRA) granted by the Australian Institute of Nuclear Science and Engineering (AINSE). This work was supported by computational resources provided by the Australian Government through the National Computational Infrastructure (NCI) and Pawsey Supercomputing Research Centre under the National Computational Merit Allocation Scheme (project kl59 and resource grant ne25). The authors would also like to recognize the fundamental contributions made to this field by Professor Christian Reichardt. Wherein this work would not be possible without his pioneering research using solvatochromic dyes to characterize solvation properties.

Conflicts of Interest

The authors declare no conflict of interest.

References

  1. Greaves, T.L.; Drummond, C.J. Protic Ionic Liquids:  Properties and Applications. Chem. Rev. 2008, 108, 206–237. [Google Scholar] [CrossRef] [PubMed]
  2. Greaves, T.L.; Drummond, C.J. Solvent nanostructure, the solvophobic effect and amphiphile self-assembly in ionic liquids. Chem. Soc. Rev. 2013, 42, 1096–1120. [Google Scholar] [CrossRef] [PubMed]
  3. Hayes, R.; Warr, G.G.; Atkin, R. Structure and Nanostructure in Ionic Liquids. Chem. Rev. 2015, 115, 6357–6426. [Google Scholar] [CrossRef] [PubMed]
  4. MacFarlane, D.R.; Chong, A.L.; Forsyth, M.; Kar, M.; Vijayaraghavan, R.; Somers, A.; Pringle, J.M. New dimensions in salt–solvent mixtures: A 4th evolution of ionic liquids. Faraday Discuss. 2018, 206, 9–28. [Google Scholar] [CrossRef] [PubMed]
  5. Welton, T. Room-temperature ionic liquids. Solvents for synthesis and catalysis. Chem. Rev. 1999, 99, 2071–2084. [Google Scholar] [CrossRef] [PubMed]
  6. Forsyth, S.A.; Pringle, J.M.; MacFarlane, D.R. Ionic Liquids; An Overview. Aust. J. Chem. 2004, 57, 113–119. [Google Scholar] [CrossRef]
  7. Ghandi, K. A Review of Ionic Liquids, Their Limits and Applications. Green Sustain. Chem. 2014, 4, 44–53. [Google Scholar] [CrossRef]
  8. Greaves, T.L.; Drummond, C.J. Protic Ionic Liquids: Evolving Structure–Property Relationships and Expanding Applications. Chem. Rev. 2015, 115, 11379–11448. [Google Scholar] [CrossRef]
  9. Ohno, H.; Yoshizawa-Fujita, M.; Kohno, Y. Functional Design of Ionic Liquids: Unprecedented Liquids that Contribute to Energy Technology, Bioscience, and Materials Sciences. Bull. Chem. Soc. Jpn. 2019, 92, 852–868. [Google Scholar] [CrossRef]
  10. Greaves, T.L.; Schaffarczyk McHale, K.S.; Burkart-Radke, R.F.; Harper, J.B.; Le, T.C. Machine learning approaches to understand and predict rate constants for organic processes in mixtures containing ionic liquids. Phys. Chem. Chem. Phys. 2021, 23, 2742–2752. [Google Scholar] [CrossRef]
  11. Hallett, J.P.; Welton, T. Room-Temperature Ionic Liquids: Solvents for Synthesis and Catalysis. 2. Chem. Rev. 2011, 111, 3508–3576. [Google Scholar] [CrossRef] [PubMed]
  12. Sedov, I.A.; Magsumov, T.I.; Salikov, T.M.; Solomonov, B.N. Solvation of apolar compounds in protic ionic liquids: The non-synergistic effect of electrostatic interactions and hydrogen bonds. Phys. Chem. Chem. Phys. 2017, 19, 25352–25359. [Google Scholar] [CrossRef] [PubMed]
  13. Perrin, C.L.; Agranat, I.; Bagno, A.; Braslavsky, S.E.; Fernandes, P.A.; Gal, J.-F.; Lloyd-Jones, G.C.; Mayr, H.; Murdoch, J.R.; Nudelman, N.S.; et al. Glossary of terms used in physical organic chemistry (IUPAC Recommendations 2021). Pure Appl. Chem. 2022, 94, 353–534. [Google Scholar] [CrossRef]
  14. Guan, W.; Chang, N.; Yang, L.; Bu, X.; Wei, J.; Liu, Q. Determination and Prediction for the Polarity of Ionic Liquids. J. Chem. Eng. Data 2017, 62, 2610–2616. [Google Scholar] [CrossRef]
  15. Deye, J.F.; Berger, T.A.; Anderson, A.G. Nile Red as a solvatochromic dye for measuring solvent strength in normal liquids and mixtures of normal liquids with supercritical and near critical fluids. Anal. Chem. 1990, 62, 615–622. [Google Scholar] [CrossRef]
  16. Webb, M.A.; Morris, B.C.; Edwards, W.D.; Blumenfeld, A.; Zhao, X.; McHale, J.L. Thermosolvatochromism of Phenol Blue in Polar and Nonpolar Solvents. J. Phys. Chem. A 2004, 108, 1515–1523. [Google Scholar] [CrossRef]
  17. Cave, R.J.; Castner, E.W. Time-Dependent Density Functional Theory Investigation of the Ground and Excited States of Coumarins 102, 152, 153, and 343. J. Phys. Chem. A 2002, 106, 12117–12123. [Google Scholar] [CrossRef]
  18. Ando, Y.; Homma, Y.; Hiruta, Y.; Citterio, D.; Suzuki, K. Structural characteristics and optical properties of a series of solvatochromic fluorescent dyes displaying long-wavelength emission. Dye. Pigment. 2009, 83, 198–206. [Google Scholar] [CrossRef]
  19. Jin, H.; Baker, G.A.; Arzhantsev, S.; Dong, J.; Maroncelli, M. Solvation and Rotational Dynamics of Coumarin 153 in Ionic Liquids:  Comparisons to Conventional Solvents. J. Phys. Chem. B 2007, 111, 7291–7302. [Google Scholar] [CrossRef]
  20. Shetty, P.H.; Youngberg, P.J.; Kersten, B.R.; Poole, C.F. Solvent properties of liquid organic salts used as mobile phases in microcolumn reversed-phase liquid chromatography. J. Chromatogr. A 1987, 411, 61–79. [Google Scholar] [CrossRef]
  21. Poole, S.K.; Shetty, P.H.; Poole, C.F. Chromatographic and spectroscopic studies of the solvent properties of a new series of room-temperature liquid tetraalkylammonium sulfonates. Anal. Chim. Acta 1989, 218, 241–264. [Google Scholar] [CrossRef]
  22. Anderson, J.L.; Ding, J.; Welton, T.; Armstrong, D.W. Characterizing Ionic Liquids on the Basis of Multiple Solvation Interactions. J. Am. Chem. Soc. 2002, 124, 14247–14254. [Google Scholar] [CrossRef] [PubMed]
  23. Bini, R.; Chiappe, C.; Mestre, V.L.; Pomelli, C.S.; Welton, T. A rationalization of the solvent effect on the Diels–Alder reaction in ionic liquids using multiparameter linear solvation energy relationships. Org. Biomol. Chem. 2008, 6, 2522–2529. [Google Scholar] [CrossRef] [PubMed]
  24. Jeličić, A.; García, N.; Löhmannsröben, H.-G.; Beuermann, S. Prediction of the Ionic Liquid Influence on Propagation Rate Coefficients in Methyl Methacrylate Radical Polymerizations Based on Kamlet−Taft Solvatochromic Parameters. Macromolecules 2009, 42, 8801–8808. [Google Scholar] [CrossRef]
  25. Crowhurst, L.; Falcone, R.; Lancaster, N.L.; Llopis-Mestre, V.; Welton, T. Using Kamlet−Taft Solvent Descriptors To Explain the Reactivity of Anionic Nucleophiles in Ionic Liquids. J. Org. Chem. 2006, 71, 8847–8853. [Google Scholar] [CrossRef] [PubMed]
  26. Ranieri, G.; Hallett, J.P.; Welton, T. Nucleophilic Reactions at Cationic Centers in Ionic Liquids and Molecular Solvents. Ind. Eng. Chem. Res. 2008, 47, 638–644. [Google Scholar] [CrossRef]
  27. Hawker, R.R.; Haines, R.S.; Harper, J.B. The effect of varying the anion of an ionic liquid on the solvent effects on a nucleophilic aromatic substitution reaction. Org. Biomol. Chem. 2018, 16, 3453–3463. [Google Scholar] [CrossRef]
  28. Butler, B.J.; Harper, J.B. The effect of the structure of the anion of an ionic liquid on the rate of reaction at a phosphorus centre. J. Phys. Org. Chem. 2019, 32, e3819. [Google Scholar] [CrossRef]
  29. Reichardt, C. Polarity of ionic liquids determined empirically by means of solvatochromic pyridinium N-phenolate betaine dyes. Green Chem. 2005, 7, 339–351. [Google Scholar] [CrossRef]
  30. Chiappe, C.; Pomelli, C.S.; Rajamani, S. Influence of Structural Variations in Cationic and Anionic Moieties on the Polarity of Ionic Liquids. J. Phys. Chem. B 2011, 115, 9653–9661. [Google Scholar] [CrossRef]
  31. Ab Rani, M.A.; Brant, A.; Crowhurst, L.; Dolan, A.; Lui, M.; Hassan, N.H.; Hallett, J.P.; Hunt, P.A.; Niedermeyer, H.; Perez-Arlandis, J.M.; et al. Understanding the polarity of ionic liquids. Phys. Chem. Chem. Phys. 2011, 13, 16831–16840. [Google Scholar] [CrossRef] [PubMed]
  32. Spange, S.; Lungwitz, R.; Schade, A. Correlation of molecular structure and polarity of ionic liquids. J. Mol. Liq. 2014, 192, 137–143. [Google Scholar] [CrossRef]
  33. Kamlet, M.J.; Taft, R.W. The solvatochromic comparison method. I. The β-scale of solvent hydrogen-bond acceptor (HBA) basicities. J. Am. Chem. Soc. 1976, 98, 377–383. [Google Scholar] [CrossRef]
  34. Taft, R.W.; Kamlet, M.J. The solvatochromic comparison method. 2. The α-scale of solvent hydrogen-bond donor (HBD) acidities. J. Am. Chem. Soc. 1976, 98, 2886–2894. [Google Scholar] [CrossRef]
  35. Yokoyama, T.; Taft, R.W.; Kamlet, M.J. The solvatochromic comparison method. 3. Hydrogen bonding by some 2-nitroaniline derivatives. J. Am. Chem. Soc. 1976, 98, 3233–3237. [Google Scholar] [CrossRef]
  36. Kamlet, M.J.; Abboud, J.L.; Taft, R.W. The solvatochromic comparison method. 6. The π * scale of solvent polarities. J. Am. Chem. Soc. 1977, 99, 6027–6038. [Google Scholar] [CrossRef]
  37. Minesinger, R.R.; Jones, M.E.; Taft, R.W.; Kamlet, M.J. The solvatochromic comparison method. 5. Spectral effects and relative strengths of the first and second hydrogen bonds by 4-nitroaniline to hydrogen bond acceptor solvents. J. Org. Chem. 1977, 42, 1929–1934. [Google Scholar] [CrossRef]
  38. Yalcin, D.; Drummond, C.J.; Greaves, T.L. Solvation properties of protic ionic liquids and molecular solvents. Phys. Chem. Chem. Phys. 2020, 22, 114–128. [Google Scholar] [CrossRef]
  39. Reichardt, C. Pyridinium N-phenolate betaine dyes as empirical indicators of solvent polarity: Some new findings. Pure Appl. Chem. 2004, 76, 1903–1919. [Google Scholar] [CrossRef]
  40. Pardo, R.; Zayat, M.; Levy, D. ET(33) dye as a tool for polarity determinations: Application to porous hybrid silica thin-films. J. Photochem. Photobiol. A Chem. 2010, 210, 17–22. [Google Scholar] [CrossRef]
  41. Han, Q.; El Mohamad, M.; Brown, S.; Zhai, J.; Rosado, C.; Shen, Y.; Blanch, E.W.; Drummond, C.J.; Greaves, T.L. Small angle X-ray scattering investigation of ionic liquid effect on the aggregation behavior of globular proteins. J. Colloid Interface Sci. 2023, 648, 376–388. [Google Scholar] [CrossRef] [PubMed]
  42. Han, Q.; Binns, J.; Zhai, J.; Guo, X.; Ryan, T.M.; Drummond, C.J.; Greaves, T.L. Insights on lysozyme aggregation in protic ionic liquid solvents by using small angle X-ray scattering and high throughput screening. J. Mol. Liq. 2022, 345, 117816. [Google Scholar] [CrossRef]
  43. Han, Q.; Brown, S.J.; Drummond, C.J.; Greaves, T.L. Protein aggregation and crystallization with ionic liquids: Insights into the influence of solvent properties. J. Colloid Interface Sci. 2022, 608, 1173–1190. [Google Scholar] [CrossRef]
  44. Han, Q.; Smith, K.M.; Darmanin, C.; Ryan, T.M.; Drummond, C.J.; Greaves, T.L. Lysozyme conformational changes with ionic liquids: Spectroscopic, small angle X-ray scattering and crystallographic study. J. Colloid Interface Sci. 2021, 585, 433–443. [Google Scholar] [CrossRef] [PubMed]
  45. Han, Q.; Ryan, T.M.; Rosado, C.J.; Drummond, C.J.; Greaves, T.L. Effect of ionic liquids on the fluorescence properties and aggregation of superfolder green fluorescence protein. J. Colloid Interface Sci. 2021, 591, 96–105. [Google Scholar] [CrossRef]
  46. Poole, C.F. Chromatographic and spectroscopic methods for the determination of solvent properties of room temperature ionic liquids. J. Chromatogr. A 2004, 1037, 49–82. [Google Scholar] [CrossRef] [PubMed]
  47. Miao, S.; Imberti, S.; Atkin, R.; Warr, G. Nanostructure in amino acid ionic molecular hybrid solvents. J. Mol. Liq. 2022, 351, 118599. [Google Scholar] [CrossRef]
  48. Eyckens, D.J.; Demir, B.; Walsh, T.R.; Welton, T.; Henderson, L.C. Determination of Kamlet–Taft parameters for selected solvate ionic liquids. Phys. Chem. Chem. Phys. 2016, 18, 13153–13157. [Google Scholar] [CrossRef]
  49. Rauber, D.; Philippi, F.; Becker, J.; Zapp, J.; Morgenstern, B.; Kuttich, B.; Kraus, T.; Hempelmann, R.; Hunt, P.; Welton, T.; et al. Anion and ether group influence in protic guanidinium ionic liquids. Phys. Chem. Chem. Phys. 2023, 25, 6436–6453. [Google Scholar] [CrossRef]
  50. Brown, S.J.; Yalcin, D.; Pandiancherri, S.; Le, T.C.; Orhan, I.; Hearn, K.; Han, Q.; Drummond, C.J.; Greaves, T.L. Characterising a protic ionic liquid library with applied machine learning algorithms. J. Mol. Liq. 2022, 367, 120453. [Google Scholar] [CrossRef]
  51. Martínez, L.; Andrade, R.; Birgin, E.G.; Martínez, J.M. PACKMOL: A package for building initial configurations for molecular dynamics simulations. J. Comput. Chem. 2009, 30, 2157–2164. [Google Scholar] [CrossRef] [PubMed]
  52. Frisch, M.J.; Trucks, G.W.; Schlegel, H.B.; Scuseria, G.E.; Robb, M.A.; Cheeseman, J.R.; Scalmani, G.; Barone, V.; Petersson, G.A.; Nakatsuji, H.; et al. Gaussian 16 Rev. C.01; Gaussian Inc.: Wallingford, CT, USA, 2016. [Google Scholar]
  53. Wang, J.; Wolf, R.M.; Caldwell, J.W.; Kollman, P.A.; Case, D.A. Development and testing of a general amber force field. J. Comput. Chem. 2004, 25, 1157–1174. [Google Scholar] [CrossRef] [PubMed]
  54. Case, D.A.; Aktulga, H.M.; Belfon, K.; Ben-Shalom, I.Y.; Brozell, S.R.; Cerutti, D.S.; Cheatham, I.T.E.; Cisneros, G.A.; Cruzeiro, V.W.D.; Darden, T.A.; et al. Amber 2021; University of California: San Francisco, CA, USA, 2021. [Google Scholar]
  55. Abraham, M.J.; Murtola, T.; Schulz, R.; Páll, S.; Smith, J.C.; Hess, B.; Lindahl, E. GROMACS: High performance molecular simulations through multi-level parallelism from laptops to supercomputers. SoftwareX 2015, 1, 19–25. [Google Scholar] [CrossRef]
  56. Sousa da Silva, A.W.; Vranken, W.F. ACPYPE—AnteChamber PYthon Parser interfacE. BMC Res. Notes 2012, 5, 367. [Google Scholar] [CrossRef] [PubMed]
  57. Humphrey, W.; Dalke, A.; Schulten, K. VMD: Visual molecular dynamics. J. Mol. Graph. 1996, 14, 33–38. [Google Scholar] [CrossRef]
  58. Yalcin, D.; Christofferson, A.J.; Drummond, C.J.; Greaves, T.L. Solvation properties of protic ionic liquid–molecular solvent mixtures. Phys. Chem. Chem. Phys. 2020, 22, 10995–11011. [Google Scholar] [CrossRef] [PubMed]
  59. Yalcin, D.; Drummond, C.J.; Greaves, T.L. High throughput approach to investigating ternary solvents of aqueous non-stoichiometric protic ionic liquids. Phys. Chem. Chem. Phys. 2019, 21, 6810–6827. [Google Scholar] [CrossRef] [PubMed]
  60. Fumino, K.; Wulf, A.; Ludwig, R. Hydrogen Bonding in Protic Ionic Liquids: Reminiscent of Water. Angew. Chem. Int. Ed. 2009, 48, 3184–3186. [Google Scholar] [CrossRef] [PubMed]
  61. Evans, D.F.; Chen, S.-H.; Schriver, G.W.; Arnett, E.M. Thermodynamics of solution of nonpolar gases in a fused salt. Hydrophobic bonding behavior in a nonaqueous system. J. Am. Chem. Soc. 1981, 103, 481–482. [Google Scholar] [CrossRef]
  62. Greaves, T.L.; Kennedy, D.F.; Mudie, S.T.; Drummond, C.J. Diversity Observed in the Nanostructure of Protic Ionic Liquids. J. Phys. Chem. B 2010, 114, 10022–10031. [Google Scholar] [CrossRef]
  63. MacFarlane, D.R.; Forsyth, M.; Izgorodina, E.I.; Abbott, A.P.; Annat, G.; Fraser, K. On the concept of ionicity in ionic liquids. Phys. Chem. Chem. Phys. 2009, 11, 4962–4967. [Google Scholar] [CrossRef] [PubMed]
  64. Brown, S.J.; Ryan, T.M.; Drummond, C.J.; Greaves, T.L.; Han, Q. Lysozyme aggregation and unfolding in ionic liquid solvents: Insights from small angle X-ray scattering and high throughput screening. J. Colloid Interface Sci. 2024, 655, 133–144. [Google Scholar] [CrossRef] [PubMed]
  65. Han, Q.; Wang, X.; Bynre, N. Utilizing Water Activity as a Simple Measure to Understand Hydrophobicity in Ionic Liquids. Front. Chem. 2019, 7, 112. [Google Scholar] [CrossRef] [PubMed]
  66. Han, Q.; Wang, X.; Byrne, N. Understanding the Influence of Key Ionic Liquid Properties on the Hydrolytic Activity of Thermomyces lanuginosus Lipase. ChemCatChem 2016, 8, 1551–1556. [Google Scholar] [CrossRef]
  67. Han, Q.; Su, Y.; Smith, K.M.; Binns, J.; Drummond, C.J.; Darmanin, C.; Greaves, T.L. Probing ion-binding at a protein interface: Modulation of protein properties by ionic liquids. J. Colloid Interface Sci. 2023, 650, 1393–1405. [Google Scholar] [CrossRef]
Figure 1. The chemical structures, names and abbreviations of (a) the solvatochromic dyes used for calculation of KAT parameters and the ET(30) scale, (b) previously uncharacterized PILs that have been characterized for their solvation properties via solvatochromic dye absorbance analysis in this study (in the red frame), and (c) PILs from the literature previously characterized for their solvation properties and have been analyzed in this study via MD simulations for their respective RDF plots.
Liquids 04 00014 g001
Figure 2. The calculated ET(30) values of PILs separated by anion. The experimental values determined in this study are denoted by a circle (●) and the reported values from Yalcin et al. [38] are denoted by a triangle (). The error bars are smaller than the symbols, and the values are provided in Table 1.
Liquids 04 00014 g002
Figure 3. The calculated π* values of PILs separated by anion. The experimental values determined in this study are denoted by a circle (●) and the reported values from Yalcin et al. [38] are denoted by a triangle (). The error bars are smaller than the symbols, and the values are provided in Table 1.
Liquids 04 00014 g003
Figure 4. The calculated α values of PILs separated by anion. The experimental values determined in this study are denoted by a circle (●) and the reported values from Yalcin et al. [38] are denoted by a triangle (). The error bars are smaller than the symbols, and the values are provided in Table 1.
Liquids 04 00014 g004
Figure 5. The calculated β values of PILs separated by anion. The experimental values determined in this study are denoted by a circle (●) and the reported values from Yalcin et al. [38] are denoted by a triangle (). The error bars are smaller than the symbols, and the values are provided in Table 1.
Liquids 04 00014 g005
Disclaimer/Publisher’s Note: The statements, opinions and data contained in all publications are solely those of the individual author(s) and contributor(s) and not of MDPI and/or the editor(s). MDPI and/or the editor(s) disclaim responsibility for any injury to people or property resulting from any ideas, methods, instructions or products referred to in the content.

