Article

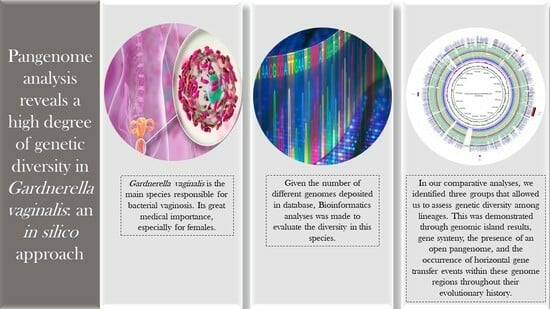
Pangenome Analysis Reveals a High Degree of Genetic Diversity in Gardnerella vaginalis: An In Silico Approach

by
Andrei Giacchetto Felice
1,*,
Eduarda Guimarães Sousa
2,
Fabiana Vieira Dominici
1,
Vasco Ariston de Carvalho Azevedo
2 and
Siomar de Castro Soares
1,*
1
Laboratory of Bioinformatics, Institute of Biological and Natural Sciences, Department of Microbiology, Immunology and Parasitology, Federal University of Triângulo Mineiro, Educational Center Campus, Uberaba 38025-180, MG, Brazil
2
Cellular and Molecular Genetics Laboratory, Institute of Biological Sciences, Department of General Biology, Federal University of Minas Gerais, Pampulha Campus, Belo Horizonte 31270-901, MG, Brazil
*
Authors to whom correspondence should be addressed.
Venereology 2023, 2(4), 132-146; https://doi.org/10.3390/venereology2040012
Submission received: 21 August 2023 / Revised: 18 September 2023 / Accepted: 28 September 2023 / Published: 30 September 2023

Abstract

:
The genus Gardnerella comprises Gram-variable, anaerobic, hemolytic, and non-motile bacilli, with four known species, where Gardnerella vaginalis is the main species responsible for bacterial vaginosis (BV). However, quantifying this species is challenging due to a lack of data and underreporting. Despite its significance, particularly for women, and the availability of several genomes in online databases, genomic analyses and studies on effective treatments still lack details. This study aimed to conduct bioinformatic analyses focused on pangenomics to investigate the complete gene repertoire of the species. Genomes of the bacterium available in online databases were used for comparative genomics, genomic plasticity, gene synteny, and pangenome prediction analyses. The results revealed considerable genome variability, indicating a highly diverse pangenome. The low number of genes in the core genome and similarity analysis confirmed this variability. Three pathogenicity islands, two resistance islands, and nine genomic islands were identified, suggesting horizontal gene transfer events during evolution. These findings underscore the need for sequencing new G. vaginalis genomes to better comprehend its variability and adaptation patterns.

Graphical Abstract

1. Introduction

The genus Gardnerella was proposed in the 1980s by Greenwood and Pickett after conducting Adansonian analyses, DNA–DNA hybridization methods, electron microscopy, and biochemical analyses against microorganisms of other genera such as Haemophilus, Pasteurella, and Streptococcus [1]. They believed there was no relationship between Haemophilus vaginalis, previously proposed as the Gram-negative microorganism isolated in both men and women [1,2,3], and these bacteria.
The species Gardnerella vaginalis has a thin layer of peptidoglycan and is considered Gram-positive. However, this layer can bleach, making it appear Gram-negative and, thus, it is classified as Gram-variable. They are non-motile bacilli and may present fimbriae or not [4,5,6]. This bacterium has a well-understood but often underestimated pathogenic potential. It can form biofilms, hindering effective treatment and increasing its chance of survival in the host [7]. Additionally, it can produce enzymes with prolidase and sialidase activities, which function as toxins, enabling greater adhesion and destruction of human tissue, and are also related to cases of premature births and abortions [8,9,10]. Another important virulence factor is vaginolysin, which causes disturbances in the host immune system and lysis of erythrocytes [11,12,13].
In this new genus, the G. vaginalis species accounts for more than 50% of bacterial vaginosis (BV) cases in women and is the most recently studied [14]. Previous studies allowed the description of three more new species, later characterized by Vaneechoutte et al. in 2019 [6], named Gardnerella leopoldii sp. nov., Gardnerella biotic sp. nov., and Gardnerella swidsinskii sp. nov. This classification was possible by analyzing the isolated G. vaginalis species using 16S RNA gene amplification [4,8,11,15,16] and neighboring cluster analysis by Ahmed et al. [17]. Additionally, all these species are related to cases of BV, with some species having a more significant relation to symptoms of the clinical condition than others, according to some Nugent/Amsel criteria [18].
The vaginal microbiota is composed mainly of Döderlein Bacillus, which are microorganisms of the genus Lactobacillus responsible for maintaining the acidic pH of the vagina, protecting against pathogens through the production of hydrogen peroxide (H2O2). An imbalance in this vaginal flora causes bacterial vaginosis (BV)-type infections, where there is a decrease in lactobacilli [18,19,20]. In association, an increase in anaerobic bacteria such as G. vaginalis is observed, resulting in a higher vaginal pH and making the patient susceptible to BV.
The main characteristics of BV, besides the increased pH, are the discomfort reported due to a white, gray, or yellowish vaginal discharge and a foul-smelling odor that may increase with coitus or menstruation. If left untreated, it can cause more severe problems such as salpingitis and endometritis in women, and in men, it can cause itching in the penile area and discomfort when urinating [21,22].
BV is a widespread infection reported among sexually active women; it is estimated that between 10% and 30% of women are diagnosed worldwide [23,24]. Additionally, countries with a high frequency of HIV report that the frequency of BV is 50% in women. Studies have shown that the primary pathogens related to vaginosis are Candida sp. (56.3%), followed by G. vaginalis (35%) [25]. Several risk factors are related to the development of this pathology, including having many sexual partners, using intrauterine devices (IUDs) and vaginal douches, and engaging in oral sex [26,27,28,29]. Moreover, a strong relationship exists between the very early initiation of sexual activity and a low educational level [27,30].
Through oncotic cytology, more specifically the Papanicolaou technique, the inflammatory and infectious processes can be diagnosed along with their etiological agents. This exam is usual in women’s health routine every year; it is easy to perform, is a low-cost approach, and is an advantage that facilitates the diagnosis of BV and enables faster treatment [31]. However, a confirmatory diagnosis of BV requires the presence of at least three of four signs: (I) positive amine test; (II) presence of clue cells; (III) grayish or yellowish discharge; and (IV) vaginal pH higher than 4.7 [32,33,34].
BV treatment focuses primarily on restoring the balance of the vaginal flora by decreasing the number of anaerobic microorganisms and increasing the number of lactobacilli. There is a range of therapeutic options, including using antibiotics such as nitroimidazole or even establishing physiological control of the vaginosis through hydrogen peroxide ingestion via vaginal douching [3,34,35,36,37,38,39]. However, despite all these treatments, the number of BV cases has constantly increased over the years.
The study of G. vaginalis is necessary and essential, given the number of different genomes deposited in databases, and it is of great medical importance, especially for females. There is a need for more genomic studies, such as using bioinformatics, to assist in future research on this species. Such works can help identify the distribution patterns of the species using recent whole-genome molecular epidemiology techniques and identify potential virulence factors that may be related to pathological factors. In this work, several methodologies are used to identify mechanisms and the diversity of the organisms to help in future research with the species G. vaginalis.

2. Materials and Methods

2.1. Genome Information

RefSeq and NCBI (National Center for Biotechnology Information) databases (https://www.ncbi.nlm.nih.gov/-accessed on 9 August 2022) were used to download the genomes in “.fna” format to perform the genomic analyses of G. vaginalis. Sixteen genomes were used for phylogenomic and phylogenetic analyses, along with seven complete genomes of G. vaginalis and nine representative genomes from different clades, according to the tree available at the NCBI (Table 1).
To perform the pangenome analysis, 107 genomes of G. vaginalis available in the NCBI (till the first half of 2022) in the “.faa” format were used, which were classified as follows: 7 complete genomes; 1 chromosome; 63 scaffolds; and 36 contigs. The annotation of each of these genomes was performed with the Prokka software (version 1.14.6, Tseemann, 2020) [40] using the default parameters plus the options: ‘addgenes’ and ‘rnammer’. More information about the 107 genomes is described in Supplementary Table S1.
In addition to the genomes of the bacteria under study, the reference genome of the organism Alloscardovia omnicolens (DSM21503) was downloaded in the same formats as mentioned above. It was added to all the analyses to function as an outgroup, which helps the analyses to be more parsimonious when analyzing the group of interest [41].

2.2. Phylogenomic Analysis and Phylogenetic Reconstruction

The software Gegenees (version 3.1, Segerman, 2019) [42] was used to perform the phylogenomic analyses; its methodology is based on the similarity analysis between the genomes through a strategy followed by genome sequence fragmentation and DNA alignment using a BLASTn algorithm to obtain a distance matrix and the phylogeny analysis. The genome fragmentation occurs using user-defined lengths and step sizes. Here, we used a size of 500 bp and a step size of 500 bp too. Finally, a heatmap was generated, showing the percentage of similarity between the strains in a range of 0 to 100%.
In addition, an analysis to identify polymorphic genes and whether there is phylogenetic interference in a gene-by-gene analysis was performed using the online software PGAdb-builder [43] with a wgMLST (whole genome multilocus sequence typing) analysis. The resulting PGAdb profile was performed using 90% coverage and 90% identity filters. This profile was exported in the “.newick” format to the MEGA software (version 11, Kumar, 2021) [44] for generating a phylogenetic tree.

2.3. Genomic Plasticity via Identification of Genomic Islands

Plasticity analyses were performed with GIPSy (version 1.1.3, Soares, 2016) (Genomic Island Prediction Software) to identify genomic islands, genomic regions acquired via horizontal gene transfer (HGT), which contain information about the microorganism lifestyle. The prediction is based on several features, such as codon usage and G + C content; insertion sequences or flanking tRNAs flanking; presence of transposases; and varied size [45]. The genomic islands were classified into pathogenicity, resistance, and metabolic islands with their respective genes. For this analysis, one non-pathogenic organism was chosen to be compared with the reference organism chosen in this work.
The genomic islands identified with GIPSy were plotted using the BRIG software (version 0.95, Alikhan, 2011) (BLAST Ring Image Generator) [46], which performs a comparative analysis of all genomes against a reference genome. A circular figure was generated where each ring represents a different genome, and the blank areas represent deletion areas. The last ring exhibits the genomic islands.

2.4. Gene Synteny

The software Mauve (version snapshot_2015_02_13 build 0, Darling Lab, 2015) [47], along with the progressive Mauve algorithm, was used for gene synteny analysis, where it was possible to identify possible gene rearrangement events. By fragmenting the genomes into pre-defined sizes, the software built multiple genome alignments identifying locally collinear blocks (LCB) plotted in a figure, which is usable for identifying these rearrangements.

2.5. Prediction of Orthologous Genes and Pangenome Development

Using the Orthofinder software (version 2.5.4, Emms, 2021) [48], the prediction of orthologous genes was performed, where all genomes were compared against all using the DIAMOND algorithm (version 2.0.14, Buchfink, 2021). This software uses the MCL program (Markov Clustering algorithm) for such prediction [49]. Through in-house script (orthofinder_pangenome_splitter.pl), three ortho groups were generated, which are core genome, which is composed of all genes that are commonly shared by all strains, involved mainly in essential cellular processes; shared, which is composed of genes that are present in two or more strains but not all; and singletons that are classified as strain-specific genes, which are present in only one strain. The genes in the latter subset are related to adaptation processes, both to the environment and the host [50,51].
To analyze the pangenome, Heap’s Law was used together with in-house scripts (pandev.pl) to estimate the fixed parameters and the least squares fitting of the exponential regression decay (core genome and singletons). For the fixed parameters from the pangenome, Heap’s Law is used. It is an empirical law, and it is represented by the formula n = k* N ^y, where a given number of genes (n) is calculated for a given number of genomes (N), and k and y (α = 1 − y) are free parameters. When α > 1, according to the law, one can consider this pangenome closed, meaning the addition of genomes has no substantial effect in the total number of genes. When α < 1, the pangenome is considered open, meaning there will be a significant increase in the number of genes for each new genome added to the analysis. The formula used for least-squares fit is represented by n = k × exp[−x/t] + tgθ, where n is the number of genes, and k, t, and tgθ are free parameters. This law is utilized to infer how many genes will compose the core genome after stabilized [52,53] and to estimate approximately how many genes are added by each new sequenced genome.

2.6. Orthology Assignments and Functional Annotation

The analyses of the core genome, shared genes, and singletons subsets were classified according to the Cluster of Orthologous Genes (COG), where the CDS of the subsets were aligned and classified according to the functional categories of the COG. For this, eggNOG-mapper (version 2.1.11, Cantalapiedra, 2023) was used, a database that performs this annotation according to orthologous genes [54]. Each sequence was mapped using either the hidden Markov model (HMM) or DIAMOND to align with the eggNOG database. The best matching sequence of the target sequence is classified according to its taxonomy and finally categorized and annotated according to gene ontology (GO) [55], KEGG pathways [56], and COG functional categories [57].
The functional categories are divided mainly into (1) information processing and storage; (2) signaling and cellular processes; (3) metabolism; and (4) poorly characterized and are subdivided into 17 subcategories [58].

3. Results

3.1. Phylogenetic Analysis

The Gegenees software analyses demonstrated a color variation from green to red showing the degree of similarity between the strains (Figure 1), where almost all the complete genomes are close with similarity ranging from 71 to 100% inside this cluster (cluster 1). Strains such as UMB0833, JCP7659, and JCP8070, scaffold genomes, grouped in cluster 2, with similarity ranging from 72 to 100% inside the cluster, with a medium similarity of 38 to 46% with cluster 1 and a low similarity with cluster 3 (15 to 19%). In addition, G. vaginalis GV37, 409-05 (both complete genomes), and UMBB0913, scaffold, grouped in cluster 3, showing a low similarity of approximately 18% with the other two clusters. The others represented in an orange shade had a median similarity and comprised scaffold genomes.
The data generated with the PGAdb-builder software were plotted in the MegaX software to visualize a phylogenetic tree (Figure 2), where the strains form the same clusters found in the heatmap of Gegenees.

3.2. Genomic Plasticity

For the prediction of genomic islands, the genome plasticity analysis with software GIPSy was performed, where we can observe through the BRIG’s results the pathogenicity and resistance islands plotted in the outermost circle of the image, with comparative genomic plasticity results. For the comparative genomic plasticity analysis, it was used a reference genome according to the NCBI, which is the G. vaginalis strain FDAARGOS 568. In the circle image, each ring represents one strain, and the presence of blank regions in each ring demonstrates a deletion of this genome part concerning the reference genome in the most central ring. It can be seen that there are two large deletion regions in almost all the genomes and the other deletions appear only in preliminary genomes and are present in almost all the complete genomes. The last ring related to the genome of Alloscardovia omnicolens DSM21503 is a ring with many deletions compared to the species studied.
Figure 3 also shows the presence of three pathogenicity islands, two resistance islands, and two metabolic islands in the last three outermost rings. Resistance island 1 and pathogenicity island 2 overlap approximately at a position of 200 kpb, and resistance island 2 and pathogenicity island 3 overlap approximately at a position of 500~600 kpb. These regions can present genes related to virulence increase and resistance against antibiotics, and some draft genomes can present some deletions at the beginning of these islands. The other islands also present some deletions when compared with some genomes.
Supplementary Figures S1–S3 show a comparative analysis between the clusters according to the similarity predicted in the previous results. When the comparative analysis was conducted, the genomes classified as scaffolds showed a greater, more significant deletion. Furthermore, Supplementary Figure S3 shows a more homogeneous relationship of these genomes forming clusters, while the other figures of clusters 1 and 2 (Supplementary Figures S1 and S2) show the presence of more broken regions.

3.3. Gene Synteny

The software Mauve was used to visualize the synteny between the various genomic sequences, where through the homology between them, it was possible to visualize possible rearrangements. Synteny is observed through gene blocks for better identification. Several broken regions may be observed, with many inversions and deletions of many regions, in the comparison between all genomes (Figure 4). A remarkable homogeneity was observed in cluster 1 (Supplementary Figure S4), with highly conserved blocks when compared to clusters 2 and 3 (Supplementary Figure S5 and S6), which showed inversions and deletions.

3.4. Pangenome Development

OrthoFinder separated these genomes into three different groups, core genes, shared genes, and singletons to predict orthologous genes, where 3563 non-redundant genes were found and classified as pangenome genes, with 208 genes being in the core genome group and 237 genes in the singletons group.
For the analyses with pangenome, the alpha value from Heap’s Law when all genomes are analyzed was less than 1, being approximately 0.75 (α = 1 − 0.248), inferring an open genome. However, the core genome is close to closing, with 208 genes and stabilizing with 152 genes (Figure 5). Figure 6 shows the number of singletons in each of the genomes used, where the number changes, and some have more singletons than others.

3.5. Orthologous Genes Characterization

The orthologous gene analyses are plotted in Figure 7 and Figure 8, showing the COG classifications of the core genome, shared genome, and singletons, respectively. It is observed that the categories between these two analyses differ regarding the classification, prevailing in the core, the COG J, which is related to translation, ribosomal, and biogenesis functions, differently from what is seen from the shared and singleton types that prevail but are not yet categorized and have unknown functions.
The second category that is more prevalent in core classifications is COG F, more related to nucleus transport and metabolism, and for shared and singletons classifications, COG L is related to the replication, recombination, and repair of genomic content. Furthermore, there was no prevalence of a common category in these analyses.

4. Discussion

G. vaginalis is a species of great medical importance, being one of the primary pathogens responsible for bacterial vaginosis, with high importance in women’s health, and there are several reports and a certain problematization in the notification of these diseases as well as in the understanding of the consequences that it brings and how the different strains of this same species can behave differently in the host. Little is known about studies using comparative genomics to analyze the gene diversity of G. vaginalis. First, sixteen (16) genomes considered representative of the clusters grouped in the phylogenetic tree in the NCBI databases were used to analyze their distribution at the genomic level, their similarities, and differences throughout the evolution.
In all comparative analyses performed in this work, the strains present the same pattern. There is a formation of three clusters, with the first grouping all of the complete genomes; the second grouping the draft genome of the strains UMB0833, JCP7659, and JCP8070; and finally, the third cluster grouping the strains GV37, 409-05 (these being complete genomes), and UMB0913, considered as draft genome. Cluster 1 presents similarity above 80%, being always grouped in the same way and with a few deletions. Although close, it shows much translocation and a few inversion processes over time, which can be related to adaptation processes. Cluster 2 presents a median similarity, around 45%, with more deleted regions and much translocation and inversion process. Moreover, cluster 3 was more unexpected because it grouped different degrees of complementary types, being less similar with more events of evolution when compared with the other clusters, but inside this cluster, the genomes are so close and present almost the same patterns.
Firstly, in an attempt to explain how these clusters were formed, we researched more information about the epidemiology of these genomes, especially their extraction site. Unfortunately, only five samples had their extraction sites identified in the NCBI, as shown in Table 1 of the materials and methods. Once these sites had been identified, we realized that the clustering of these species was not related to their extraction site, since species as UMB0736 and UMB0298, both extracted in Maywood, USA were allocated in cluster 1; UMB0833, also extracted in Maywood, USA, was allocated in cluster 2; and, finally, GV37, which were extracted in Paris, France and UMB0913, which were extracted in Maywood, USA, were grouped in cluster 3. Then, although most of the species that we are able to identify were extracted from the same place, they do not show high clonality patterns, which corroborates the high plasticity found in the genomic plasticity analyses.
However, this work corroborates another work in diversity analysis inside the Gardnerella genus, where they found a polyphyletic organization, sorting this genus into nine distinct genotypes. In agreement with this work, our cluster 3, which grouped GV37, 409-05, and UMB0913 strains, can be considered as part of GGtype4, a group that presented genomes from strains that were considered less virulent organisms, and the other strains belonging to cluster 1 can be considered as part of GGtype9, a group which presents genomes from strains that were considered as more virulent organisms [59]. In addition, this work also suggests that the UMB0833 strain, part of cluster 2, can be considered as GGtype7, which presents characteristics like cluster 1 and may be classified as more virulent organisms. A study by Bohr L. et al. [60] used a different methodology, from DNA extraction to the characterization of the genes present in the pangenome and also corroborates the findings in our study and in the aforementioned study, in which they separated the clusters in the same way. Furthermore, this study demonstrates the significance of lateral gene transfer in the diversity process under discussion. Our findings, as depicted in Figure 3, have successfully identified certain genes associated with pathogenicity and resistance through genomic islands originating from horizontal gene transfer. Our research paves the way for more in-depth investigations into the genes related to these mechanisms in an effort to ascertain whether HGT may indeed play a pivotal role in influencing diversity. Moreover, it guides future endeavors aimed at exploring these genes and their encoded proteins for potential utilization as diagnostic markers, as well as therapeutic and preventive measures against bacterial vaginosis.
This genomic difference between the strains of G. vaginalis in different groups was also observed in several studies, such as in the amplified restriction analysis of ribosomal DNA (ARDRA) identifying two genotypes among 17 samples of G. vaginalis, where they considered the existence of a biotype 3 even though it was not identified due to the limiting number of isolates and, also, to the region where they were obtained [11]. Other comparative analysis studies showed the existence of four different biotypes of G. vaginalis in the analysis of neighboring clusters between genes and perceived the formation of unexpected clades between them, which corroborates our study [17]. This was later confirmed in PCR analyses of the cpn 6 gene sequence, confirming the previous result where four different groups were formed within the same species [6].
A pangenome analysis was performed in this work, where the genes were separated into three distinct groups: the core genes present in all strains; shared genes among some but not all strains; and singletons, with genes specific to each strain. The latter two groups are related to the process of evolution and adaptation of each strain, thus helping in better understanding the behavior of this species during its evolution. In the results, the species showed a wide-open pangenome with an alpha value lower than 1 (0.75), a core genome with approximately 208 genes, and the number of singletons added by each sequenced genome to the pangenome was shown to be very low after stabilization, with an estimate of less than one gene added. The core stabilization value is very close (~152 genes), and the wide-open pangenome and the tangent of theta value of singletons indicate the possibility of this pangenome closing, as genes are being added; however, it may take some time for this to happen. This variation is also observed in the Venn diagram of singleton genes (Figure 6B), where some genomes have more genes, being more variable than others. For example, strain AMD with 46 genes, 5-1 with 43 genes, and 409-05 with 29 genes.
Altogether, we can better understand the result found in the functional analysis of COG that represents a functional analysis of the behavior of this bacterium. When analyzing the core genome, proteins classified as COG J were more abundant than the others. COG J harbors proteins associated with translation, ribosomal structure, and biogenesis, which are functions commonly related to the functioning and survival of the bacterium, thus being essential for proliferation, differentiation, and development [61], as well as also helping the pathogen to adapt to changes in external physicochemical parameters; furthermore, another highly abundant functional category in the core genome was COG F, which is related to nucleotide transport and metabolism that are essential to all genomes once it is related to energy production in the organism. From another perspective, when we compare the COG categories between the singleton and shared genes with those of the core genes, in its totality, there are many genes in categories that are not very well described yet, which can be possibly accounted to genes acquired over the years in the process of adaptation of each strain, which would explain this diversity as well. In addition, for this analyzed set, the second category found was COG L, related to replication, recombination, and repair, which have essential roles in the adaptation process and diversity [62,63].

5. Conclusions

In conclusion, it can be observed that some genomes exhibit greater similarity among themselves when considering genomes within the same clade, as opposed to comparisons with genomes from different clades. When examining the evolutionary history and, in particular, the arrangement of their genes, some degree of this similarity becomes evident. However, a more pronounced divergence is now apparent when analyzing the gene order across the entirety of the genomes over the course of evolution. This comprehensive understanding sheds light on the genome’s diversity. Moreover, regions of horizontal gene transfer were identified, which may serve as a pivotal factor contributing to this diversity. When compared with the pangenome, it becomes apparent that new genes can be added with the discovery of new genomes, further amplifying this aspect. Analysis of the functions associated with these genes was anticipated when examining the core genome, with genes fulfilling crucial metabolic roles for survival. Nonetheless, the other two subsets contain genes with unknown functions, which may potentially generate new genes and contribute to an expanded diversity.
These findings hold significant relevance for future studies focusing on the search for resistance and virulence genes as targets for diagnostics or therapeutics. However, they should be corroborated through in vitro and in vivo experimentation.

Supplementary Materials

The following supporting information can be downloaded at https://www.mdpi.com/article/10.3390/venereology2040012/s1, Figure S1: Cluster 1 analysis with BRIG software; Figure S2: Cluster 2 analysis with BRIG software; Figure S3: Cluster 1 analysis with BRIG software; Figure S4: Cluster 1 analysis with Mauve software; Figure S5: Cluster 2 analysis with Mauve software; Figure S6: Cluster 3 analysis with Mauve software; Table S1: Genomes informations.

Author Contributions

A.G.F. and E.G.S. performed the download, all data processing and analysis, participated in the study design, and wrote this manuscript; F.V.D. helped in the data processing and in the writing of this manuscript; V.A.d.C.A. coordinated the study; S.d.C.S. designed, coordinated the study, helped with analysis, and wrote this manuscript. All authors have read and agreed to the published version of the manuscript.

Funding

This research received no external funding.

Institutional Review Board Statement

Not applicable.

Informed Consent Statement

Not applicable.

Data Availability Statement

Genome sequences are available in the NCBI database.

Acknowledgments

We thank the agencies of the Brazilian Federal Agency for Support and Evaluation of Graduate Education (CAPES) and the Minas Gerais Research Funding Foundation (FAPEMIG). We give our thanks to the post-graduate program in Genetics at the Federal University of Minas Gerais and the post-graduate program in Medicina Tropical e Infectologia at the Federal University of Triângulo Mineiro.

Conflicts of Interest

The authors declare no conflict of interest.

References

  1. Greenwood, J.R.; Pickett, M.J. Transfer of Haemophilus vaginalis Gardner and Dukes to a new genus, Gardnerella: G. vaginalis (Gardner and Dukes) comb. nov. Int. J. Syst. Bacteriol. 1980, 30, 170–178. [Google Scholar] [CrossRef]
  2. Leopold, S. Heretofore undescribed organism isolated from the genitourinary system. U. S. Armed Forces Med. J. 1953, 4, 263–266. [Google Scholar] [PubMed]
  3. Gardner, H.L.; Dukes, C.D. Haemophilus vaginalis vaginitis: A newly defined specific infection previously classified “nonspecific” vaginitis. Am. J. Obstet. Gynecol. 1955, 69, 962–976. [Google Scholar] [CrossRef] [PubMed]
  4. Piot, P.; van Dyck, E.; Peeters, M.; Hale, J.; Totten, P.A.; Holmes, K.K. Biotypes of Gardnerella vaginalis. J. Clin. Microbiol. 1984, 20, 677–679. [Google Scholar] [CrossRef] [PubMed]
  5. Hernández, F. Gardnerella vaginalis y mobiluncus en la etiología de la vaginosis bacteriana. Rev. Costarric Cienc Méd. 1998, 19, 107–116. [Google Scholar]
  6. Vaneechoutte, M.; Guschin, A.; Van Simaey, L.; Gansemans, Y.; Van Nieuwerburgh, F.; Cools, P. Emended description of Gardnerella vaginalis and description of Gardnerella leopoldii sp. nov., Gardnerella piotii sp. nov. and Gardnerella swidsinskii sp. nov., with delineation of 13 genomic species within the genus Gardnerella. Int. J. Syst. Evol. Microbiol. 2019, 69, 679–687. [Google Scholar] [CrossRef]
  7. Patterson, J.L.; Stull-Lane, A.; Girerd, P.H.; Jefferson, K.K. Analysis of adherence, biofilm formation and cytotoxicity suggests a greater virulence potential of Gardnerella vaginalis relative to other bacterial-vaginosis-associated anaerobes. Microbiology 2010, 156 Pt 2, 392–399. [Google Scholar] [CrossRef]
  8. Lopes Dos Santos Santiago, G.; Deschaght, P.; El Aila, N.; Kiama, T.N.; Verstraelen, H.; Jefferson, K.K.; Temmerman, M.; Vaneechoutte, M. Gardnerella vaginalis comprises three distinct genotypes of which only two produce sialidase. Am. J. Obstet. Gynecol. 2011, 204, 450.e1–450.e7. [Google Scholar] [CrossRef]
  9. Briselden, A.M.; Moncla, B.J.; Stevens, C.E.; Hillier, S.L. Sialidases (neuraminidases) in bacterial vaginosis and bacterial vaginosis-associated microflora. J. Clin. Microbiol. 1992, 30, 663–666. [Google Scholar] [CrossRef]
  10. Cauci, S.; Thorsen, P.; Schendel, D.E.; Bremmelgaard, A.; Quadrifoglio, F.; Guaschino, S. Determination of Immunoglobulin A against Gardnerella vaginalis Hemolysin, Sialidase, and Prolidase Activities in Vaginal Fluid: Implications for Adverse Pregnancy Outcomes. J. Clin. Microbiol. 2003, 41, 435. [Google Scholar] [CrossRef]
  11. Pleckaityte, M.; Janulaitiene, M.; Lasickiene, R.; Zvirbliene, A. Genetic and biochemical diversity of Gardnerella vaginalis strains isolated from women with bacterial vaginosis. FEMS Immunol. Med. Microbiol. 2012, 65, 69–77. [Google Scholar] [CrossRef] [PubMed]
  12. Gelber, S.E.; Aguilar, J.L.; Lewis, K.L.T.; Ratner, A.J. Functional and phylogenetic characterization of vaginolysin, the human-specific cytolysin from Gardnerella vaginalis. J. Bacteriol. 2008, 190, 3896–3903. [Google Scholar] [CrossRef] [PubMed]
  13. Cauci, S.; Monte, R.; Ropele, M.; Missero, C.; Not, T.; Quadrifoglio, F.; Menestrina, G. Pore-forming and haemolytic properties of the Gardnerella vaginalis cytolysin. Mol. Microbiol. 1993, 9, 1143–1155. [Google Scholar] [CrossRef] [PubMed]
  14. Bautista, C.T.; Wurapa, E.; Sateren, W.B.; Morris, S.; Hollingsworth, B.; Sanchez, J.L. Bacterial vaginosis: A synthesis of the literature on etiology, prevalence, risk factors, and relationship with chlamydia and gonorrhea infections. Mil Med Res. 2016, 13, 4. [Google Scholar] [CrossRef]
  15. Ingianni, A.; Petruzzelli, S.; Morandotti, G.; Pompei, R. Genotypic differentiation of Gardnerella vaginalis by amplified ribosomal DNA restriction analysis (ARDRA). FEMS Immunol. Med. Microbiol. 1997, 18, 61–66. [Google Scholar] [CrossRef]
  16. Schellenberg, J.J.; Jayaprakash, T.P.; Gamage, N.W.; Patterson, M.H.; Vaneechoutte, M.; Hill, J.E. Gardnerella vaginalis Subgroups Defined by cpn60 Sequencing and Sialidase Activity in Isolates from Canada, Belgium and Kenya. PLoS ONE 2016, 11, e0146510. [Google Scholar] [CrossRef]
  17. Ahmed, A.; Earl, J.; Retchless, A.; Hillier, S.L.; Rabe, L.K.; Cherpes, T.L.; Powell, E.; Janto, B.; Eutsey, R.; Hiller, N.L.; et al. Comparative genomic analyses of 17 clinical isolates of Gardnerella vaginalis provide evidence of multiple genetically isolated clades consistent with subspeciation into genovars. J. Bacteriol. 2012, 194, 3922–3937. [Google Scholar] [CrossRef]
  18. Leite, S.R.R.D.F.; Amorim, M.M.R.D.; Calábria, W.B.; Leite, T.N.D.F.; Oliveira, V.S.D.; Ferreira Júnior, J.A.A.; Ximenes, R.A.D. A Perfil clínico e microbiológico de mulheres com vaginose bacteriana. Rev. Bras. De Ginecol. E Obs. 2010, 32, 82–87. [Google Scholar] [CrossRef]
  19. Wilson, J. Managing recurrent bacterial vaginosis. Sex. Transm. Infect. 2004, 80, 8–11. [Google Scholar] [CrossRef]
  20. Schwebke, J.R. Gynecologic consequences of bacterial vaginosis. Obstet. Gynecol. Clin. N. Am. 2003, 30, 685–694. [Google Scholar] [CrossRef]
  21. Fethers, K.; Morris, M. Is bacterial vaginosis a sexually transmitted infection. Sex. Transm. Infect. 2001, 77, 390. [Google Scholar] [CrossRef]
  22. Tanaka, V.; Fagundes, L.J.; Catapan, A.; Gotlieb, S.L.D.; Belda, W., Jr.; Arnone, M.; Soreano, R.; Moraes, F.R. Epidemiological profile of women with bacterial vaginosis treated at a clinic for sexually transmitted diseases in the city of Sao Paulo, SP. An. Bras. Dermatol. 2007, 82, 41–46. [Google Scholar] [CrossRef]
  23. Formana, D.; de Martel, C.; Lacey, C.J.; Soerjomatarama, I.; Lortet-Tieulent, J.; Bruni, L.; Vignat, J.; Ferlay, J.; Bray, F.; Plummer, M.; et al. Global Burden of Human Papillomavirus and Related Diseases. Vaccine 2012, 30 (Suppl. S5), F12–F23. [Google Scholar] [CrossRef]
  24. Workowski, K.A.; Bachmann, L.H. Centers for Disease Control and Prevention’s Sexually Transmitted Diseases Infection Guidelines. Clin. Infect. Dis. 2022, 74 (Suppl. S2), S89–S94. [Google Scholar] [CrossRef] [PubMed]
  25. Lukic, A.; Napoli, A.; Santino, I.; Bianchi, P.; Nobili, F.; Ciampittiello, G.; Nardone, M.R.; Santomauro, M.; Di Properzio, M.; Caserta, D. Cervicovaginal bacteria and fungi in pregnant diabetic and non-diabetic women: A multicenter observational cohort study. Eur. Rev. Med. Pharmacol. Sci. 2017, 21, 2303–2315. [Google Scholar] [PubMed]
  26. Bradshaw, C.S.; Morton, A.N.; Hocking, J.; Garland, S.M.; Morris, M.B.; Moss, L.M.; Horvath, L.B.; Kuzevska, I.; Fairley, C.K. High recurrence rates of bacterial vaginosis over the course of 12 months after oral metronidazole therapy and factors associated with recurrence. J. Infect. Dis. 2006, 193, 1478–1486. [Google Scholar] [CrossRef] [PubMed]
  27. Marion, L.L.; Meeks, G.R. Ectopic pregnancy: History, incidence, epidemiology, and risk factors. Clin. Obstet. Gynecol. 2012, 55, 376–386. [Google Scholar] [CrossRef]
  28. Holzman, C.; Leventhal, J.M.; Qiu, H.; Jones, N.M.; Wang, J. Factors Linked to Bacterial Vaginosis in Nonpregnant Women. Am. J. Public Health 2011, 91, 1664–1670. [Google Scholar] [CrossRef]
  29. Marrazzo, J.M.; Wiesenfeld, H.C.; Murray, P.J.; Busse, B.; Meyn, L.; Krohn, M.; Hillier, S.L. Risk Factors for Cervicitis among Women with Bacterial Vaginosis. J. Infect. Dis. 2006, 193, 617–624. [Google Scholar] [CrossRef]
  30. Small, S.A.; Luster, T. Adolescent Sexual Activity: An Ecological, Risk-Factor Approach. J. Marriage Fam. 1994, 56, 181. [Google Scholar] [CrossRef]
  31. Anand, K.V.; Pimple, S.A.; Mishra, G.A.; Sahare, R.V.; Pathuthara, S.; Deodhar, K.K.; Shastri, S.S. Reliability of conventional Papanicolaou smear in diagnosing bacterial vaginosis among women with clinical genital infection. South Asian J. Cancer 2020, 9, 13–16. [Google Scholar] [CrossRef] [PubMed]
  32. Li, X.D.; Wang, C.C.; Zhang, X.J.; Gao, G.P.; Tong, F.; Li, X.; Hou, S.; Sun, L.; Sun, Y.-H. Risk factors for bacterial vaginosis: Results from a cross-sectional study having a sample of 53,652 women. Eur. J. Clin. Microbiol. Infect. Dis. 2014, 33, 1525–1532. [Google Scholar] [CrossRef] [PubMed]
  33. Denney, J.M.; Culhane, J.F. Bacterial vaginosis: A problematic infection from both a perinatal and neonatal perspective. Semin. Fetal Neonatal Med. 2009, 14, 200–203. [Google Scholar] [CrossRef] [PubMed]
  34. Adinkra, P.; Lamont, R.F. Adverse obstetric sequelae of bacterial vaginosis. Hosp. Med. 2000, 61, 475–477. [Google Scholar] [CrossRef]
  35. Molteni, B.; D’Antuono, A.; Bandini, P.; Sintini, G.; Barcellona, E.; Agnello, A.; Milani, M. Efficacy and tolerability of a new chlorhexidine-based vaginal gel in vaginal infections. Curr. Med. Res. Opin. 2004, 20, 849–853. [Google Scholar] [CrossRef]
  36. Miko, E.; Barakonyi, A. The Role of Hydrogen-Peroxide (H2O2) Produced by Vaginal Microbiota in Female Reproductive Health. Antioxidants 2023, 12, 1055. [Google Scholar] [CrossRef]
  37. Verstraelen, H.; Verhelst, R.; Roelens, K.; Temmerman, M. Antiseptics and disinfectants for the treatment of bacterial vaginosis: A systematic review. BMC Infect. Dis. 2012, 12, 148. [Google Scholar] [CrossRef]
  38. Turovskiy, Y.; Sutyak Noll, K.; Chikindas, M.L. The aetiology of bacterial vaginosis. J. Appl. Microbiol. 2011, 110, 1105–1128. [Google Scholar] [CrossRef]
  39. Petrova, M.I.; Lievens, E.; Malik, S.; Imholz, N.; Lebeer, S. Lactobacillus species as biomarkers and agents that can promote various aspects of vaginal health. Front. Physiol. 2015, 6, 81. [Google Scholar] [CrossRef]
  40. Seemann, T. Prokka: Rapid prokaryotic genome annotation. Bioinformatics 2014, 30, 2068–2069. [Google Scholar] [CrossRef]
  41. Maddison, W.P.; Donoghue, M.J.; Maddison, D.R. Outgroup Analysis and Parsimony. Syst. Biol. 1984, 33, 83–103. [Google Scholar] [CrossRef]
  42. Ågren, J.; Sundström, A.; Håfström, T.; Segerman, B. Gegenees: Fragmented Alignment of Multiple Genomes for Determining Phylogenomic Distances and Genetic Signatures Unique for Specified Target Groups. PLoS ONE 2012, 7, e39107. [Google Scholar] [CrossRef] [PubMed]
  43. Liu, Y.Y.; Chiou, C.S.; Chen, C.C. PGAdb-builder: A web service tool for creating pan-genome allele database for molecular fine typing. Sci. Rep. 2016, 6, 36213. [Google Scholar] [CrossRef]
  44. Rodrigues, T.C.V.; Jaiswal, A.K.; De Sarom, A.; Oliveira, L.D.C.; Oliveira, C.J.F.; Ghosh, P.; Tiwari, S.; Miranda, F.M.; de Jesus Benevides, L.; de Carvalho Azevedo, V.A.; et al. Reverse vaccinology and subtractive genomics reveal new therapeutic targets against Mycoplasma pneumoniae: A causative agent of pneumonia. R. Soc. Open Sci. 2019, 6, 1909070. [Google Scholar] [CrossRef]
  45. Soares, S.C.; Geyik, H.; Ramos, R.T.J.; de Sá, P.H.C.G.; Barbosa, E.G.V.; Baumbach, J.; Figueiredo, H.C.P.; Miyoshi, A.; Tauch, A.; Silva, A.; et al. GIPSy: Genomic island prediction software. J. Biotechnol. 2016, 232, 2–11. [Google Scholar] [CrossRef] [PubMed]
  46. Alikhan, N.F.; Petty, N.K.; Ben Zakour, N.L.; Beatson, S.A. BLAST Ring Image Generator (BRIG): Simple prokaryote genome comparisons. BMC Genom. 2011, 12, 402. [Google Scholar] [CrossRef]
  47. Darling, A.E.; Mau, B.; Perna, N.T. progressiveMauve: Multiple Genome Alignment with Gene Gain, Loss and Rearrangement. PLoS ONE 2010, 5, e11147. [Google Scholar] [CrossRef]
  48. Emms, D.M.; Kelly, S. OrthoFinder: Solving fundamental biases in whole genome comparisons dramatically improves orthogroup inference accuracy. Genome Biol. 2015, 16, 157. [Google Scholar] [CrossRef]
  49. Enright, A.J.; Van Dongen, S.; Ouzounis, C.A. An efficient algorithm for large-scale detection of protein families. Nucleic Acids Res. 2002, 30, 1575–1584. [Google Scholar] [CrossRef]
  50. Medini, D.; Donati, C.; Tettelin, H.; Masignani, V.; Rappuoli, R. The microbial pan-genome. Curr. Opin. Genet. Dev. 2005, 15, 589–594. [Google Scholar] [CrossRef]
  51. Boto, L. Horizontal gene transfer in evolution: Facts and challenges. Proc. R. Soc. B Biol. Sci. 2010, 277, 819. [Google Scholar] [CrossRef] [PubMed]
  52. Soares, S.C.; Silva, A.; Trost, E.; Blom, J.; Ramos, R.; Carneiro, A.; Ali, A.; Santos, A.R.; Pinto, A.C.; Diniz, C.; et al. The Pan-Genome of the Animal Pathogen Corynebacterium pseudotuberculosis Reveals Differences in Genome Plasticity between the Biovar ovis and equi Strains. PLoS ONE 2013, 8, e53818. [Google Scholar] [CrossRef] [PubMed]
  53. Carlos Guimaraes, L.; Benevides de Jesus, L.; Vinicius Canario Viana, M.; Silva, A.; Thiago Juca Ramos, R.; de Castro Soares, S.; Azevedo, V. Inside the Pan-genome—Methods and Software Overview. Curr. Genom. 2015, 16, 245. [Google Scholar] [CrossRef]
  54. Cantalapiedra, C.P.; Hernández-Plaza, A.; Letunic, I.; Bork, P.; Huerta-Cepas, J. eggNOG-mapper v2: Functional Annotation, Orthology Assignments, and Domain Prediction at the Metagenomic Scale. Mol. Biol. Evol. 2021, 38, 5825–5829. [Google Scholar] [CrossRef]
  55. Gene Ontology Consortium. Gene Ontology Consortium: Going forward. Nucleic Acids Res. 2015, 43, D1049–D1056. [Google Scholar] [CrossRef] [PubMed]
  56. Kanehisa, M.; Furumichi, M.; Tanabe, M.; Sato, Y.; Morishima, K. KEGG: New perspectives on genomes, pathways, diseases and drugs. Nucleic Acids Res. 2017, 45, D353–D361. [Google Scholar] [CrossRef] [PubMed]
  57. Galperin, M.Y.; Makarova, K.S.; Wolf, Y.I.; Koonin, E.V. Expanded microbial genome coverage and improved protein family annotation in the COG database. Nucleic Acids Res. 2015, 43, D261–D269. [Google Scholar] [CrossRef]
  58. Tatusov, R.L.; Koonin, E.V.; Lipman, D.J. A genomic perspective on protein families. Science 1997, 278, 631–637. [Google Scholar] [CrossRef]
  59. Tarracchini, C.; Lugli, G.A.; Mancabelli, L.; Milani, C.; Turroni, F.; Ventura, M. Assessing the Genomic Variability of Gardnerella vaginalis through Comparative Genomic Analyses: Evolutionary and Ecological Implications. Appl. Environ. Microbiol. 2020, 87, 1–16. [Google Scholar] [CrossRef]
  60. Bohr, L.L.; Mortimer, T.D.; Pepperell, C.S. Lateral Gene Transfer Shapes Diversity of Gardnerella spp. Front. Cell Infect. Microbiol. 2020, 10, 293. [Google Scholar] [CrossRef]
  61. Jiao, L.; Liu, Y.; Yu, X.Y.; Pan, X.; Zhang, Y.; Tu, J.; Song, Y.-H. Ribosome biogenesis in disease: New players and therapeutic targets. Signal Transduct. Target. Ther. 2023, 8, 15. [Google Scholar] [CrossRef] [PubMed]
  62. Epum, E.A.; Haber, J.E. DNA replication: The recombination connection. Trends Cell Biol. 2022, 32, 45–57. [Google Scholar] [CrossRef] [PubMed]
  63. Xu, Y.; Xu, D. Repair pathway choice for double-strand breaks. Essays Biochem. 2020, 64, 765–777. [Google Scholar] [CrossRef] [PubMed]
Figure 1. Heatmap with 7 complete genomes of G. vaginalis and 9 representative genomes of clades, according to the tree available at the NCBI. In green, a high similarity can be observed ranging from 65% to 100%; in orange, a median similarity ranging from 38% to 46%; and finally, a low similarity in red, ranging from 1% to 22%.
Venereology 02 00012 g001
Figure 2. The phylogenetic tree shows the bootstrap percentage with 1000 bootstraps on the tree branches, ranging from 28 as the lowest percentage to 100 as the highest one. The same clusters found on the heatmap may be visualized here.
Venereology 02 00012 g002
Figure 3. Genomic plasticity prediction with pathogenicity islands (PAI), resistance islands (RI), and metabolic islands (MI) of G. vaginalis. Each ring represents one strain of the working group, ranging from complete genomes in inner rings to draft genomes in the outermost rings. At the outermost, three rings represent the genomics islands—in red, the pathogenicity islands; in black, the resistance islands; and in purple, the metabolic islands.
Venereology 02 00012 g003
Figure 4. Gene synteny analysis. All genomes were broken and presented in continuous blocks. Each color represents one region that has passed through evolution for inversions, translocations, or deletions.
Venereology 02 00012 g004
Figure 5. The pangenome development. In blue, the pangenome growth curve with Heap’s law correction stabilizes approximately in just over 3000 genes, characterizing an open pangenome. The core genome stabilization curve is in orange, finalizing in approximately 208 genes.
Venereology 02 00012 g005
Figure 6. A singletons diagram. On side (A), a diagram represents the “singletons” curve generated using the least-squares fits law, with the tangent theta equal to 0.147, i.e., for each newly sequence genome, approximately one gene is added to the pangenome. On side (B), a Venn diagram showing singletons present in each strain. The number of singletons ranged from 0 to 46 genes in the strains.
Venereology 02 00012 g006
Figure 7. COG functional classification of core genome. Bar graph representing the COG classifications of the core genome. Each bar is related to one classification, COG J, with more genes classified, followed by COG F classification. Note: the column that displays “-” is related to the empty cells in the program’s result, that is, genes that were unable to be classified by the program.
Venereology 02 00012 g007
Figure 8. COG functional classification of shared and singleton’s genes. Bar graph representing the COG classifications of shared plus singletons group. Each bar is related to one classification, COG S, with more genes classified, followed by COG L classification. Note: the column that displays “-” is related to the empty cells in the program’s result, that is, genes that were unable to be classified by the program.
Venereology 02 00012 g008
Table 1. Information about the 16 genomes of G. vaginalis strains.
OrganismStrainAssembly Level Size (Mb) GC% Genbank AccessExtraction Location
Gardnerella vaginalisNCTC10287Complete 1.67 41.4 GCA_900637625.1-
Gardnerella vaginalisGV37 Complete 1.75 41.8 GCA_001953155.1Paris, France
Gardnerella vaginalisFDAARGOS_568 Complete 1.72 41.3 GCA_003812765.1-
Gardnerella vaginalis409-05 Complete 1.62 42 GCA_000025205.1-
Gardnerella vaginalisATCC 14018/
JCM 11026
Complete 1.67 41.4 GCA_001042655.1-
Gardnerella vaginalisATCC 14019 Complete 1.67 41.4 GCA_000159155.2-
Gardnerella vaginalisHMP9231 Complete 1.73 41.4 GCA_000213955.1-
Gardnerella vaginalisDSM 4944 Chromosome1.68 41.3 GCA_900105405.1-
Gardnerella vaginalisUMB0913Scaffold1.51 42.1 GCA_002861145.1Maywood, United States of America
Gardnerella vaginalisUMB0736Scaffold1.73 41.1 GCA_013315025.1Maywood, United States of America
Gardnerella vaginalisUMB0298Scaffold1.68 41.2 GCA_002861975.1Maywood, United States of America
Gardnerella vaginalisJCP7672 Scaffold1.69 41.2 GCA_000414645.1-
Gardnerella vaginalisJCP8108 Scaffold1.67 41.1 GCA_000414525.1-
Gardnerella vaginalisUMB0833 Scaffold1.62 42.1 GCA_002861885.1Maywood, United States of America
Gardnerella vaginalisJCP7659 Scaffold1.54 41.9 GCA_000414665.1-
Gardnerella vaginalisJCP8070 Scaffold1.48 42.2 GCA_000414545.1-
Disclaimer/Publisher’s Note: The statements, opinions and data contained in all publications are solely those of the individual author(s) and contributor(s) and not of MDPI and/or the editor(s). MDPI and/or the editor(s) disclaim responsibility for any injury to people or property resulting from any ideas, methods, instructions or products referred to in the content.

