
Green Hydrogen Production at the Gigawatt Scale in Portugal: A Technical and Economic Evaluation


1
Escola Superior de Tecnologia do Barreiro, Instituto Politécnico de Setúbal, Rua Américo da Silva Marinho, s/n, 2839-001 Lavradio, Portugal
2
RESILIENCE—Center for Regional Resilience and Sustainability, Escola Superior de Tecnologia do Barreiro, Instituto Politécnico de Setúbal, Rua Américo da Silva Marinho, s/n, 2839-001 Lavradio, Portugal
3
ISEC Lisboa–Escola de Gestão, Engenharia e Aeronáutica, Alameda das Linhas de Torres, 179, 1750-142 Lisboa, Portugal
*
Authors to whom correspondence should be addressed.
Energies 2024, 17(7), 1638; https://doi.org/10.3390/en17071638
Submission received: 15 February 2024
/
Revised: 21 March 2024
/
Accepted: 25 March 2024
/
Published: 29 March 2024
(This article belongs to the Special Issue Hydrogen in the Energy Transition: From Production to End-Use)
Abstract
:The European Union has committed to achieving carbon neutrality by 2050 and green hydrogen has been chosen as a priority vector for reaching that goal. Accordingly, Portugal has drafted a National Hydrogen Strategy laying out the various steps for the development of a green hydrogen economy. One element of this strategy is the development of a gigawatt-scale hydrogen production facility powered by dedicated renewable electricity sources. This work presents an analysis of the technical and economic feasibility of a facility consisting of a gigawatt-scale polymer electrolyte membrane electrolyser powered by solar photovoltaic and wind electricity, using the energy analysis model EnergyPLAN. Different capacities and modes of operation of the electrolyser are considered, including the complementary use of grid electricity as well as different combinations of renewable power, resulting in a total of 72 different configurations. An economic analysis is conducted addressing the related annualised capital expenditures, maintenance, and variable costs, to allow for the determination of the levelised cost of hydrogen for the different configurations. This analysis shows the conditions required for maximising annual hydrogen production at the lowest levelised cost of hydrogen. The best options consist of an electrolyser powered by a combination of solar photovoltaic and wind, with limited exchanges with the electricity grid, and a levelised cost of hydrogen in the range 3.13–3.48 EUR/kg.
1. Introduction
Reducing anthropogenic greenhouse gas (GHG) emissions is the focus of international climate agreements and has been integrated with the national public policy of many countries. In 2015, the Paris Agreement established a target of containing global temperature increases within 1.5 °C above the pre-industrial average to avoid the most severe impacts of climate change. In the follow-up to the Paris Agreement, many countries have made pledges to achieve carbon neutrality towards the middle of the twenty-first century. Green hydrogen is expected to play a relevant role in this process. Green hydrogen, i.e., hydrogen that is totally obtained from renewable energy sources (RES), can be used directly as combustion fuel, for energy storage, and to produce electricity in fuel cells. Green hydrogen may also be used in chemical synthesis to produce other products for both energy and non-energy applications, for example, as a precursor of synthetic fuels, through processes such as the Fischer–Tropsch reaction, and to produce ammonia, bioethanol, or biomethane, therefore contributing to the decarbonisation of industrial sectors more widely.
Hydrogen is already an important component of the global energy mix, representing an amount of energy equal to 2.5% of the world’s total energy consumption, but it is still mainly sourced from fossil precursors. The global hydrogen production in 2021 was 94 Mton, of which 62% comes from the reforming of natural gas, 19% from coal, and 19% is a by-product of naphta reforming at refineries. Only 0.7% is low-carbon hydrogen, which is mainly obtained from fossil fuels coupled with carbon-capture mechanisms, and a smaller part is obtained from water electrolysis [1]. Production via natural gas reformation (also called grey hydrogen) is, at present, the technology with the lowest levelised cost of hydrogen, in the range 0.60–2.67 EUR/kg [2,3,4].
Hydrogen production from RES is based on biomass conversion and water electrolysis. Biomass is a renewable organic feedstock that includes agriculture and forest residues [5], landfill waste [6], and animal waste [7], and can be converted into hydrogen gas by thermo-chemical [8] and biological processes [9]. Water electrolysis is an electrochemical reaction based on the use of a direct electric current between two electrodes that are immersed in an electrolyte to split the water molecule into molecular hydrogen and oxygen. If the electric current necessary for the process is produced from RES, such as biomass, wind, or solar photovoltaic (PV), then the resulting product is classified as renewable or green hydrogen. Two technologies for electrolysis are available commercially: alkaline electrolysis, and polymer electrolyte membrane (PEM) electrolysis, which differ in efficiency, operational conditions, and the material used as the electrolyte [10,11]. Alkaline electrolysis is the most mature and established technology. The electrolyte normally consists of a solution of water and from 25% to 30% KOH, although NaCl and NaOH are also used. It is necessary to use a diaphragm to separate the electrodes, keeping the product gases apart, and ensuring efficiency and safety. Although alkaline electrolysis is the more mature technology, three major limiting issues remain: operating with low pressure, the limited current density due to the losses in the diaphragm, and the cross-diffusion of the product gases [12]. In PEM electrolysis, a solid polysulfonated membrane is used as an electrolyte, allowing protons to travel from the anode to the cathode. This membrane has a high proton mobility and a lower thickness, allowing the use of high current densities. PEM electrolysers are generally more efficient than alkaline electrolysers, operate at lower temperatures (20–80 °C), and produce ultrapure hydrogen at high pressures [13]. Nevertheless, this technology has some drawbacks, such as the cost of the catalyst and the lifetime of the membrane.
Water electrolysis has become a technically and economically mature technology and its application in energy systems has been the subject of numerous studies. Terlouw et al. [14] have quantified current and future hydrogen production costs, as well as the life cycle environmental burdens of large-scale hydrogen production via water electrolysis located on a selection of European islands. The authors analysed autonomous systems powered exclusively by wind and/or solar photovoltaics (PV) power, grid-connected systems, and hybrid systems, showing that the amount of electricity consumed, its source and price, the firm supply of solar PV and wind electricity, and investments for system components are the most crucial factors for the overall costs. The authors find that hydrogen production costs of 3.7 EUR/kg are presently within reach for hybrid systems at favourable locations and can be reduced to 2 EUR/kg by 2040. Khouya [15] calculated the levelised costs of hydrogen (LCOH) for the case of an alkaline electrolysis plant powered by wind farms and concentrated photovoltaic thermal (CPV/T) systems, based on meteorological data from the Tangiers region in Morocco. The author estimated values of LCOH in the range 2.25–4 USD/kg for an electrolyser powered by wind farms, and 3–6 USD/kg for an electrolyser powered by CPV/T. The performance of hybrid systems combining both renewable sources of electricity is tested but it always results in higher LCOH values than in single renewable source systems. Dinh et al. [16] developed a geospatial model for assessing the economic viability of hydrogen production from offshore wind power in Irish waters, using the physical characteristics of the offshore project (distance to port, water depth, distance to gas grid injection point). Considering off-shore wind farms with a capacity of 510 MW, the authors created maps of LCOH, obtaining values for near-shore locations outside bay areas that are below 4 EUR/kg in 2030.
Vartiainen et al. [17] applied a learning curve method to key technologies, such as solar PV and water electrolysers, to estimate the cost of hydrogen production based on solar PV. The authors found LCOH values of 0.7–1.8 EUR/kg by 2030 and 0.3–0.9 EUR/kg by 2050, depending on the location. In another study, Nguyen et al. [18] considered an electrolyser powered by the excess electricity from peak production periods of renewables such as wind and solar PV, resulting in hydrogen production costs in the range of 2.66–3.54 USD/kg. Hydrogen production from water electrolysis could provide additional benefits to energy systems by providing frequency containment regulation [17] and flexibility services [19]. A study on the viability of a hydrogen economy in Portugal [20] identified the opportunities, challenges, and relevance provided by different hydrogen value chains, with a particular focus on the case of Power to Gas (P2G). Assuming an LCOH in the range 3.3–6.4 EUR/kg in 2030, the authors found that, provided that renewable electricity is used to feed electrolysis, P2G is a promising storage technology with the potential to reduce GHG emissions when compared to conventional gas production technologies such as natural gas reforming.
Within the framework of the Paris Agreement, the European Union (EU) set up the Energy Union [21], establishing several targets for the reduction in GHG emissions. These targets are to be pursued in the period 2021–2030, through the implementation of the National Energy and Climate Plans (NECP) [22] by each EU Member State. With the publication of A Hydrogen Strategy for a Climate-neutral Europe, green hydrogen has become a centrepiece in the energy and climate policies of the European Union because of its increasingly competitive costs and potential for substituting fossil fuels [23]. The present energy crisis made it necessary to further expand the production and utilisation of hydrogen. For this purpose, the REPowerEU action plan was adopted in order to accelerate the uptake of renewable hydrogen in hard-to-decarbonise sectors and in energy-intensive industries, scaling up the development of a hydrogen infrastructure and reducing the dependence on imported natural gas [24]. Renewable hydrogen should be progressively deployed in the EU, with all associated technologies reaching maturity and being deployed at a large scale to encompass all hard-to decarbonise sectors by 2050. In this context, the Portuguese NECP was soon followed by the National Hydrogen Strategy (EN-H2) [25], drafted as a complement to the NECP, which introduced the hydrogen vector to provide a larger variety of technological pathways to achieve the decarbonisation targets.
One of the projects proposed in the EN-H2 is the installation of a large-scale unit for hydrogen production via water electrolysis, with 1 GW of hydrogen production capacity, powered by dedicated RES. These RES must be dimensioned so that the maximum hydrogen production is obtained at the lowest possible cost. The EN-H2 considers that hybrid solutions combining both wind and solar PV, although not the lowest-cost option for producing electricity, may minimise the cost of the production of hydrogen because they provide longer operating times for the electrolyser. It is expected that, depending on the output of the dedicated RES, annual hydrogen production will be in the range 35–175 kton. This hydrogen production unit should be located at the industrial hub and deep-water port of Sines, on the southwest coast of mainland Portugal, where it will be gradually assembled until it reaches full operation in 2030.
In this work, a simulation of renewable hydrogen production is carried out using the EnergyPLAN software (version 16.2) [26]. EnergyPLAN simulates the operation of energy systems of variable scales in terms of size and complexity, although with no spatial resolution, by building hourly balances between energy demand and supply for a combination of electricity, fuels, and heat sectors. The concerns regarding climate change have made EnergyPLAN an important tool for analyses of the penetration of renewables into energy systems. EnergyPLAN has been widely used to study new and innovative solutions in European Union and European countries, reflecting the growing awareness of the need to design policies to enable and accelerate the energy transition [27]. Energy system analyses are complex when considering 100% renewable energy integration and EnergyPLAN has been applied to address this problem in single countries regarding the production of electricity [28] and the integration of 100% renewable electricity production in the electricity grid and transport sectors [29], or for the whole of the energy system, i.e., electricity, heat, and transport [30,31]. It has also been used to analyse the technical configuration and estimate the cost of a transition to a fully renewable energy system in the European Union [32]. EnergyPLAN was recently used in a number of studies on the Portuguese energy system, in the following ways: to analyse the technical and economic feasibility of the substitution of solar PV generation for coal-fired power plants [33]; to forecast the utilisation of storage capacity in the context of an increase in the penetration of renewables [34]; to evaluate the extent to which electric cars can contribute to stabilising the electricity grid and obviating the need for gas power plants [35]; and to evaluate decarbonisation options for the power sector [36]. This article presents a study of the technical and economic aspects related to the operation of a unit with the characteristics described in the EN-H2. Different configurations of the electrolyser and the renewable electricity capacity are analysed to determine the conditions for maximum production at the lowest LCOH.
The research that led to the results presented in this work is expected to assist decision-making processes regarding hydrogen projects by promoters, local, and national government bodies. This is because it provides the first estimates of the technical and economic characteristics of a large-scale hydrogen production unit based on renewable sources. These estimates include the ratio between renewable capacity and electrolyser capacity, which is valuable when assessing the land areas required to power a GW-scale electrolyser and thus improve territorial planning actions. Additionally, it provides estimates of the potential energy exchanges between the hydrogen production unit and the national electricity grid, which are crucial for planning energy production and transport infrastructure.
2. Methods
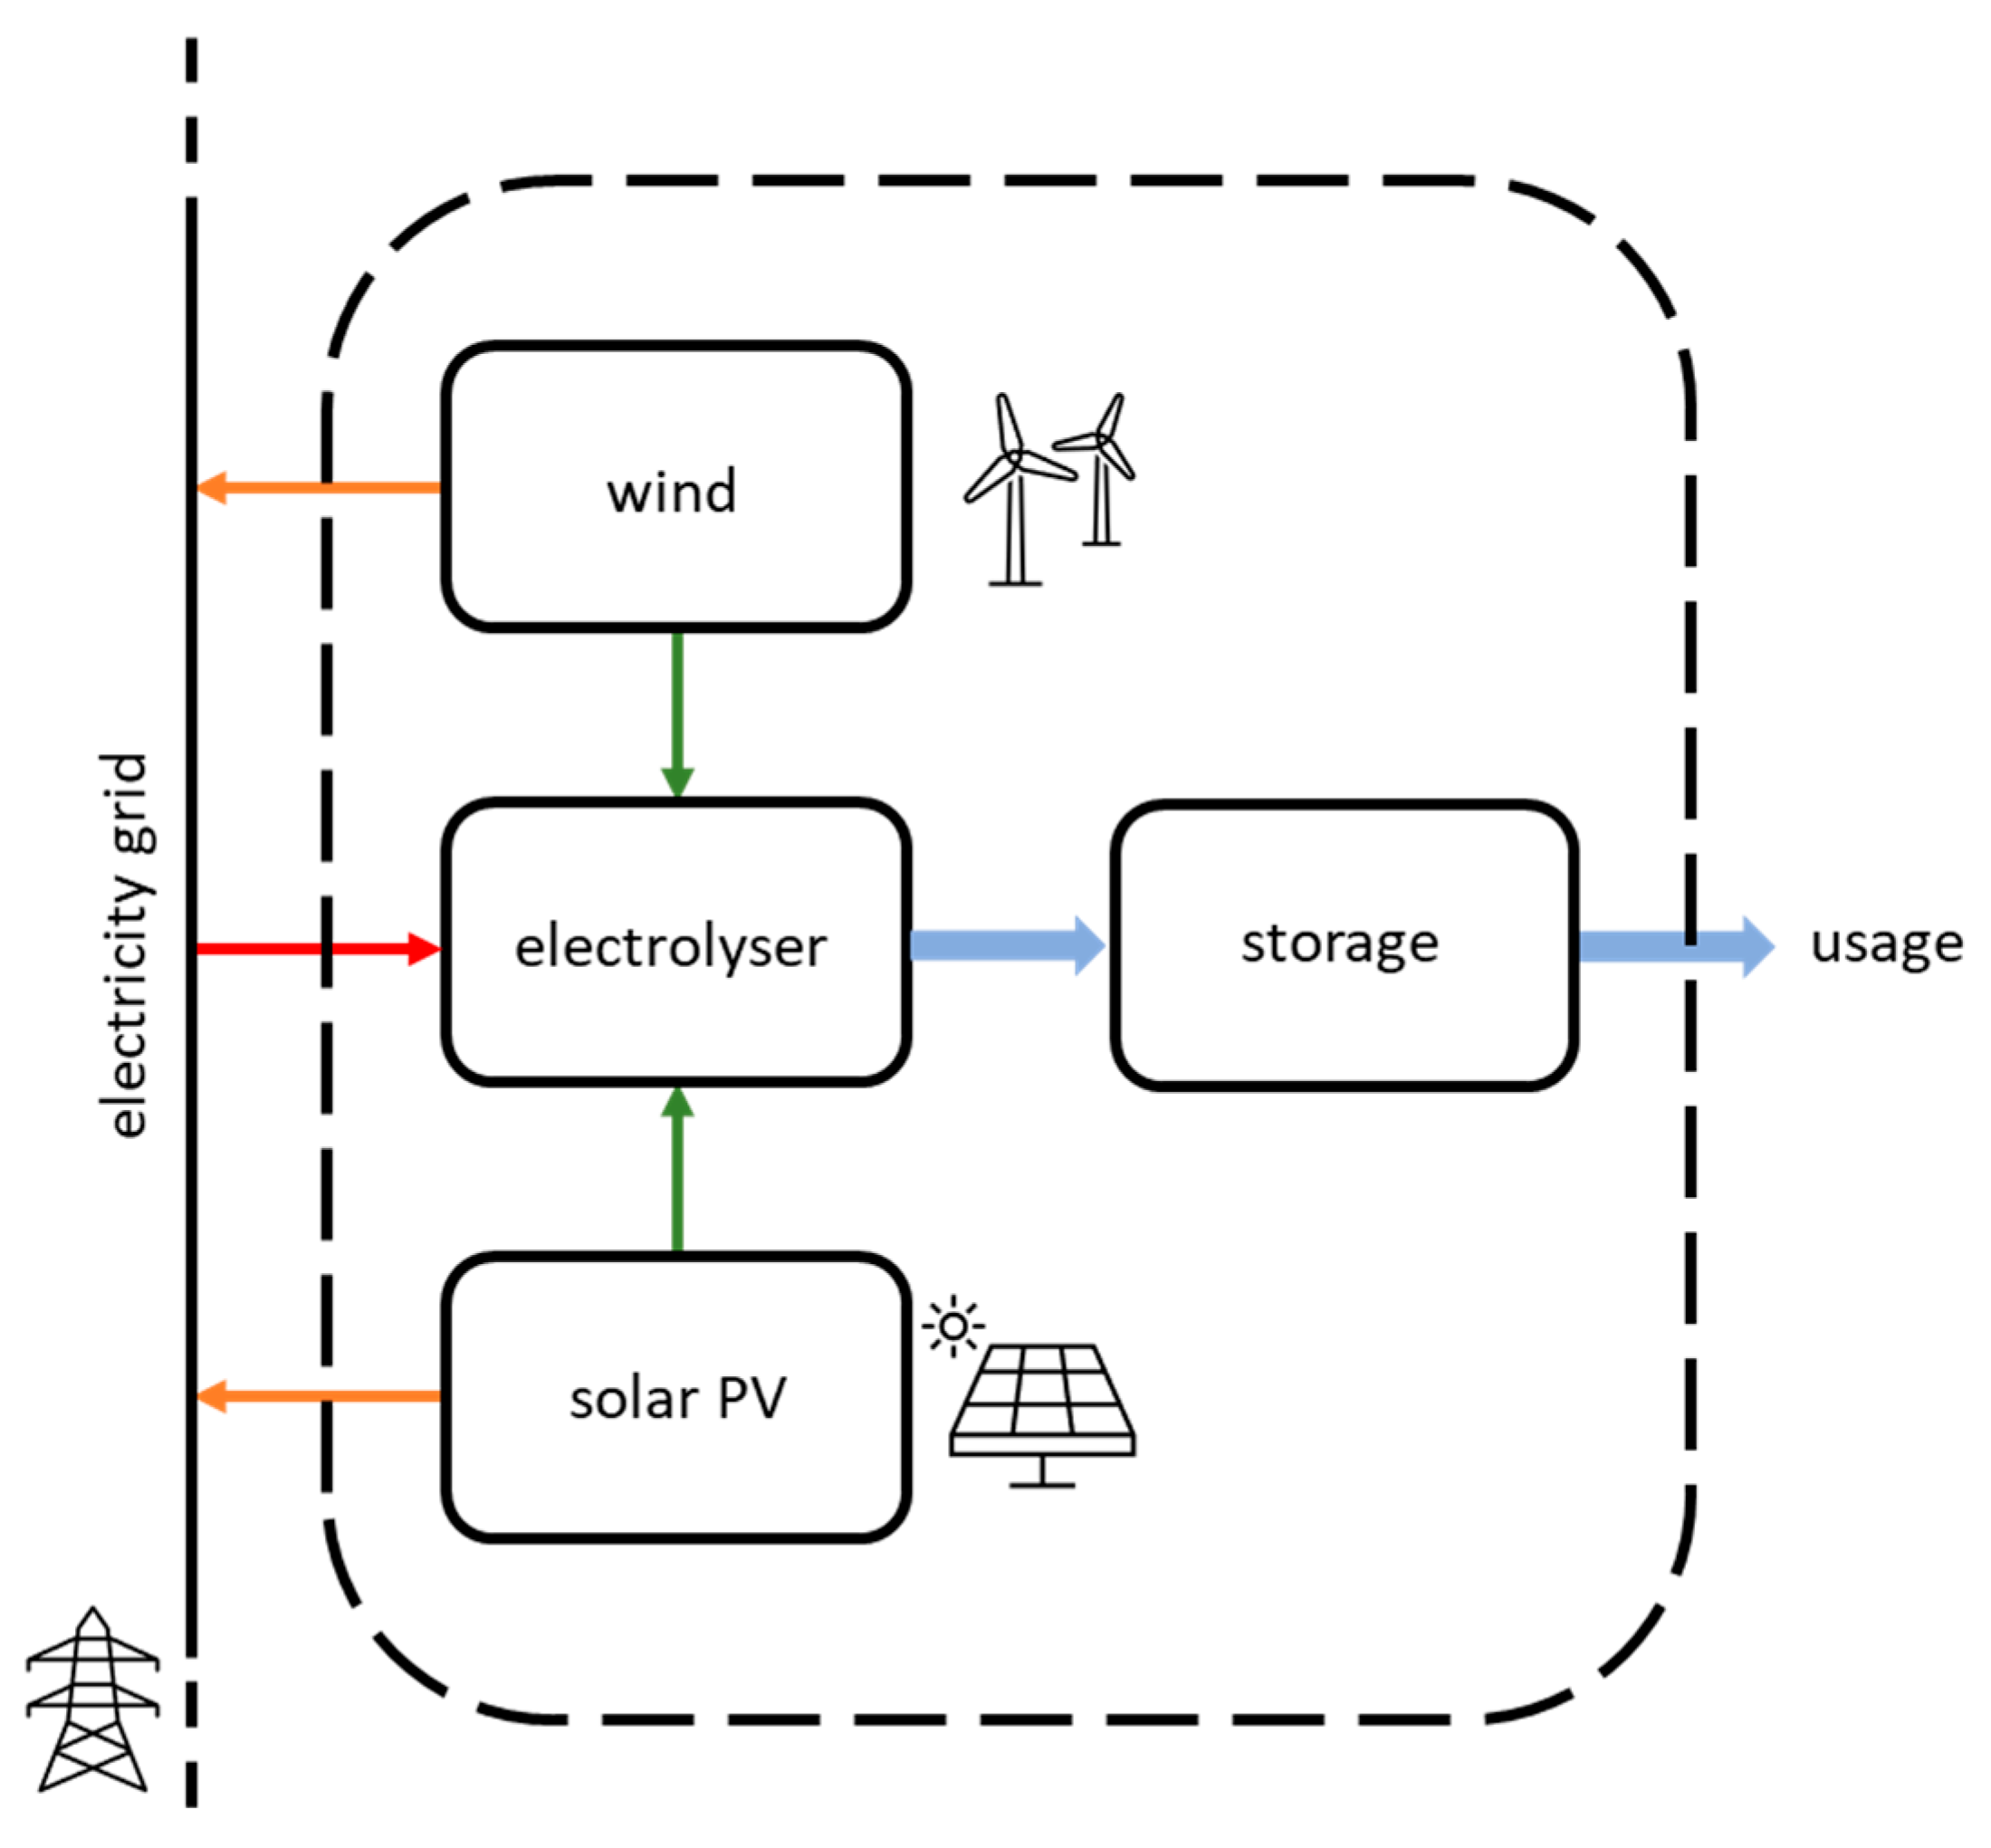
The following analysis refers to the operation of a GW-scale hydrogen production unit in the year 2030. The hydrogen production unit consists of an electrolyser using renewable power sources and a hydrogen storage system, as presented in the diagram shown in Figure 1. The electrolyser capacity is considered as the electric input capacity.
2.1. Operation Modes of the Electrolyser
In EnergyPLAN, it is possible to define an electrolyser operation profile through the total annual demand values and hourly consumption profiles of hydrogen in end-use sectors. Thus, the hydrogen production profile of hourly slots is given by the following equation:
where is the energy content of the hydrogen produced during hour t, is the electrolyser conversion efficiency, is the width of the time slot (1 h), and is the electric input power of the electrolyser at hour t, given by the following:
where represents the output power from the associated RES at hour t, and is the power supplied by the electricity grid during hour t. The total annual hydrogen production (it should be noted that, in EnergyPLAN, all years have 8784 h) is given by the following:
Three different modes of operation of the electrolyser are described in the following sections.
2.1.1. Constant Load Operation
In this mode, the electrolyser works under a constant load of 50% or 80% of the nominal capacity (PN), so that the following holds:
or
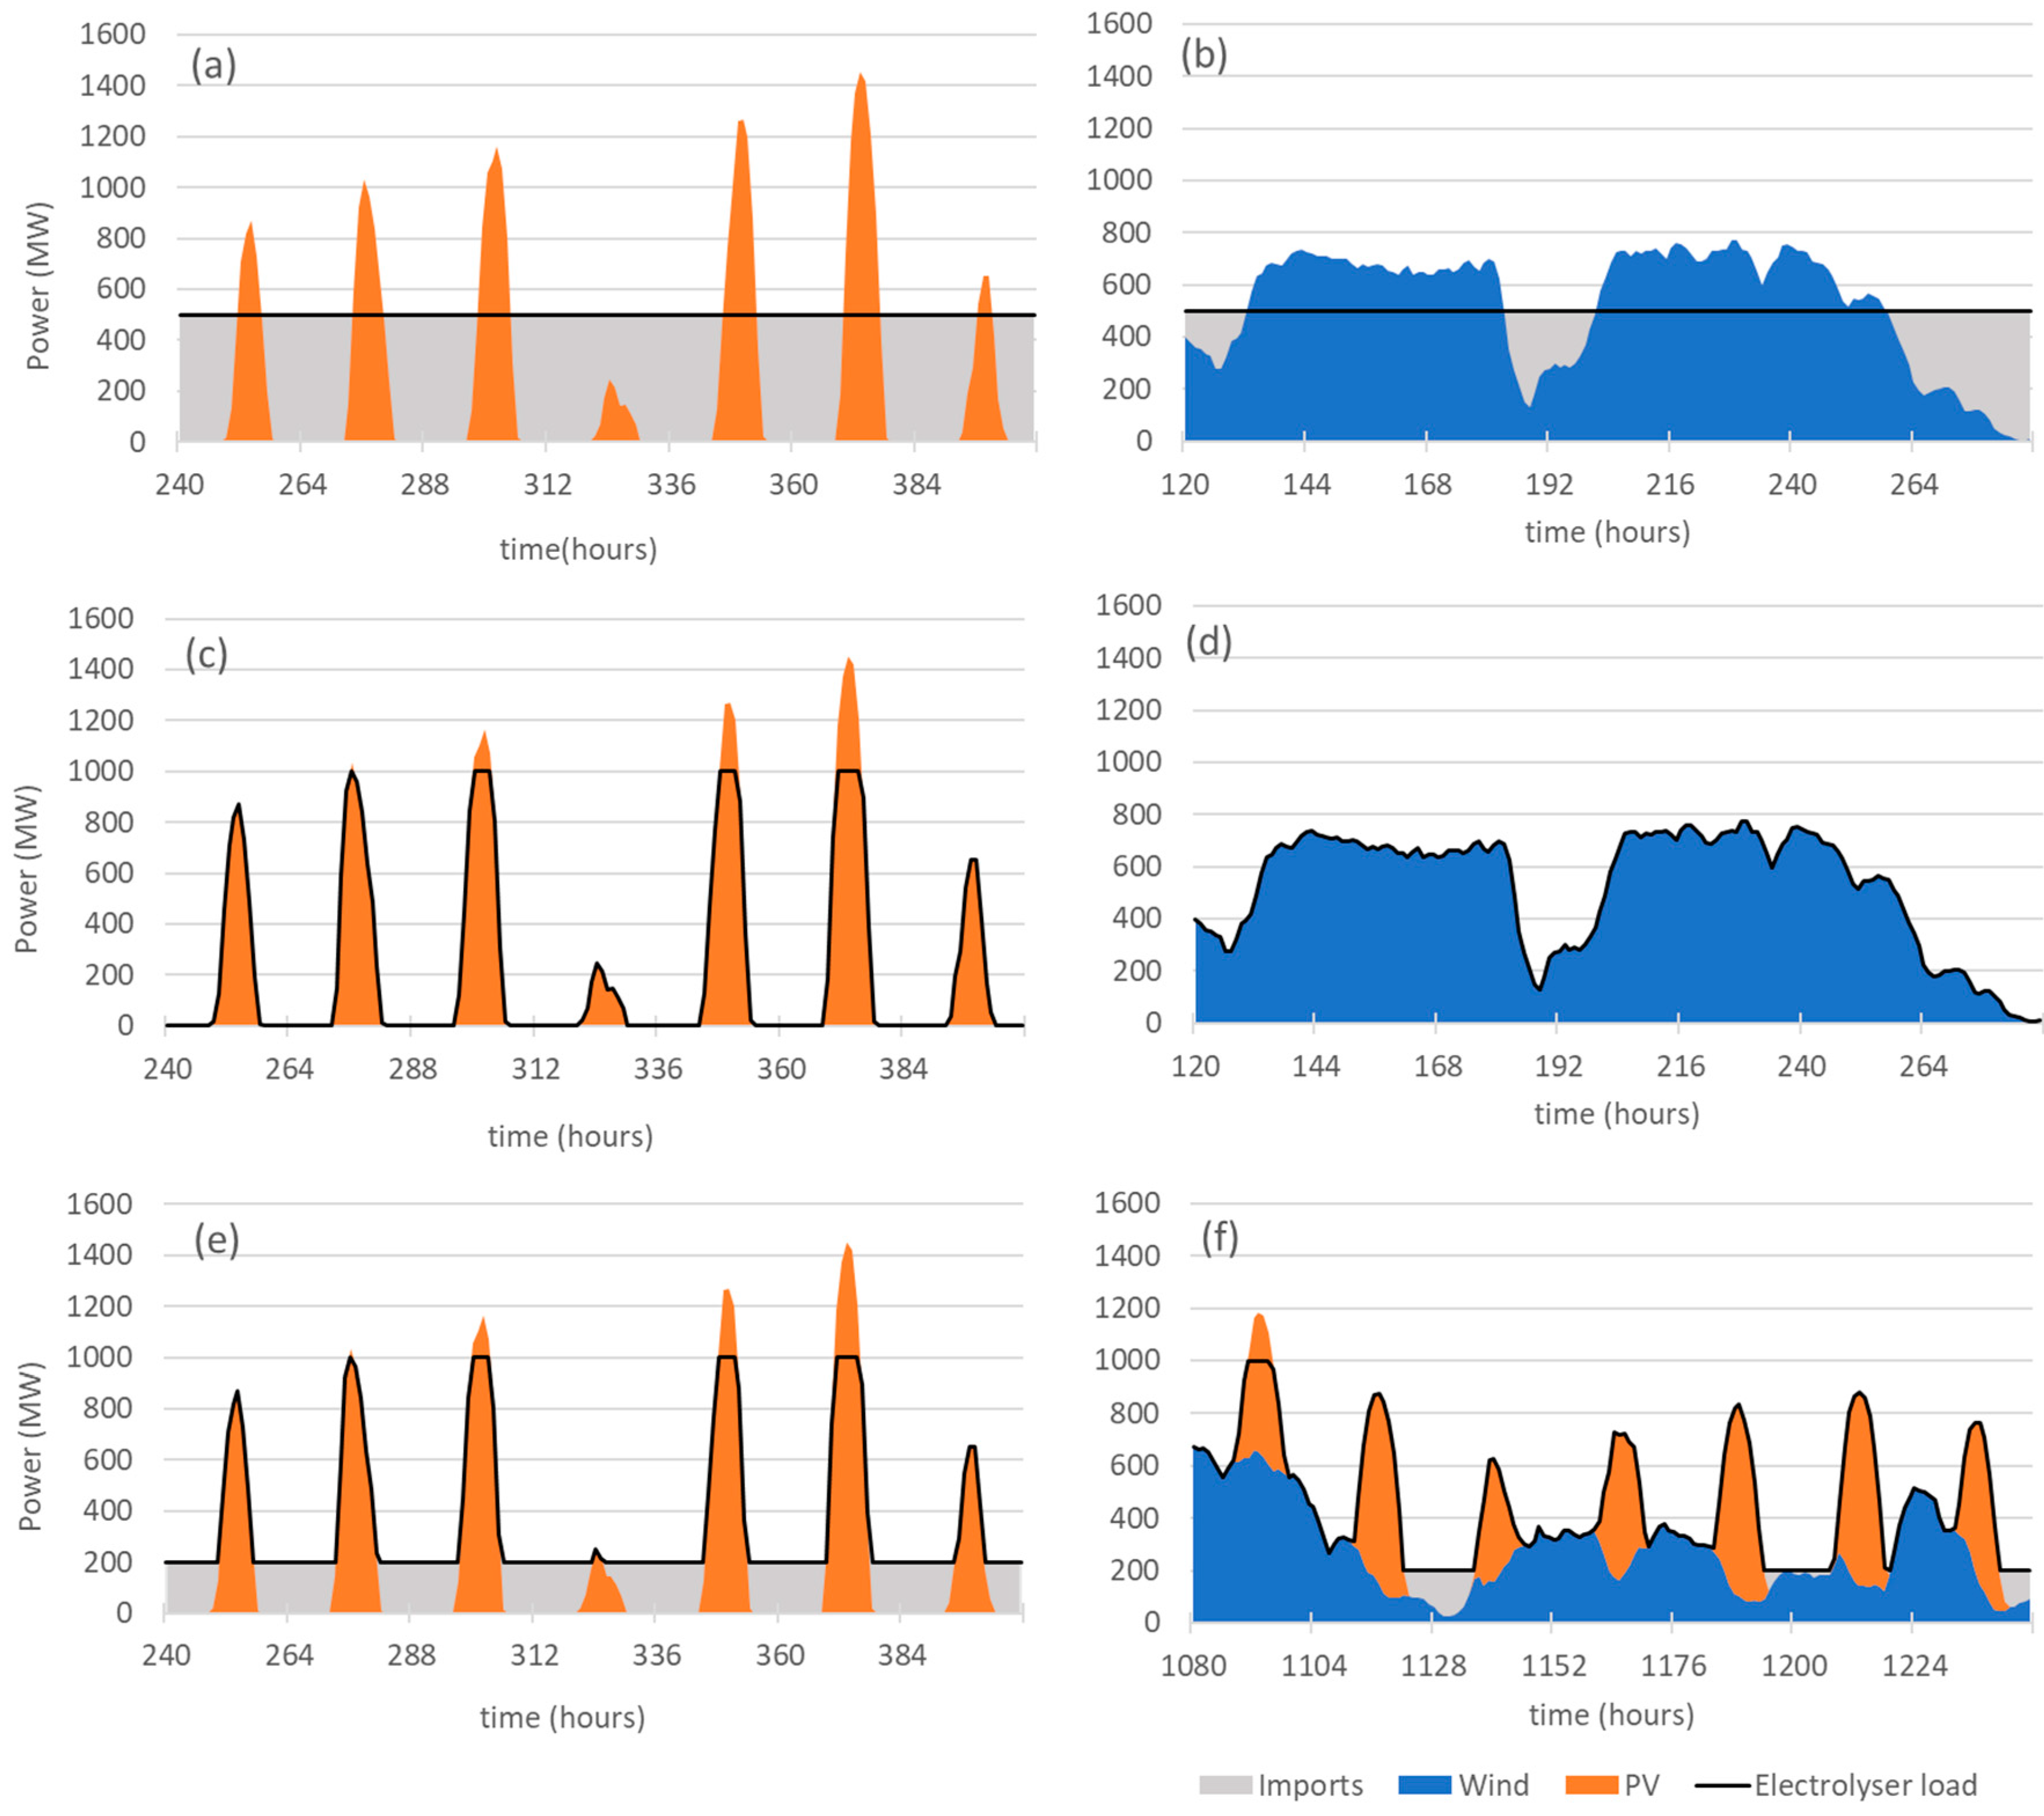
The electrolyser is powered by dedicated solar PV power and/or wind power that are directly connected to the electrolyser. Extra power from the grid will be used to supply the needs of the electrolyser during the periods when the dedicated RES output falls short of the needs of the electrolyser. This extra power will be referred to as “imports” from the grid in the text below. When the output of the dedicated RES exceeds the PN of the electrolyser, the excess electricity production is injected into the grid and will be referred to as “exports” to the grid. Figure 2a,b, show the load diagram for the electrolyser operating at 50% of PN powered respectively by 2 GW of solar PV and 1 GW of wind. The grey areas in the graphs represent electricity imports from the grid.
2.1.2. Autonomous Operation
In the autonomous mode, the electrolyser operation depends only on the supply of the dedicated RES. This is the configuration that provides a closer match to the proposal of the EN-H2. The electrolyser’s operating power varies significantly as it always matches the RES output power. In this mode of operation, the grid acts only as a buffer to absorb the excess electricity production, i.e., when the RES output power exceeds PN.
For autonomous operation (), the electrolyser load curve is defined as follows:
2.1.3. Grid-assisted Operation
For grid-assisted operation, grid electricity is imported to maintain a minimum operation load of 20% of PN. If RES power exceeds the electrolyser nominal power, the excess electricity production is exported to the grid.
The operating input power of the electrolyser is therefore given by:
Figure 2e shows the load curve of a 1 GW electrolyser powered by 2 GW of solar PV and Figure 2f shows the load curve of a 1 GW electrolyser powered by 1 GW of solar PV and 1 GW of wind in the grid-assisted operation. The grey area in the graphs represents the electricity imports from the grid that are necessary to satisfy the condition of 20% minimum capacity of the electrolyser.
The operating power profile is a key problem when selecting the right electrolyser technology. While alkaline electrolysers can regularly be switched on and off, they have a slow response time (ca. 1 h to restart). PEM electrolysers, on the other hand, have fast response times (fluctuations in capacity of seconds and less than 15 min to cold start) and are best adapted to variable power capacity systems. Nevertheless, to avoid efficiency and lifetime degradations, electrolysers are best operated in a continuous mode, avoiding full shutdowns, and with input power kept above a fraction of the installed capacity depending on the technology. The intermittency of renewable power, rather than its variability, is the most relevant problem for electrolyser systems regarding operation and degradation [37]. Stansberry et al. [38] have shown that continuous operation of a PEM electrolyser can be sustained with input power of as low as 7.6% of the electrolyser capacity. These technical problems are not addressed in the present study. To perform the numerical simulation in EnergyPLAN, the choice of electrolyser technology is only relevant from the point of view of the conversion efficiency. The analysis that follows considers the operation of a PEM electrolyser, with a conversion efficiency of 84% [39], because this technology is the best adapted to an operation based on direct power by RES.
For the three modes of operation, it is considered that all hydrogen is compressed to a storage system before final use. A compressor is used to compress hydrogen with an electricity requirement of 0.5 kWh per kg of hydrogen [40]. The efficiency of the storage cycle is 88% [39] and the total storage capacity is 45 GWh (1.3 kton of hydrogen), corresponding to five days of the average daily production of all configurations.
2.2. Renewable Electricity Production
The electrolyser is powered by wind and solar PV farms. The total annual energy output of each technology can undergo significant variations depending on the prevailing weather conditions during the year, depending on whether the years are predominantly sunny or windy. Yearly national statistics for installed capacity, total production, and equivalent full-load hours (EFLH) [41] were used to define the EFLH characteristics of sunny and windy years for each renewable technology. The analysis was based on statistics for the period 2012–2021. For defining the EFLH characteristics of a sunny year, the three years in this period with the largest EFLH for solar PV were selected (2012, 2015, and 2017). The characteristic EFLH of a sunny year, for both solar PV and wind, is the average of the EFLH of each technology in the three selected years. For defining the characteristic production of a windy year, the three years with the largest EFLH for wind (2013, 2014, and 2016) were selected and the same procedure was carried out. The results presented in Table 1 show that solar PV has a larger EFLH in a sunny year, while wind has a larger EFLH in a windy year. These values of EFLH were applied to the RES of each configuration in order to calculate the total annual electricity production.
In addition to annual electricity production, it is necessary to simulate the hourly production profile for each renewable technology. For a sunny year, the shape of the production profiles in the year 2015 were used for both technologies, as 2015 was the year with the highest solar PV production (1771 EFLH). For a windy year, the shape of the production profiles in the year 2013, the year with the highest wind production (2549 EFLH), were used. The production profiles were obtained from the national data published by the transmission system operator [42]. In the analysis below, an average of a sunny and windy year is considered for the estimation of the costs and the hydrogen production of the unit. In the Section 4, a sensitivity analysis of the dependence of production on weather conditions is presented.
The values of the electrolyser’s nominal capacity and RES technology and capacity are shown in Table 2. Electrolyser capacity is considered as electric input capacity. It is considered that PN can take values of 0.5, 1.0, and 1.5 GW. For each value of PN, RES technologies (solar PV and wind) are deployed in units of 1 GW. The total RES power feeding the electrolyser can take values between 1 and 3 GW, resulting from the application of a single technology or combinations of both. The combination of electrolyser capacity and RES power results in 72 different configurations (18 in the constant load mode and 27 each for the autonomous and grid-assisted modes); each one was analysed from the perspective of LCOH, total annual hydrogen production, costs, structure, electricity exchanges with the power grid, levelised cost of electricity (LCOE), EFLH of the electrolyser, and water consumption.
2.3. Economic Analysis
2.3.1. CAPEX and Maintenance Costs
The estimation of the costs was based on the costs for various energy production technologies considered in the EU Reference Scenario 2020 [32]. Table 3 presents the capital expenditure (CAPEX) and operation and maintenance cost (O&M) values used in this study, adapted from the EU Reference Scenario. The estimation of annualised CAPEX considers the different equivalent full-load hours of operation of the electrolyser powered by different configurations of RES technologies. In some cases, the technical lifetime of the electrolyser (50,000 h at full load) is reached before the end of the project and equipment substitution costs must be taken into account using a CAPEX projection for 2040. This only applies to the electrolyser, as the other pieces of equipment have technical lifetimes that exceed the duration of the project.
2.3.2. Variable Costs
The variable costs considered in this study are related to power and water supply to the electrolyser and are shown in Table 4. The cost of electricity from the grid was based on contracts in the futures market of MIBEL for 2030 [43]. The cost of access to the power grid for the injection of excess production of the dedicated RES was obtained by projecting the present values of the grid access tariffs for producers, as defined by ERSE [44], to 2030, considering an average annual inflation rate of 1.5%.
It is assumed that the water used by the electrolysers is of drinking quality and the cost of water was obtained from the 2020 consumer price of drinking water supplied by the Sines water company projected to 2030, considering an average annual inflation rate of 1.5%. The same procedure was used to estimate the annual cost of connection to the water grid [45].
2.3.3. Levelised Cost of Hydrogen
The LCOH is obtained by dividing the discounted total annual costs of the plant (annualised CAPEX, annual O&M, and variable costs) by the discounted annual hydrogen output for each configuration, as follows:
where:
- Ii—investment in year i (electrolyser, solar PV, wind, and storage—EUR).
- Mi—O&M costs in year i (EUR).
- Vi—variable costs in year i (EUR).
- Si—revenues from the sale of excess electricity production in the year i (EUR).
- Ei—hydrogen production in year i (kg).
- R—discount rate.
Following the method described by Tang et al. [46], the estimation is simplified by considering the costs, revenues, and hydrogen production to be constant over the years for each configuration, so that the LCOH can be calculated as follows:
As shown in Table 3, the O&M costs are set as a percentage of investment costs, so that and the investment value I is considered the annualised value of the initial investment I0, such that and, therefore, the value of LCOH is obtained by the following:
where n is the duration of the project, which is set to n = 20. For those configurations where electricity imports from the grid are allowed, it is always considered that the price paid is the price of electricity imports shown in Table 4.
The LCOH is generally taken as the most relevant parameter to evaluate the economic viability of a project. The cost of hydrogen produced from steam methane reforming, which is presently the standard technology in the field of hydrogen production, is in the range of 0.60–2.67 EUR/kg [2,3,4], and the upper limit of this range is used here as the benchmark value to evaluate the competitiveness of each of the 72 renewable production configurations of this study.
LCOH should not be the only factor that defines the viability of a project, as the best options for investment should be those that minimise LCOH and maximise annual hydrogen production. The problem may be addressed if, instead of LCOH, one considers the investment productivity, i.e., the amount of hydrogen produced by each euro of investment. Investment productivity is equal to . Using this parameter, the analysis is converted into a maximisation problem, where both investment productivity and annual hydrogen production are to be maximised. The best options are the ones with a higher value for the product of the total annual hydrogen production by the investment productivity. This is similar to solving a Paretian utility problem and, analogously, this product will be referred to as the utility of the project. The value of utility is then used as the parameter to compare the 72 configurations.
2.3.4. Levelised Cost of Electricity
The LCOE, in EUR/MWh, is evaluated for electricity produced by the associated RES and is obtained by dividing the total annualised costs of the RES (annualised CAPEX, plus annual O&M) by their total annual electricity production. The LCOE is given by the following:
where:
- —CAPEX of solar PV and/or wind power (EUR).
- —percentage of CAPEX as O&M costs.
- —electricity production (MWh).
- —discount rate.
- n—duration of the project (n = 20).
The excess electricity production is sold to the grid at a flat rate equal to the LCOE value of each configuration, with a cap price of 37.05 EUR/MWh (the grid electricity price).
3. Results
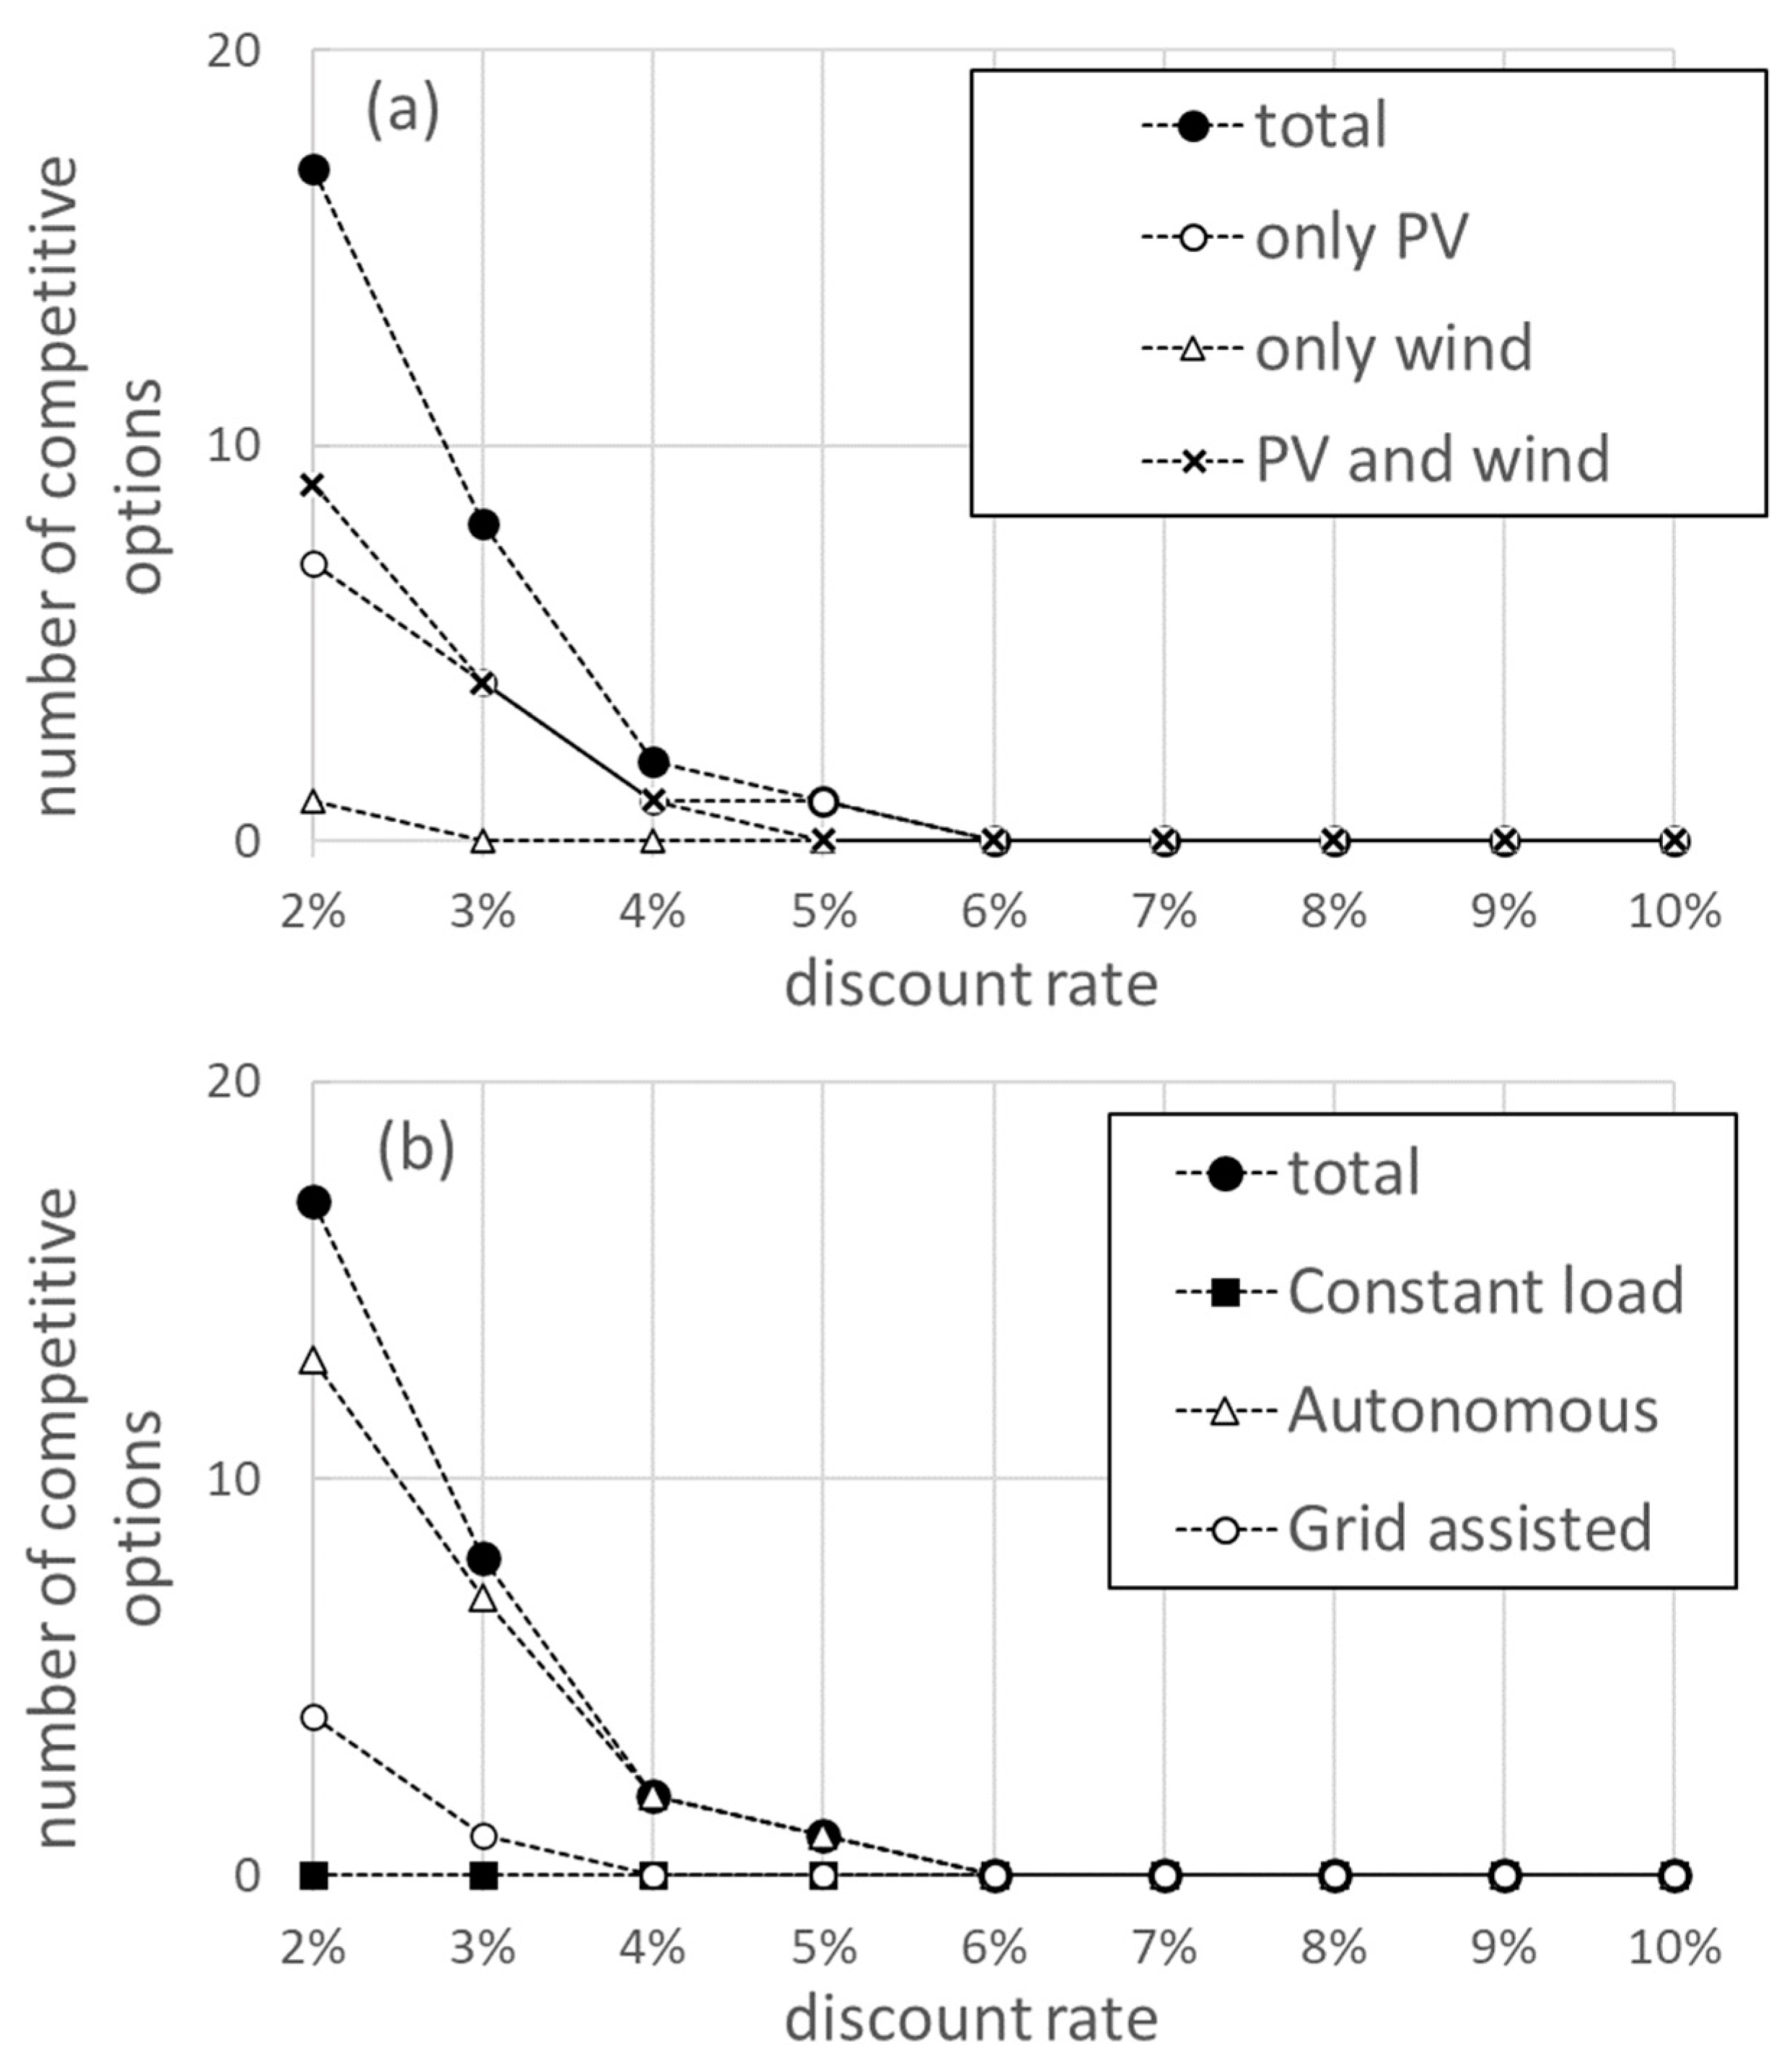
The discount rate is a key parameter in evaluating the cost structure of the project. The influence of the value of the discount rate on the economic performance of the system is analysed below. Figure 3 shows the number of competitive solutions (with an LCOH value smaller than 2.67 EUR/kg), for each discount rate value. The number of competitive options decreases rapidly with the increasing discount rate and is dominated by configurations powered by only solar PV and by solar PV and wind. For discount rate values above 5%, no options are available that can compete with fossil fuel costs. Configurations powered exclusively by wind cease to be competitive for a discount rate of 3%. When the operation mode is considered, it is found that the autonomous mode provides the largest number of competitive options. For the constant load operation, no competitive options are obtained for any discount value rate. In the grid-assisted mode, there are competitive options for discount rates below 4%.
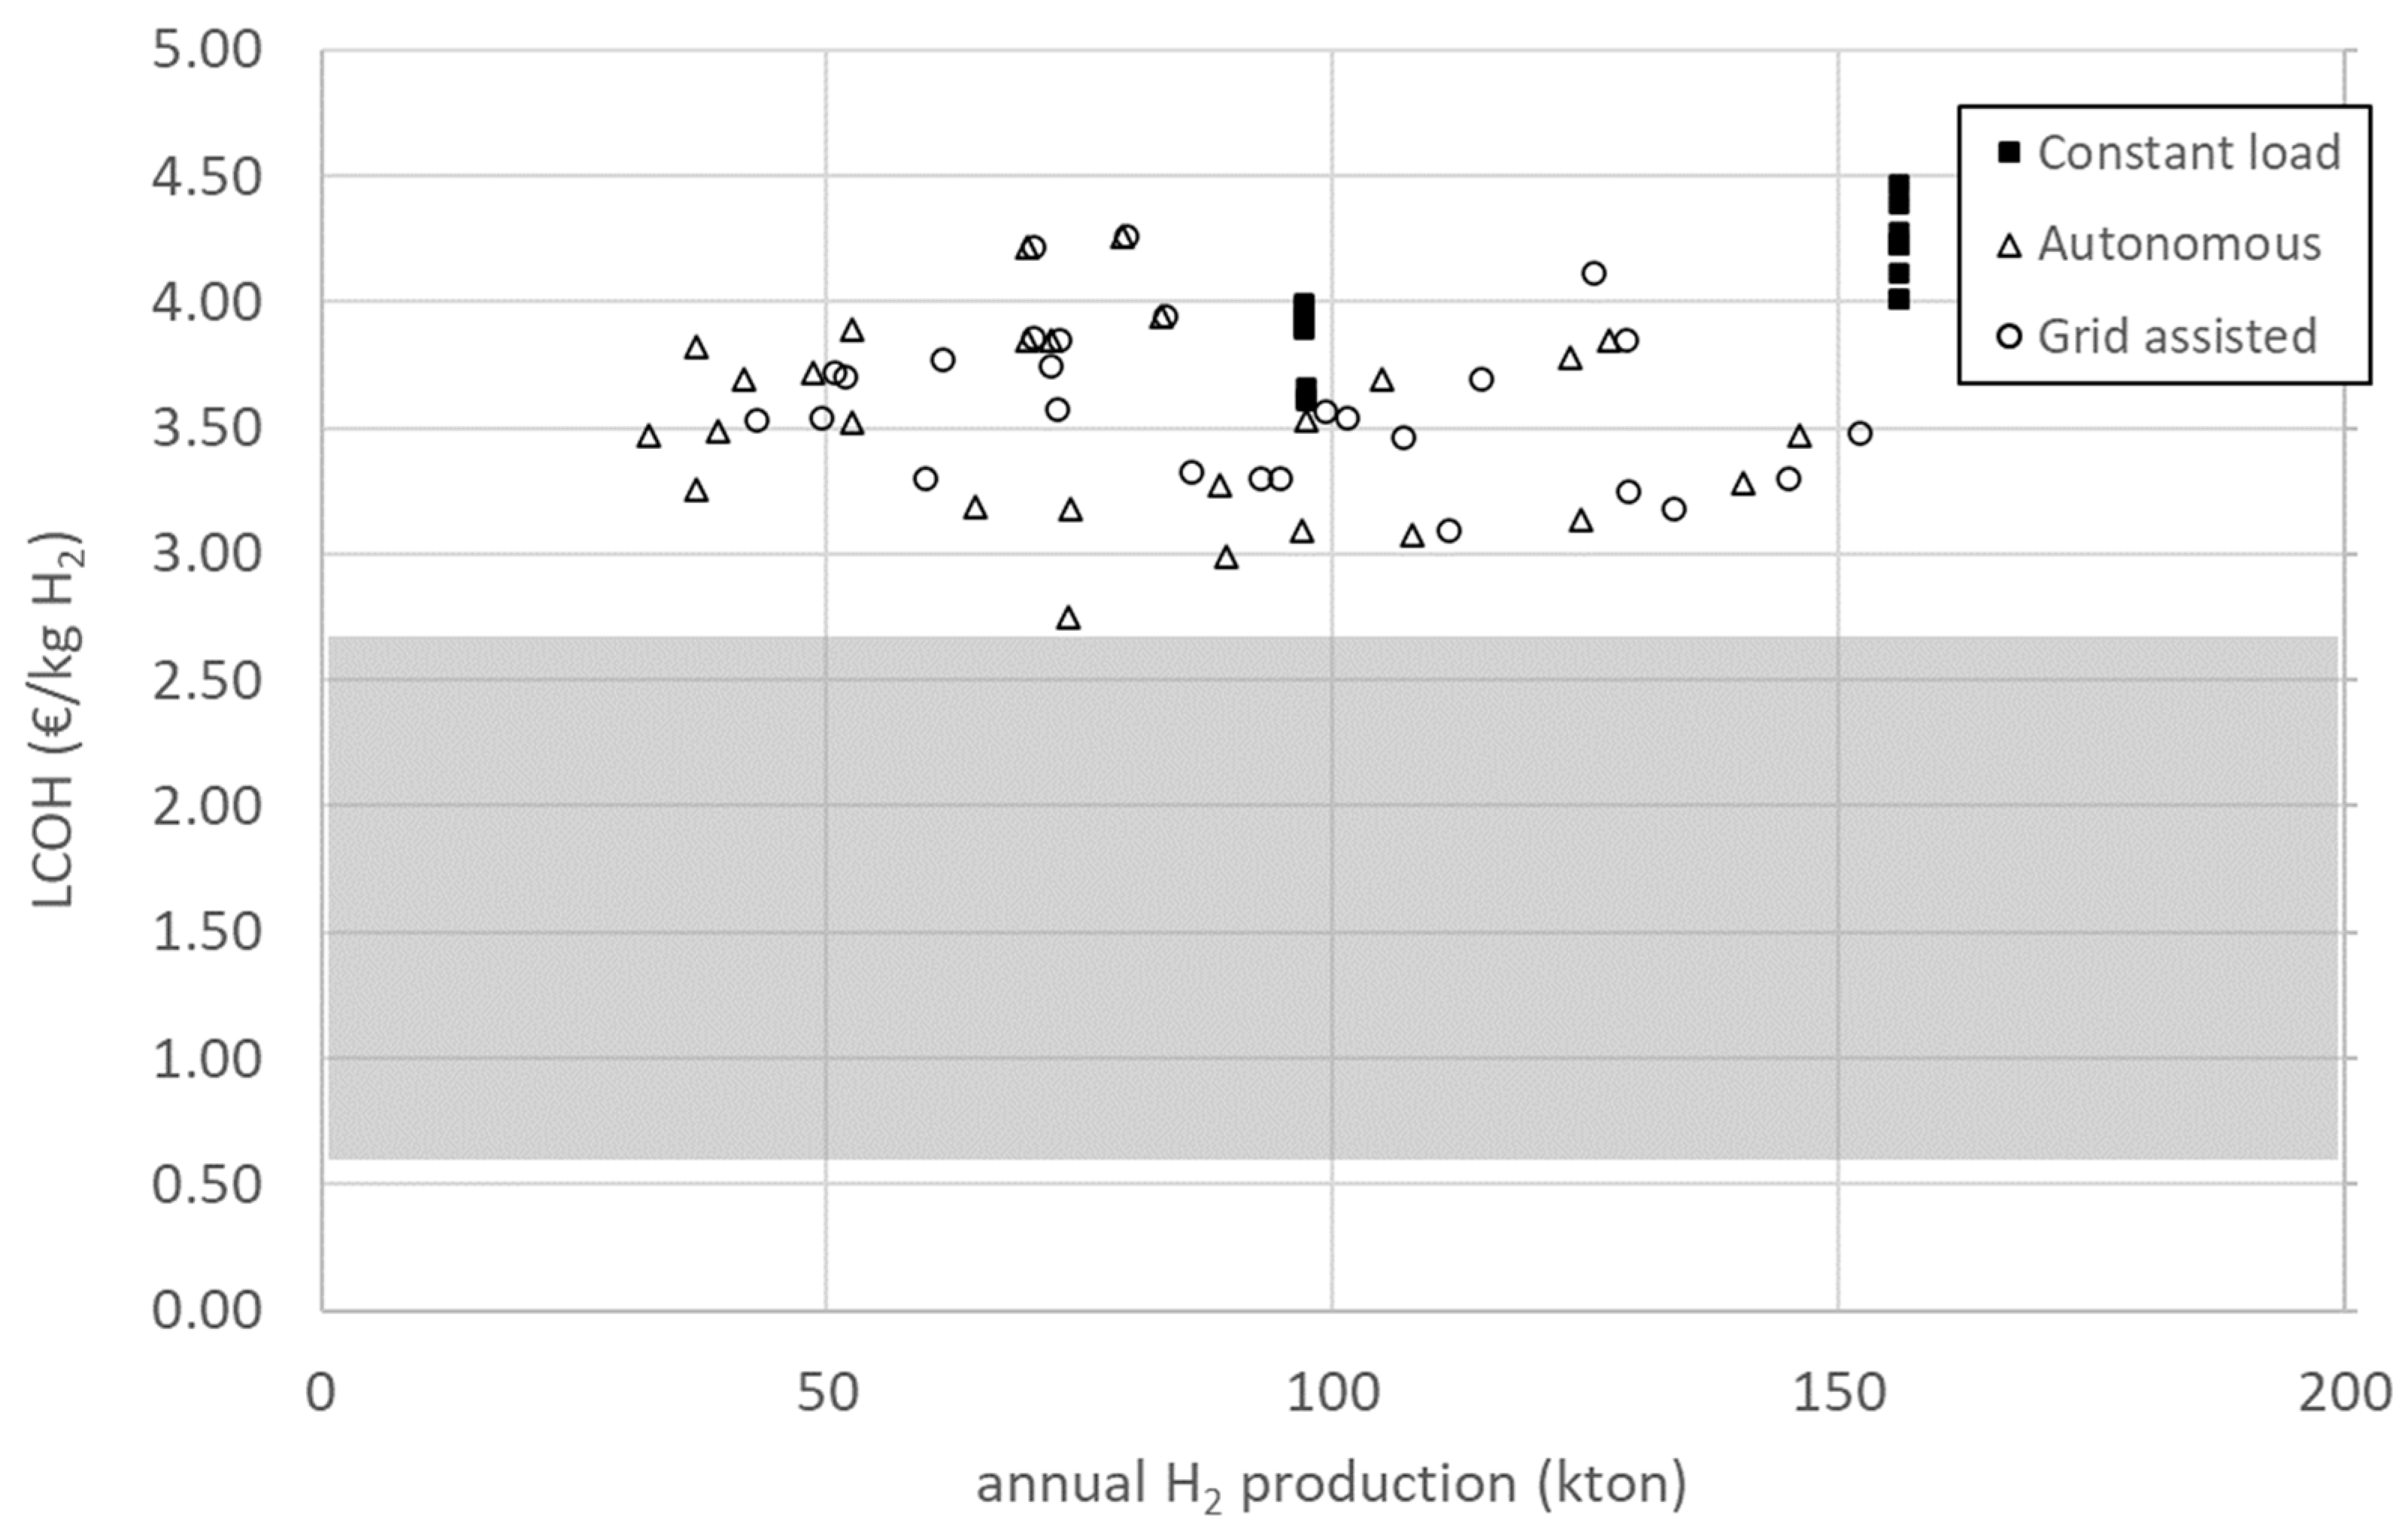
Discount rates are uncertain and can vary from country to country, depending on several factors. Reports published by different international organisations place the discount rate for hydrogen projects in the range of 5–8% [2,40,47,48]. Studies concerned with the hydrogen economy in Europe use discount rates of 6% [49,50], and this is the value used to conduct an analysis of the cost structure of the project. In Figure 4, the LCOH is plotted as a function of annual hydrogen production for a discount rate of 6%. LCOH values range between 2.75 and 4.47 EUR/kg, while annual production is between 32 and 156 kton. As can be observed, narrow ranges of LCOH (as an example, see the range from 3.00 to 3.50 EUR/kg), correspond to a very large spread of values of annual production, highlighting the need to use the utility parameter presented in Section 2.3.1.
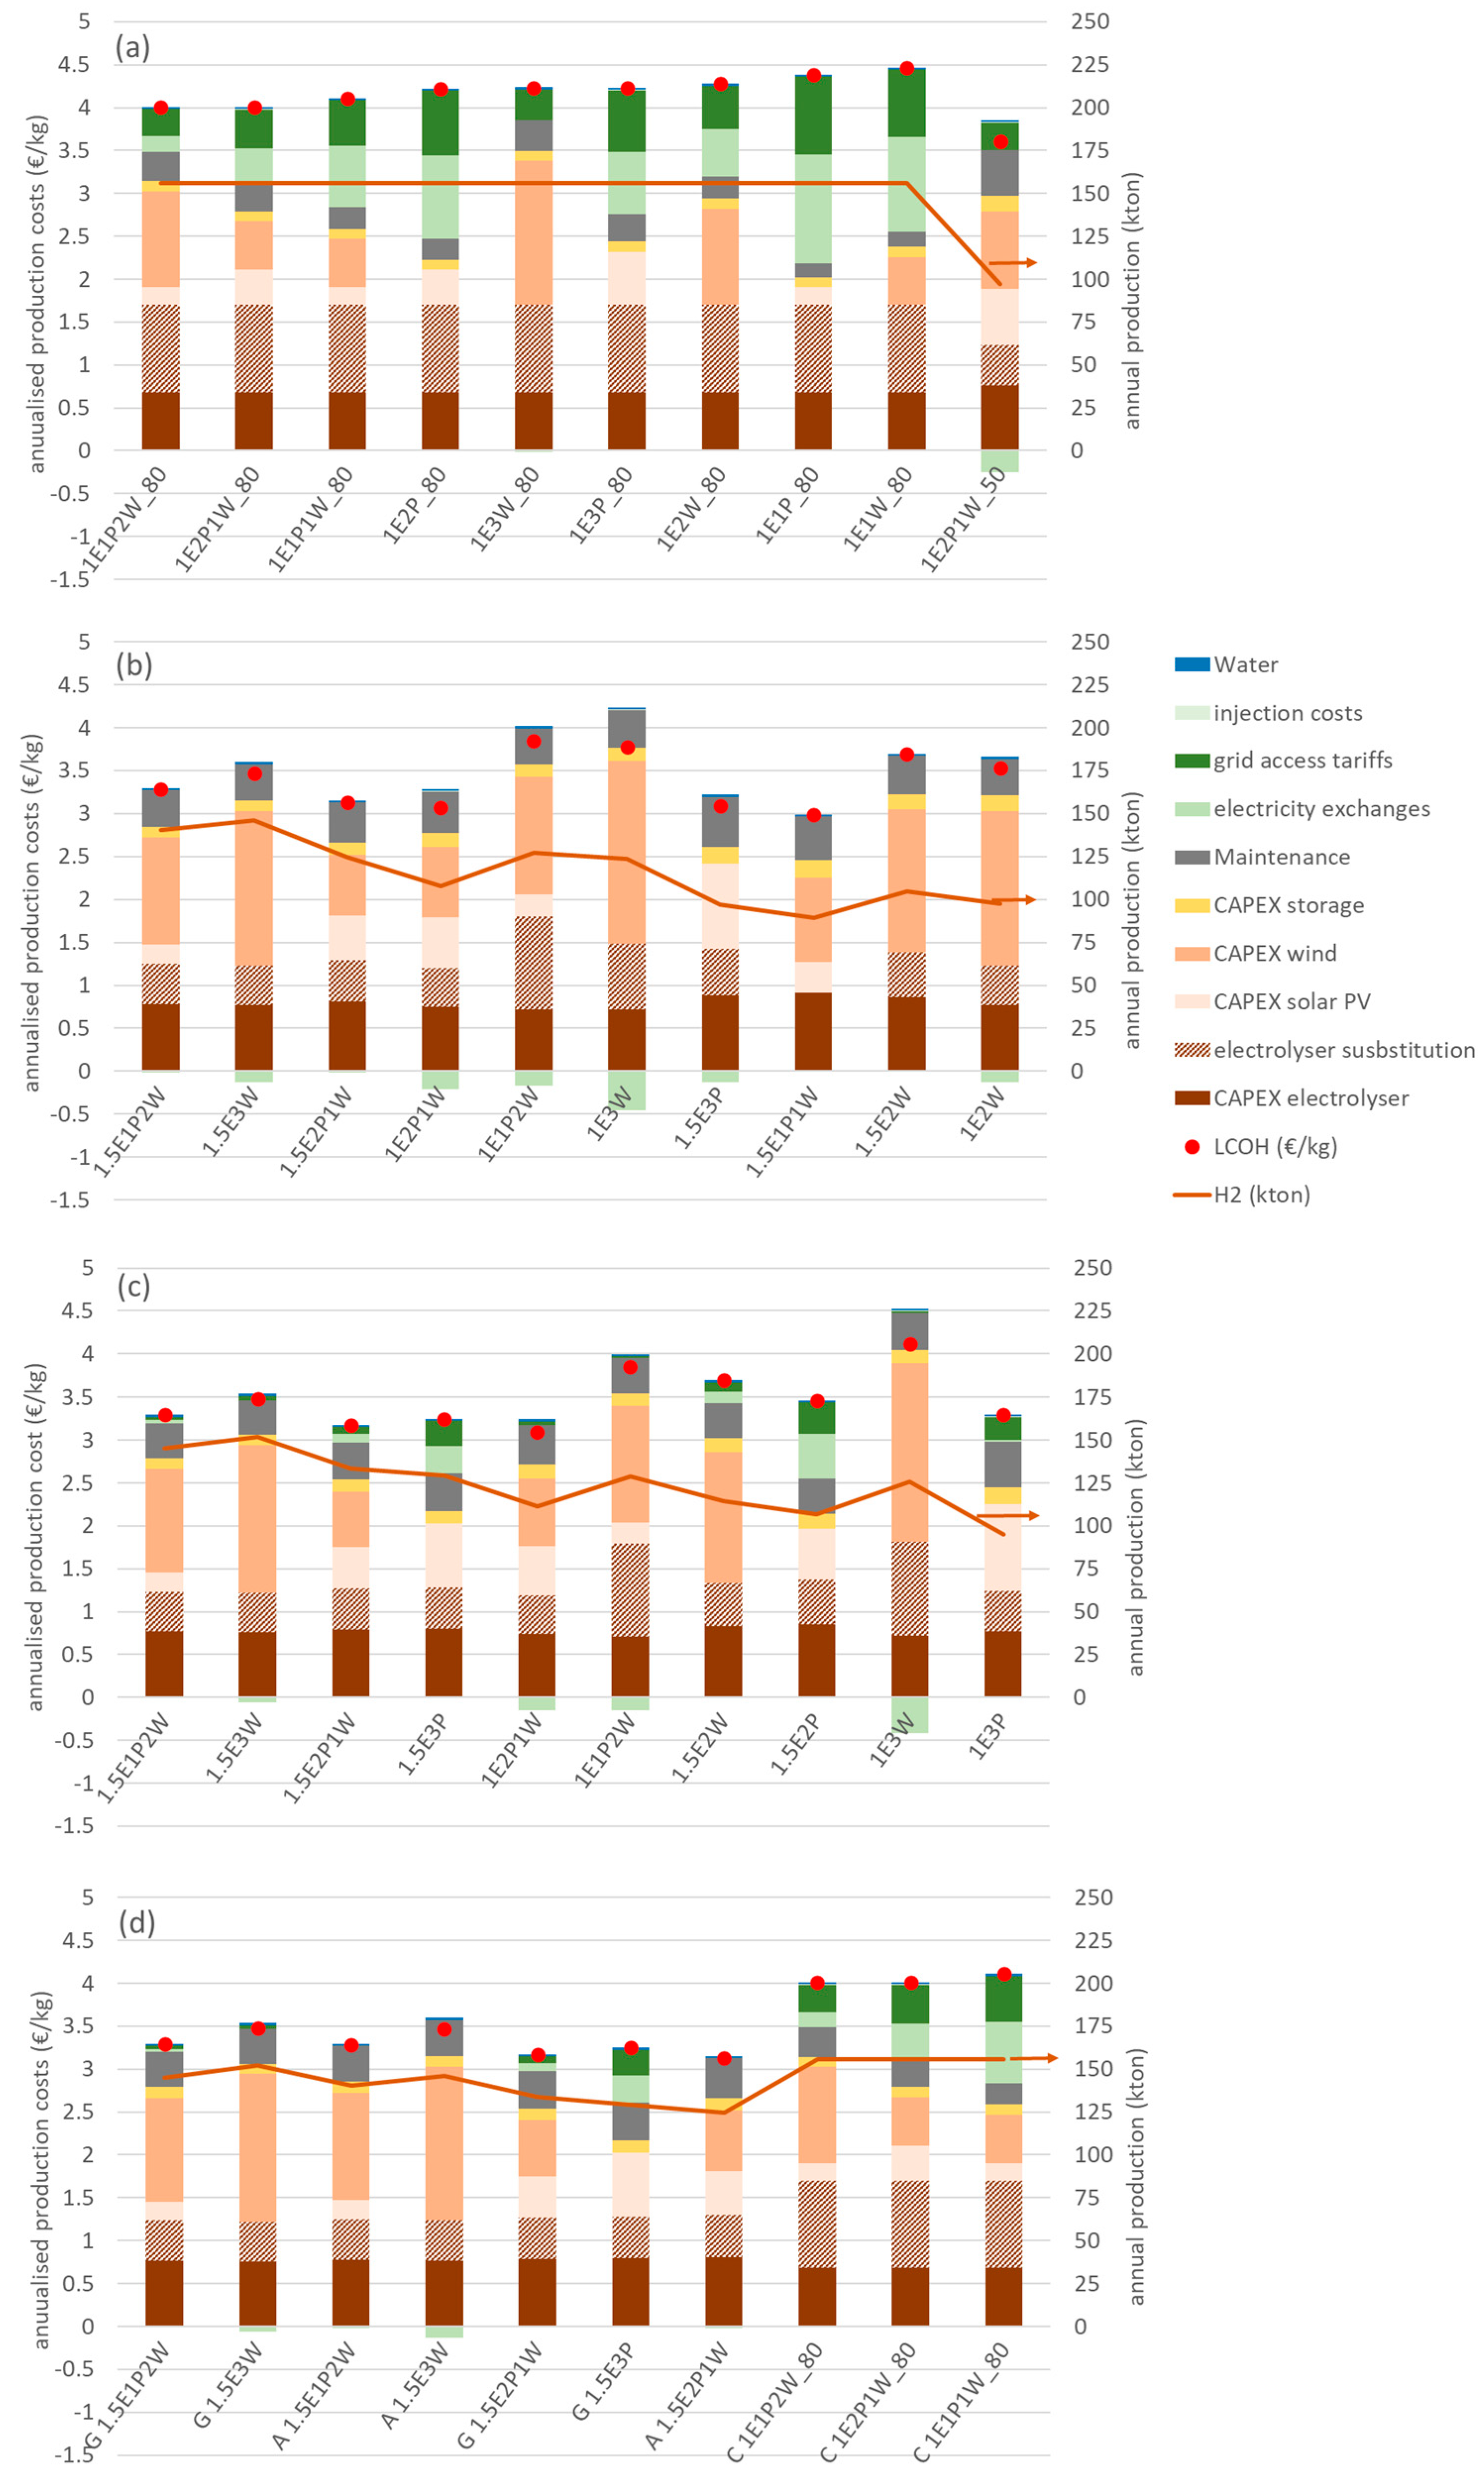
Figure 5 shows the cost structure for the ten configurations with the highest value of utility for each mode of operation of the electrolyser, considering a discount rate of 6%. The configurations are ordered from left to right by decreasing value of utility. In the text below, nomenclature is used to identify each configuration, as explained by the following two examples: in the constant load mode, the configuration represented by 1E1P_80 refers to a 1 GW electrolyser powered by 1 GW of solar PV and operated with a capacity factor of 80%. The label 0.5E2P1W refers to a configuration with an electrolyser of 0.5 GW capacity, powered by 2 GW of solar PV and 1 GW of wind.
Access to the grid to provide the power requirements of the electrolyser that are above those of the dedicated renewable sources (“grid access tariffs” in Figure 5), as well as the injection of excess electricity production in the grid (“injection costs” in Figure 5), are subject to charges and tariffs, as is any other industrial consumer or producer of electricity. The balance of electricity imports from the grid minus exports to the grid is represented by the green bars (“electricity exchanges”), and it can be observed that some configurations achieve reduced costs by selling excess electricity to the grid.
The results for the constant load operation are shown in Figure 5a. The LCOH, represented by the red dot, varies between 3.61 EUR/kg and 4.47 EUR/kg and the higher-utility configurations are dominated by the 80% capacity factor option (annual hydrogen production of 156 kton). In general, this mode of operation has an importing balance regarding electricity exchanges with the grid, as shown by the positive values in the electricity exchange component of the cost structure. The configuration 1E1P_80 has the largest grid electricity costs, representing 49.6% of the LCOH. In this case, the electrolyser is powered by 1 GW of solar PV and the need to maintain a constant operation during nighttime requires very significant amounts of grid energy. For the configuration 1E3W_80, the 3 GW of wind power can cover most of the energy needs of the electrolyser, resulting in a small importing balance, with minimum grid electricity costs of 8.4% of the LCOH. For all configurations working with a capacity factor of 80%, the electrolyser technical lifetime is reached after 7.1 years (11.4 years for 50% capacity) and requires substitution, resulting in the additional cost shown in the cost structure.
The cost structure for the autonomous mode is shown in Figure 5b. The LCOH values vary between 2.99 and 3.85 EUR/kg and the annual hydrogen production ranges from 90 kton to 146 kton. The configuration with the largest value of utility, 1.5E1P2W, has an annual production value of 141 kton. Of the ten configurations with a higher utility, only one, 1.5E3P, is powered exclusively by solar PV. Many configurations present an exporting balance of electricity exchanges that contribute to lowering the value of the LCOH. The cost structure is dominated by CAPEX, averaging 89.0% for the configurations shown in Figure 5b. The configurations with an annual production above 100 kton have ratios of renewable capacity to electrolyser capacity of 3:1 and 2:1. The configuration 1.5E1P1W, with a ratio of 1.3:1 of renewable capacity to electrolyser capacity, represents a case where the electrolyser does not have to be substituted for the duration of the project. This happens in other configurations (not shown) where the lower ratio of renewable capacity to electrolyser capacity results in a smaller capacity factor of the electrolyser and, consequently, a reduction in annual hydrogen production.
The results of the cost structure of the grid-assisted mode of operation are displayed in Figure 5c. The LCOH values are in the range of 3.10–4.11 EUR/kg and the annual hydrogen production varies between 95 kton and 152 kton. There are seven configurations in common with the autonomous mode but with an increased LCOH value because of the grid electricity costs. It should be noted that, for the three modes, most of the higher-utility configurations have electrolyser substitution costs.
Figure 5d shows the ten configurations with the highest value of utility, considering all 72 configurations. There are three technical configurations (1.5E1P2W, 1.5E3W, and 1.5E2P1W) that occur for both autonomous and grid-assisted modes. The technical configuration with the highest value of utility is 1.5E1P2W in the grid-assisted mode, with an LCOH value of 3.30 EUR/kg and an annual production of 145 kton. In the autonomous mode, 1.5E1P2W results in an LCOH of 3.28 EUR/kg and an annual production of 141 kton. The configuration 1.5E3W has an LCOH of 3.48 EUR/kg and a production of 152 kton in the grid-assisted mode, and an LCOH of 3.47 EUR/kg and a production of 146 kton in the autonomous mode. The configuration 1.5E2P1W results in an LCOH of 3.18 EUR/kg and production of 134 kton in the grid-assisted mode; in the autonomous mode, the values are 3.13 EUR/kg and 125 kton. There are seven configurations in the autonomous and grid-assisted modes, with a ratio of RES power capacity to electrolyser capacity of 2:1.
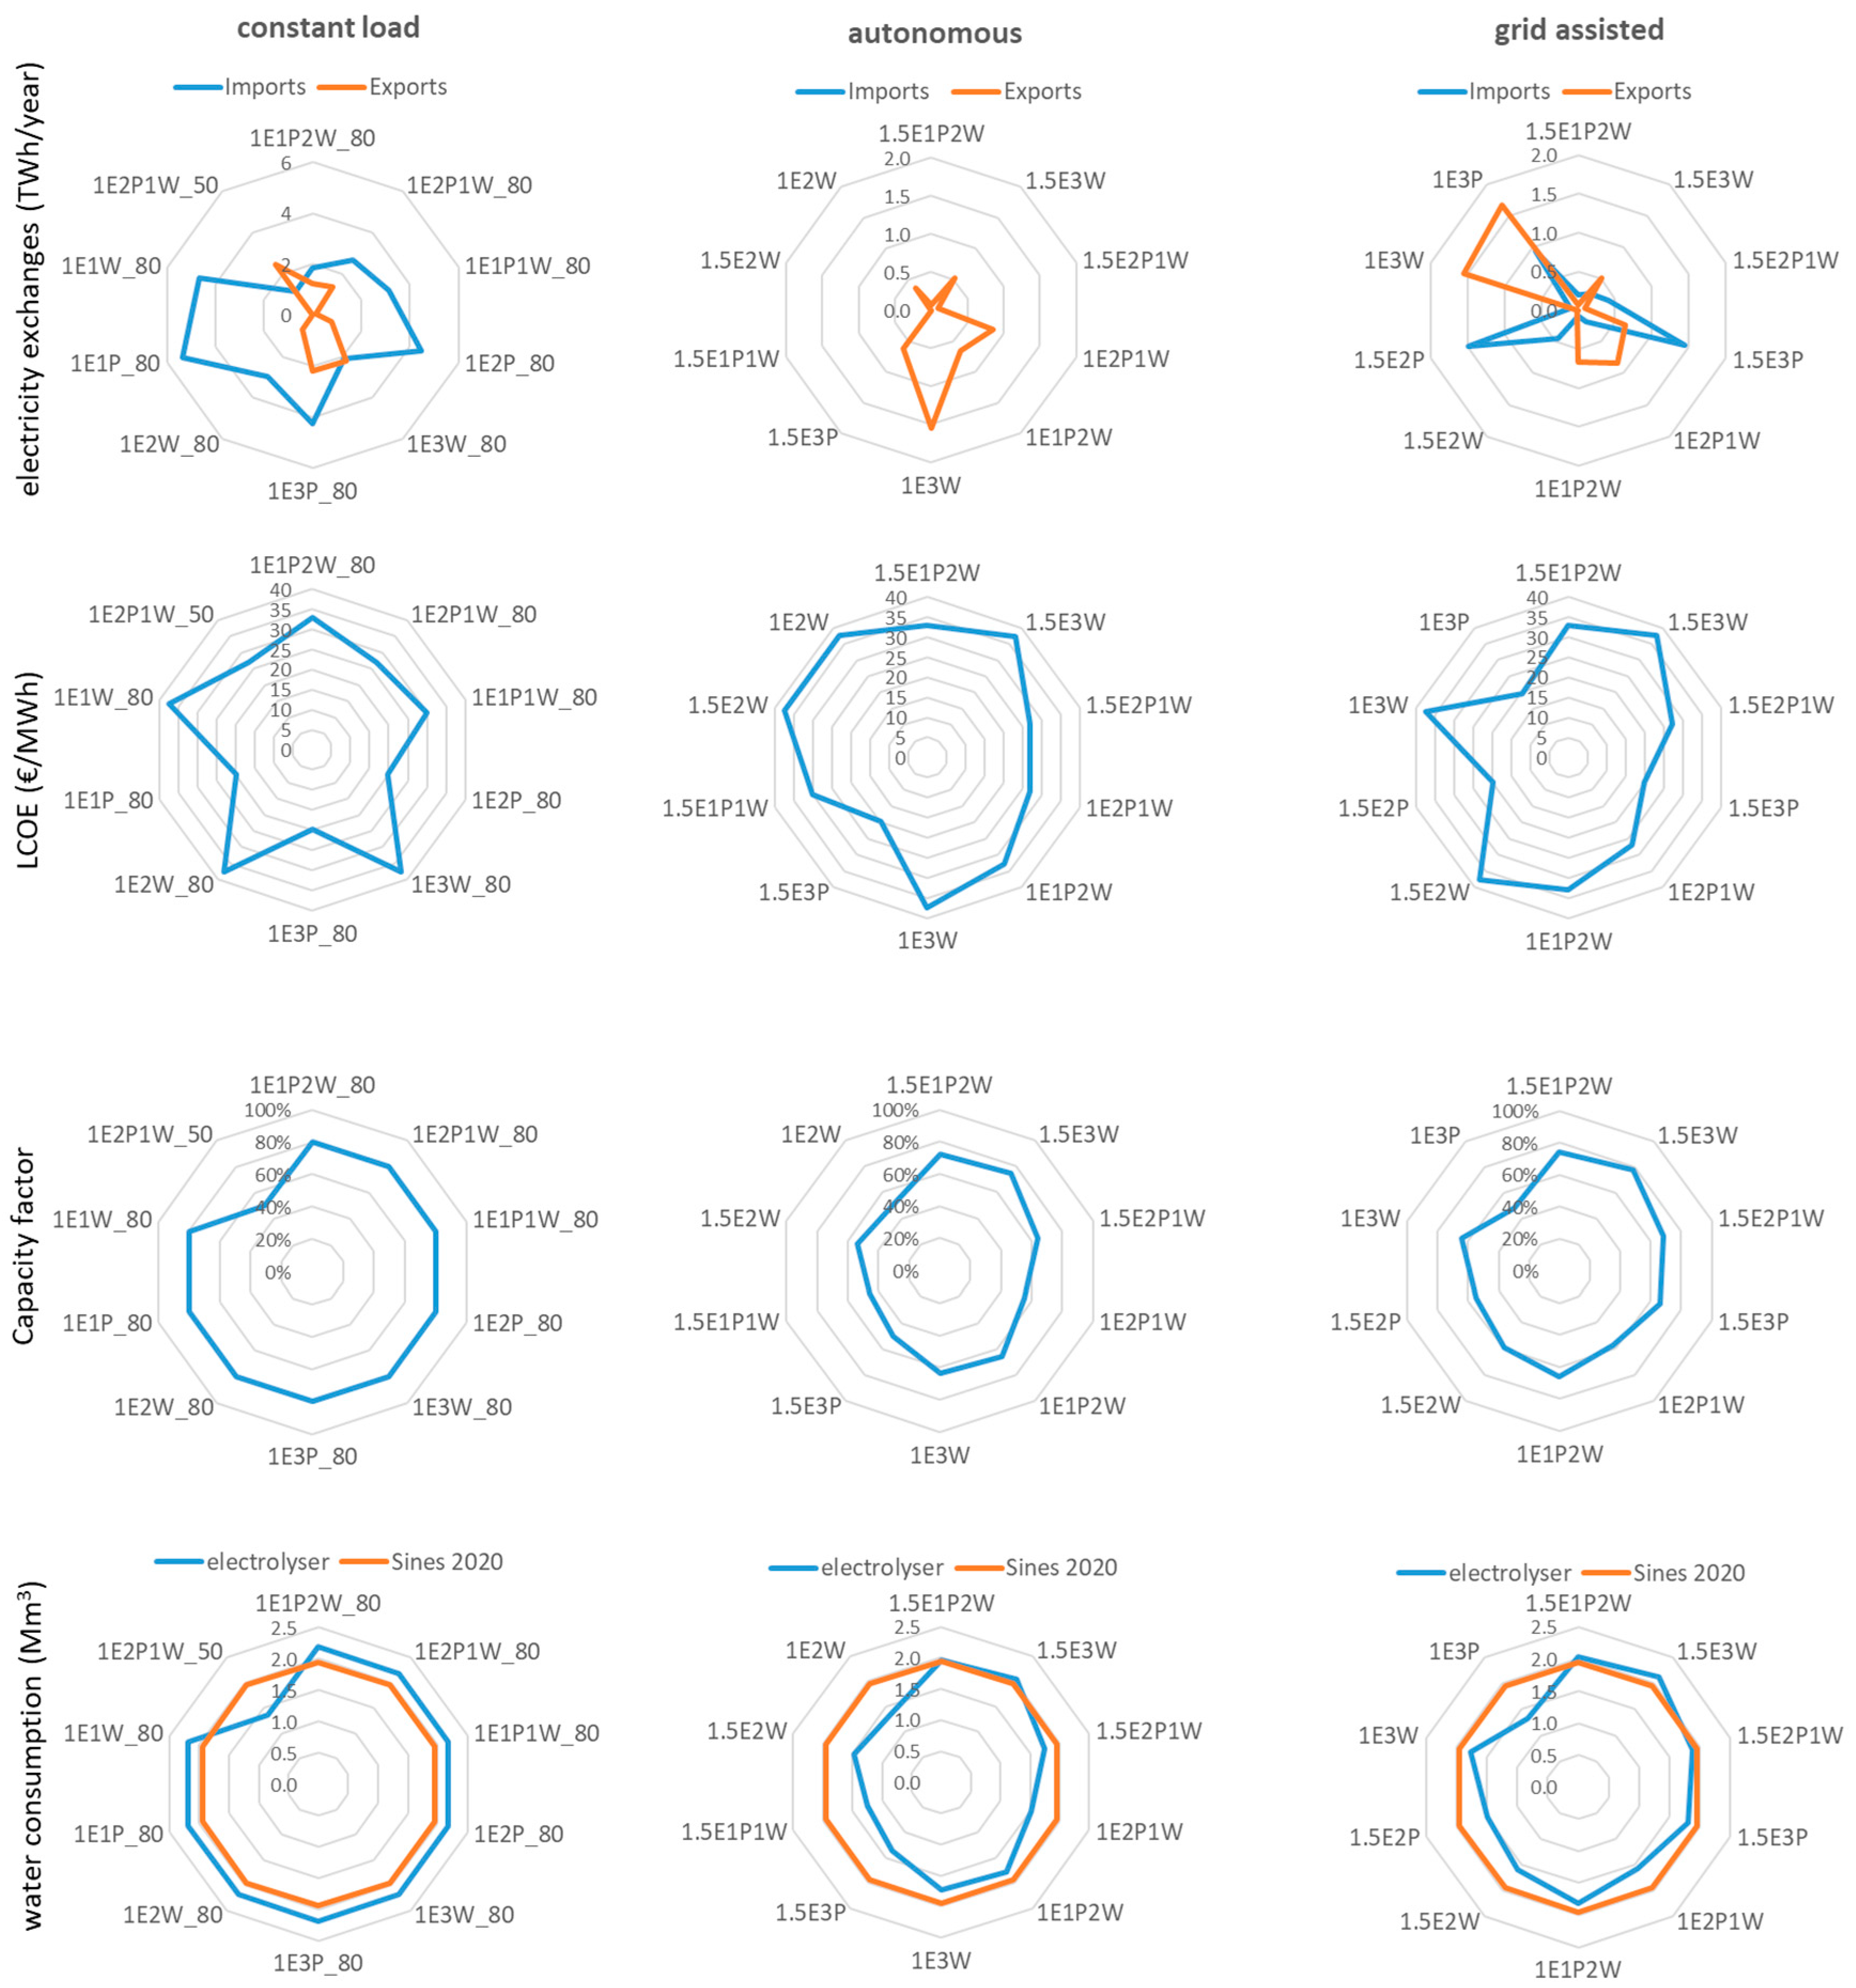
Figure 6 shows, for the ten configurations with the higher utility value for each electrolyser operating mode, the exchanges with the national electricity grid, the LCOE produced at the facility, the capacity factor of the electrolyser, and the water consumption of the electrolyser. The configurations with a high ratio of RES to electrolyser capacity, in all modes of operation, can have very large exports to the grid, while configurations powered exclusively by solar PV may require large imports in the constant and grid-assisted modes. Figure 6 shows that, for the constant-load operation, imports from the grid are between 1.14 and 5.36 TWh/year. In the grid-assisted mode, the three configurations powered only by solar PV (1.5E3P, 1.5E2P, and 1E3P) require annual imports between 0.94 and 1.49 TWh/year.
The LCOE for electricity produced by the dedicated RES, for a discount rate of 6%, varies between 19.75 EUR/MWh, for configurations powered only by solar PV, and 37.45 EUR/MWh for configurations powered exclusively by wind. In most cases, the cost of electricity is lower than the cost displayed on the futures market for 2030 at present (see Table 4), and the system could be an important source of cheap renewable electricity.
The electrolysers work with a capacity factor between 46% and 75% in the autonomous mode and between 48.7% and 78% in the grid-assisted mode. Larger capacity factors mean an increase in annual hydrogen production but also shorter electrolyser lifetimes in years, which requires more frequent equipment substitution.
The water consumption of the electrolyser is estimated based on the stoichiometric conversion of water into molecular hydrogen and is calculated based on the hydrogen output at the electrolyser (before the compression and storage stages). Figure 6 shows that the amounts of water necessary for electrolysis are of the same order of magnitude as the amount of water distributed for human consumption to the Sines Municipality (14,000 inhabitants in 2020). The values shown here are a lower limit for water consumption, as the technical specifications of electrolyser manufacturers generally indicate water needs above the stoichiometric ratio.
4. Discussion
The results presented in Figure 6 for the electricity exchanges with the grid show configurations with very large imports from and exports to the grid. This is particularly relevant for the constant operation mode, where some configurations require annual imports from the grid above 4 TWh. As a comparison, the final consumption of electricity in Portugal in 2020 was 46.35 TWh and, in some cases, the annual imports of the unit in the constant operation mode represent more than 10% of the total national consumption. Furthermore, if the unit is expected to produce green hydrogen, there should be some active mechanism to guarantee that the correct amount of renewable power is available from the grid. The feasibility of the electric system supplying such large values of imports must be taken into account when choosing a technical configuration for investment.
On the export side, it has been assumed that all excess electricity production is sold to the national grid. This might not always be possible because excess renewable production at the unit, particularly solar PV, would occur simultaneously with excess production elsewhere in the electric system. The curtailment of electricity production at the unit, or sales to the grid at a significantly reduced price, would be possible consequences. In both cases, the contribution of electricity revenues to reductions in LCOH would decrease. Storage systems such as batteries could avoid the curtailment of excess production, decrease dependence on the electricity grid, or provide backup power in times of reduced renewable production, but their implementation would significantly change the technical operation and cost structure of the unit.
The option with the lowest LCOH is the technical configuration in the autonomous mode with 1.5 GW of electrolyser capacity, powered by 2 GW of solar PV (1.5E2P). This option is the only competitive option (i.e., with an LCOH lower than that of grey hydrogen) for a discount rate of 5% (see Figure 3). For a discount rate of 6%, it has an LCOH of 2.75 EUR/kg. Even if this option has the lowest LCOH, the annual hydrogen production is 74 kton, which is a rather low value considering the expected production range for the project.
If, instead of cost, utility is considered as the figure of merit, then the outstanding configuration is 1.5E1P2W in the grid-assisted mode (1.5 GW electrolyser powered by 1GW of solar PV and 2 GW of wind). It has limited exchanges with the electricity grid with 200 GWh/year of imports and 70 GWh of exports and an electrolyser capacity factor of 74.4%. This configuration has an annual production of 145 kton and the LCOH for a discount rate of 6% is 3.30 EUR/kg. The technical configurations 1.5E1P2W, 1.5E3W, and 1.5E2P1W, with an LCOH in the range 3.13–3.48 EUR/kg; these are among the 10 of the 72 configurations with the largest utility values (see Figure 5d). They appear in both the autonomous and grid-assisted modes, with the grid-assisted configurations showing a higher LCOH and increased annual production compared to their equivalent configurations in the autonomous mode. The limited use of grid electricity allows for longer operation hours for the electrolyser and the increase in production more than compensates for the increase in costs, resulting in a higher value of utility.
These LCOH values for the best configurations of the autonomous and grid-assisted modes are similar to those obtained by other authors making estimations for various European locations [14,16] and are in good agreement with the results presented by IRENA, which project values between 2 and 5 USD/kg for various scenarios in 2030 for the Sines area [48,51]. These LCOH values are above those for hydrogen produced from steam methane reforming. The gap between these values could likely be closed by a combination of subsidies to renewable production and the application of carbon taxes to fossil-based production.
Hydrogen production of the order of 100 kton per year requires an abundant source of fresh water. In a study by Simões et al. [52] on the application of a Sustainable Value Methodology to the problem of water availability and usage for electrolysis in hydrogen production in Portugal, it is found that public grid water is the best-suited source of water for electrolysis due to the lower supply risks, lower costs, and absence of complex permitting processes. As shown in Figure 6, all configurations with higher values of utility have a water consumption that is at least of the same order of magnitude as the water distributed annually for human consumption in the Sines municipality. Sourcing an increased volume of water could be a challenge in a region affected by water scarcity and frequent droughts. A measure of water scarcity is given by the WEI+ index which represents the ratio of water use versus renewable freshwater resources. In 2019, the WEI+ index was above 40% in the river basins of the Sines area (Sado and Mira basins) [53], indicating that stress is severe and the use of freshwater is unsustainable [54]. Simões and co-workers have also found that, for locations near the coast, seawater and wastewater treatment plant effluent are possible water sources for electrolysis. Desalination could be an option that would minimise competition for the use of local water resources, but these costs would have to be integrated into the analysis.
There are two issues in which a sensitivity analysis is performed. In this study, it is assumed that renewable power is directly connected to the electrolyser. However, it might not be possible to install such a large renewable capacity in nearby locations, in which case all or part of the electricity produced by the dedicated renewables would have to be transported through the national grid. If that were the case, the tariff on access to the electricity grid displayed in Table 4 would have to be applied, resulting in a significant increase in costs. Considering a limiting case where all the dedicated renewable production passes through the electricity grid reveals two problems. First, the LCOH for the configurations shown in Figure 5 would increase to a range of 4.04–5.42 EUR/kg, a variation of 31–35% in LCOH, compared to the case of direct connection to the electrolyser. This happens because, in this limiting case, all electricity produced by the RES sources would have to pay the tariff for injection into the transmission grid and all the electricity consumed by the electrolyser would have to pay the average tariff for access to the electricity grid (see Table 4). The configuration 1.5E1P2W (the configuration with the overall highest utility parameter values) in the grid-assisted mode would have its LCOH raised from 3.30 to 4.32 EUR/kg, an increase of 31%. Second, to produce the amounts of hydrogen shown in Figure 5, the electricity consumption of the electrolyser ranges from 4.03 TWh/year (1.5E1P1W in the autonomous mode) to 7.03 TWh/year (for all configurations in the constant load mode working at 80% of nominal capacity). In configuration 1.5E1P2W, the electrolyser uses 6.52 TWh of electricity per year. The transportation of these large amounts of energy would pose a very significant challenge for the national grid infrastructure. This, therefore, shows that, from the perspective of costs and transport infrastructure, there is limited scope for a significant use of the national grid in supplying a GW-scale electrolysis unit.
Renewable power systems are very sensitive to weather conditions; therefore, the annual hydrogen production is dependent on a series of factors over which the operator has no control. When the production of a given technical solution (i.e., the same choice of electrolyser capacity and combination of RES technologies) is compared for years with different average weather conditions, the advantages and disadvantages of each configuration can be evaluated. Configurations that are powered by a single renewable technology are more prone to significant production variations, e.g., an electrolyser powered only by solar PV will have a significant reduction in production in a windy year compared to a sunny year. In general, powering the electrolyser with wind power provides higher production values because wind power has a longer EFLH. In the autonomous mode, for the configurations powered exclusively by solar PV, the production in a sunny year can be 3.4–6.8% higher than the production in a windy year. If the plant is powered by wind, the production in a windy year can be 1.9–6.6% larger than in a sunny year. In the grid-assisted operation, these values decrease to 2.0–3.9% and 1.5–4.9%, respectively, because, in this mode of operation, the use of grid electricity attenuates the effect of weather variability. The options that combine both RES technologies clearly show an advantage in terms of minimising production variations. In the autonomous mode, these hybrid options result in a maximum difference in production between sunny and windy years of 2.7%, while, in the grid-assisted mode, the difference is 1.9%. It is evident that hybrid electricity production systems provide a steadier and more predictable rate of production.
There are currently no operating green hydrogen facilities in Sines. However, it is understood that the EN-H2 proposal will not be implemented as a single unit. Various companies and consortia have announced projects for the area dedicated to the production of green hydrogen, sometimes employing alkaline electrolysis [55]. However, precise operation details and technical configuration are not available for comparison. The presented results are expected to be relevant as an ex ante analysis of the various possible solutions being considered for implementation.
5. Further Work
Further work should consider the problem of additional infrastructure regarding access to the national electricity grid. Sines was, until 2021, the location of a coal power plant with a nominal power of 1871 MW, so it is reasonable to assume that the existing infrastructure could accommodate the proposed hydrogen production facility. The possibility of other large industrial projects being implemented in the region, which could both receive and inject electricity into the national grid, could change this situation, and additional factors may be required for the technical and economic analysis.
The results could be further optimised by using smaller deployment units for the RE technologies. This would increase the number of configurations to be analysed but would provide a better adjustment between electrolyser capacity and RE power, ideally maintaining the levels of annual production and reducing the exchanges with the electricity grid.
A topic for further analysis would be the use of offshore wind for electricity production. Offshore wind has recently been integrated in the Portuguese National Energy and Climate Plan and is a technology that generally has higher equivalent full-load hours than onshore wind and could provide a more stable energy supply for the electrolyser, although at a significantly higher cost.
6. Conclusions
An analysis of the technical and economic viability of a GW-scale hydrogen production unit, as presented in the Portuguese National Hydrogen Strategy, was performed using the EnergyPLAN software. The unit is composed of an electrolyser powered by associated renewable energy sources and a hydrogen storage system. Different configurations of the electrolyser capacity, renewable energy sources, and operation mode of the electrolyser provide insights into the best technical configurations to produce large amounts of hydrogen at the lowest cost.
The most favourable configurations are those with the largest values of utility, which corresponds to the largest hydrogen production levels at the lowest LCOH. The most favourable options are the autonomous and grid-assisted modes, with a 2:1 ratio between RES capacity and electrolyser capacity, which are generally powered by a combination of solar PV and wind. Working with a combination of renewable sources decreases the dependence on grid electricity (for those configurations in the grid-assisted mode) and provides a more continuous operation and a larger capacity factor for the electrolyser. Powering the electrolyser with a combination of different RES technologies also guarantees hydrogen production that is less dependent on interannual weather variations.
The EN-H2 proposes that the GW-scale electrolyser should be powered by dedicated RES in order to minimise the LCOH. This study concludes that the best option, with the higher utility value of the 72 configurations, consists of a 1.5 GW electrolyser capacity powered by 1 GW of solar PV and 2 GW of wind in the grid-assisted mode. This configuration can produce 145 kton of hydrogen per year with an LCOH of 3.30 EUR/kg. The equivalent configuration in the autonomous operation mode can produce 141 kton at an LCOH of 3.28 EUR/kg.
There are, however, a number of questions that remain open. The obtained values consider that there are no limitations in selling the excess electricity production to the grid or the need to use the national grid to transport electricity from the renewable production sites to the electrolyser. Similarly, it is considered that there are no limitations to the supply of water, although the production of large quantities of hydrogen requires an abundant supply of freshwater that could increase competition between the energy, industrial, and human uses of a resource that is scarce in the region.
Overall, the analysis shows the conditions required for the implementation of a GW-scale hydrogen production unit, such as the foreseen EN-H2, at the lowest possible LCOH, i.e., a 1.5 GW electrolyser capacity powered by 1 GW of solar PV and 2 GW of wind operating in a grid-assisted mode.
Author Contributions
Conceptualization, R.P.B. and F.N.S.; Methodology, R.P.B. and F.N.S.; Validation, R.P.B.; Formal Analysis, F.F.; Investigation, F.F., R.P.B. and F.N.S.; Writing—Original Draft Preparation, R.P.B. and F.F.; Writing—Review and Editing, F.N.S. and I.C.; Project Administration, I.C. All authors have read and agreed to the published version of the manuscript.
Funding
This research received no external funding.
Data Availability Statement
Publicly available datasets were analysed in this study. These datasets of RES production profiles can be found here: https://datahub.ren.pt/pt/eletricidade/balanco-diario/ (accessed on 10 February 2024).
Conflicts of Interest
The authors declare no conflicts of interest.
Abbreviations
| CAPEX | Capital expenditure |
| EFLH | Equivalent full-load hours |
| EN-H2 | Portuguese National Hydrogen Strategy |
| ERSE | Entidade Reguladora dos Serviços Energéticos (Portuguese Energy Services Regulator) |
| EU | European Union |
| GHG | Greenhouse gas |
| GW | Gigawatt |
| IRENA | International Renewable Energy Agency |
| kton | Kiloton (106 kg) |
| LCOH | Levelised cost of hydrogen |
| MIBEL | Iberian Electricity Market |
| Mton | Megaton (109 kg) |
| NECP | National Energy and Climate Plan |
| O&M | Operation and maintenance |
| PEM | Proton exchange membrane |
| PV | Photovoltaic |
| RES | Renewable energy sources |
| Symbols | |
| Electrolyser conversion efficiency | |
| Hourly hydrogen production (W) | |
| Nominal electric input power of the electrolyser (W) | |
| Hourly electric input power of the electrolyser (W) | |
| Hourly electric output power of solar photovoltaic (W) | |
| Hourly electric output power of wind (W) | |
| Hourly electric output power of RES (W) | |
| Hourly electric input of the electrolyser obtained from the public grid (W) |
References
- International Energy Agency. Global Hydrogen Review 2022; License: CC BY 4.0; IEA: Paris, France, 2022. Available online: https://www.iea.org/reports/global-hydrogen-review-2022 (accessed on 1 September 2023).
- International Energy Agency. Global Average Levelised Cost of Hydrogen Production by Energy Source and Technology, 2019 and 2050. Available online: https://www.iea.org/data-and-statistics/charts/global-average-levelised-cost-of-hydrogen-production-by-energy-source-and-technology-2019-and-2050 (accessed on 25 January 2024).
- International Renewable Energy Agency. Hydrogen: A Renewable Energy Perspective; International Renewable Energy Agency: Abu Dhabi, United Arab Emirates, 2019. [Google Scholar]
- Hydrogen Europe. Clean Hydrogen Monitor 2022. Available online: https://hydrogeneurope.eu/ (accessed on 10 February 2024).
- Zhang, Q.; Zhang, Z. Biological Hydrogen Production from Renewable Resources by Photofermentation. In Advances in Bioenergy; Li, Y., Ge, X., Eds.; Elsevier: Amsterdam, The Netherlands, 2018; Volume 3, pp. 137–160. ISBN 9780128151990. [Google Scholar]
- Vidal-Barrero, F.; Baena-Moreno, F.M.; Preciado-Cárdenas, C.; Villanueva-Perales, A.; Reina, T.R. Hydrogen production from landfill biogas: Profitability analysis of a real case study. Fuel 2022, 324 Pt A, 124438. [Google Scholar] [CrossRef]
- Yilmazel, Y.D.; Duran, M. Biohydrogen production from cattle manure and its mixtures with renewable feedstock by hyperthermophilic Caldicellulosiruptor bescii. J. Clean. Prod. 2021, 292, 125969. [Google Scholar] [CrossRef]
- Cao, L.; Yu, I.K.M.; Xiong, X.; Tsang, D.C.W.; Zhang, S.; Clark, J.H.; Hu, C.; Ng, Y.H.; Shang, J.; Ok, Y.S. Biorenewable hydrogen production through biomass gasification: A review and future prospects. Environ. Res. 2020, 186, 109547. [Google Scholar] [CrossRef] [PubMed]
- Liu, W.; Liu, C.; Gogoi, P.; Deng, Y. Overview of Biomass Conversion to Electricity and Hydrogen and Recent Developments in Low-Temperature Electrochemical Approaches. Engineering 2020, 6, 1351–1363. [Google Scholar] [CrossRef]
- Ishaq, H.; Dincer, I.; Crawford, C. A review on hydrogen production and utilization: Challenges and opportunities. Int. J. Hydrog. Energy 2022, 47, 26238–26264. [Google Scholar] [CrossRef]
- Qureshi, F.; Yusuf, M.; Khan, M.A.; Ibrahim, H.; Ekeoma, B.C.; Kamyab, H.; Rahman, M.M.; Nadda, A.K.; Chelliapan, S. A State-of-the-Art Review on the Latest trends in Hydrogen production, storage, and transportation techniques. Fuel 2023, 340, 127574. [Google Scholar] [CrossRef]
- Yu, Z.-Y.; Duan, Y.; Feng, X.-Y.; Yu, X.; Gao, M.-R.; Yu, S.-H. Clean and Affordable Hydrogen Fuel from Alkaline Water Splitting: Past, Recent Progress, and Future Prospects. Adv. Mater. 2021, 33, 2007100. [Google Scholar] [CrossRef]
- Kumar, S.S.; Himabindu, V. Hydrogen production by PEM water electrolysis–A review. Mater. Sci. Energy Technol. 2019, 2, 442–454. [Google Scholar] [CrossRef]
- Terlouw, T.; Bauer, C.; McKenna, R.; Mazzotti, M. Large-scale hydrogen production via water electrolysis: A techno-economic and environmental assessment. Energy Environ. Sci. 2022, 15, 3583–3602. [Google Scholar] [CrossRef]
- Khouya, A. Levelized costs of energy and hydrogen of wind farms and concentrated photovoltaic thermal systems. A case study in Morocco. Int. J. Hydrog. Energy 2020, 45, 31632–31650. [Google Scholar] [CrossRef]
- Dinh, Q.V.; Dinh, V.N.; Mosadeghi, H.; Pereira PH, T.; Leahy, P.G. A geospatial method for estimating the levelised cost of hydrogen production from offshore wind. Int. J. Hydrog. Energy 2023, 48, 15000–15013. [Google Scholar] [CrossRef]
- Vartiainen, E.; Breyer, C.; Moser, D.; Medina, E.R.; Busto, C.; Masson, G.; Bosch, E.; Jäger-Waldau, A. True Cost of Solar Hydrogen. Sol. RRL 2022, 6, 2100487. [Google Scholar] [CrossRef]
- Nguyen, T.; Abdin, Z.; Holm, T.; Mérida, W. Grid-connected hydrogen production via large-scale water electrolysis. Energy Convers. Manag. 2019, 200, 112108. [Google Scholar] [CrossRef]
- Gusain, D.; Cvetković, M.; Bentvelsen, R.; Palensky, P. Technical Assessment of Large Scale PEM Electrolyzers as Flexibility Service Providers. In Proceedings of the 2020 IEEE 29th International Symposium on Industrial Electronics (ISIE), Delft, The Netherlands, 17–19 June 2020; pp. 1074–1078. [Google Scholar] [CrossRef]
- Partidário, P.; Aguiar, R.; Martins, P.; Rangel, C.M.; Cabrita, I. The hydrogen roadmap in the Portuguese energy system–Developing the P2G case. Int. J. Hydrog. Energy 2020, 45, 25646–25657. [Google Scholar] [CrossRef]
- A Framework Strategy for a Resilient Energy Union with a Forward-Looking Climate Change Policy, Communication from the Commission to the European Parliament, the Council, the European Economic and Social Committee, the Committee of the Regions and the European Investment Bank, Brussels, 25 February 2015. Available online: https://eur-lex.europa.eu/legal-content/EN/TXT/?uri=COM:2015:80:FIN (accessed on 10 February 2024).
- European Commission. National Energy and Climate Plans, EU Countries’ 10-Year National Energy and Climate Plans for 2021–2030. Available online: https://commission.europa.eu/energy-climate-change-environment/implementation-eu-countries/energy-and-climate-governance-and-reporting/national-energy-and-climate-plans_en (accessed on 25 January 2024).
- A Hydrogen Strategy for a Climate-Neutral Europe. Communication from the Commission to the European Parliament, the Council, the European Economic and Social Committee and the Committee of the Regions, Brussels, 8/7/2020. Available online: https://ec.europa.eu/energy/sites/ener/files/hydrogen_strategy.pdf (accessed on 25 January 2024).
- REPowerEU Plan. Communication from the Commission to the European Parliament, the European Council, the Council, the European Economic and Social Committee and the Committee of the Regions, Brussels, 18/5/2022. Available online: https://eur-lex.europa.eu/legal-content/EN/TXT/?uri=COM%3A2022%3A230%3AFIN&qid=1653033742483 (accessed on 10 March 2024).
- National Strategy for Hydrogen. Resolução do Conselho de Ministros n° 63/2020 de 14 de Agosto. Portuguese. Available online: https://dre.pt/application/conteudo/140346286 (accessed on 25 January 2024).
- Lund, H.; Thellufsen, J.Z.; Østergaard, P.A.; Sorknæs, P.; Skov, I.R.; Mathiesen, B.V. EnergyPLAN–Advanced Analysis of Smart Energy Systems. Smart Energy 2021, 1, 100007. [Google Scholar] [CrossRef]
- Østergaard, P.A.; Lund, H.; Thellufsen, J.Z.; Sorknæs, P.; Mathiesen, B.V. Review and validation of EnergyPLAN. Renew. Sustain. Energy Rev. 2022, 168, 112724. [Google Scholar] [CrossRef]
- Lund, H. Large-scale integration of optimal combinations of PV, wind and wave power into the electricity supply. Renew. Energy 2006, 31, 503–515. [Google Scholar] [CrossRef]
- Lund, H.; Kempton, W. Integration of renewable energy into the transport and electricity sectors through V2G. Energy Policy 2008, 36, 3578–8357. [Google Scholar] [CrossRef]
- Connolly, D.; Lund, H.; Mathiesen, B.V.; Leahy, M. The first step towards a 100% renewable energy-system for Ireland. Appl. Energy 2011, 88, 502–507. [Google Scholar] [CrossRef]
- Cosic, B.; Krajacic, G.; Duic, N. A 100% renewable energy system in the year 2050: The case of Macedonia. Energy 2012, 48, 80–87. [Google Scholar] [CrossRef]
- Connolly, D.; Lund, H.; Mathiesen, B.V. Smart Energy Europe: The technical and economic impact of one potential 100% renewable energy scenario for the European Union. Renew. Sustain. Energy Rev. 2016, 60, 1634–1653. [Google Scholar] [CrossRef]
- Figueiredo, R.; Nunes, P.; Meireles, M.; Madaleno, M.; Brito, M.C. Replacing coal-fired power plants by photovoltaics in the Portuguese electricity system. J. Clean. Prod. 2019, 222, 129–142. [Google Scholar] [CrossRef]
- Ramos, R.; Castro, R. Modeling Renewable Energy Integration in the 2030 Portuguese Power System: The Role of Energy Storage. J. Electrochem. Energy Convers. Storage 2020, 170, 11013. [Google Scholar] [CrossRef]
- Nunes, P.; Brito, M.C. Displacing natural gas with electric vehicles for grid stabilization. Energy 2017, 141, 87–96. [Google Scholar] [CrossRef]
- Gomes, J.G.; Pinto, J.M.; Xu, H.; Zhao, C.; Hashim, H. Modeling and planning of the electricity energy system with a high share of renewable supply for Portugal. Energy 2020, 211, 118713. [Google Scholar] [CrossRef]
- Lopez, V.A.M.; Ziar, H.; Haverkort, J.W.; Zeman, M.; Isabella, O. Dynamic operation of water electrolyzers: A review for applications in photovoltaic systems integration. Renew. Sustain. Energy Rev. 2023, 182, 113407. [Google Scholar] [CrossRef]
- Stansberry, J.; Mejia, A.H.; Zhao, L.; Brouwer, J. Experimental analysis of photovoltaic integration with a proton exchange membrane electrolysis system for power-to-gas. Int. J. Hydrog. Energy 2017, 42, 30569–30583. [Google Scholar] [CrossRef]
- EU Reference Scenario. Available online: https://energy.ec.europa.eu/data-and-analysis/energy-modelling/eu-reference-scenario-2020_en (accessed on 10 February 2024).
- Christensen, A. Assessment of Hydrogen Production Costs from Electrolysis: United States and Europe. In Proceedings of the International Council on Clean Transportation, Washington, DC, USA, 16 November 2020; pp. 1–73. [Google Scholar]
- Direção Geral de Energia e Geologia. Monthly Statistics on Renewables. Portuguese. Available online: https://www.dgeg.gov.pt/pt/estatistica/energia/publicacoes/estatisticas-rapidas-das-renovaveis/ (accessed on 10 February 2024).
- Redes Energéticas Nacionais. REN Data Hub. Available online: https://datahub.ren.pt/en/electricity/daily-balance/ (accessed on 10 February 2024).
- MIBEL. Mercado Ibérico de Eletricidade (Iberian Electricity Market). Available online: https://www.omip.pt/pt/dados-mercado?date=2020-07-08&product=EL&zone=ES&instrument=FTB (accessed on 1 September 2023).
- ERSE. Tariffs and Prices for Electric Energy and Other Services. December 2019; See Tables 4–6, 4–15 and Chapter 7.2. Available online: https://www.erse.pt/media/xcwb23n2/tarifaspre%C3%A7os2020.pdf (accessed on 10 February 2024).
- Águas de Santo André, Prices to Industrial Customers. Portuguese. Available online: https://www.adsa.pt/clientes-industriais/ (accessed on 1 September 2023).
- Tang, O.; Rehme, J.; Cerin, P. Levelized cost of hydrogen for refueling stations with solar PV and wind in Sweden: On-grid or off-grid? Energy 2022, 241, 122906. [Google Scholar] [CrossRef]
- IRENA. Green Hydrogen Cost Reduction: Scaling up Electrolysers to Meet the 1.5 C Climate Goal; IRENA Technical Report; IRENA: Abu Dhabi, United Arab Emirates, 2020. [Google Scholar]
- IRENA. Global Hydrogen Trade to Meet the 1.5 °C Climate Goal: Part III–Green Hydrogen Cost and Potential; International Renewable Energy Agency: Abu Dhabi, United Arab Emirates, 2022. [Google Scholar]
- European Hydrogen Observatory. Levelised Cost of Hydrogen Calculator. Available online: https://observatory.clean-hydrogen.europa.eu/tools-reports/levelised-cost-hydrogen-calculator (accessed on 25 January 2024).
- Hydrogen Europe. Clean Hydrogen Monitor 2023; Hydrogen Europe: Brussels, Belgium, 2023. [Google Scholar]
- International Renewable Energy Agency. LCOH Scenario Viewer. Available online: https://lcoh.irena.org/ (accessed on 25 January 2024).
- Simões, S.G.; Catarino, J.; Picado, A.; Lopes, T.F.; di Berardino, S.; Amorim, F.; Gírio, F.; Rangel, C.M.; Leão, T.P. Water availability and water usage solutions for electrolysis in hydrogen production. J. Clean. Prod. 2021, 315, 128124. [Google Scholar] [CrossRef]
- European Environment Agency. Seasonal Water Scarcity Conditions across Europe, Measured by the Water Exploitation Index Plus (WEI+) for Sub River Basins. 2019. Available online: https://www.eea.europa.eu/data-and-maps/figures/seasonal-water-exploitation-index-plus-4 (accessed on 25 January 2024).
- Climate Adapt. Water Scarcity Conditions in Europe (Water Exploitation Index Plus). Available online: https://climate-adapt.eea.europa.eu/en/metadata/indicators/water-scarcity-conditions-in-europe-water-exploitation-index-plus#:~:text=The%20WEI%2B%20is%20a%20water%20scarcity%20indicator%20that,areas%20that%20are%20prone%20to%20water%20stress%20problems (accessed on 25 January 2024).
- Clean Hydrogen Partnership. Hydrogen Valleys. Available online: https://h2v.eu/hydrogen-valleys (accessed on 18 March 2024).
Figure 1.
Schematic diagram of the hydrogen production plant and associated power sources. The dashed line marks the boundaries of the system; green arrows represent the electricity fluxes from the dedicated renewable power to the electrolyser; the red arrow represents electricity imports from the grid; orange arrows show electricity exports; blue arrows represent hydrogen fluxes.

Figure 2.
Load diagrams for periods of one week for different modes of operation of a 1 GW electrolyser: (a) constant load operation with 2 GW of solar PV; (b) constant load operation with 1 GW of wind power; (c) autonomous mode with 2 GW of solar PV; (d) autonomous mode with 1 GW of wind power; (e) grid-assisted operation with 2 GW of solar PV; (f) grid-assisted operation with 1 GW of solar PV and 1 GW of wind power.

Figure 3.
The number of competitive options out of the 72 configurations analysed in this study, as a function of the discount rate applied to the project. Competitive options are those with an LCOH lower than 2.67 EUR/kg. In (a), the competitive options are displayed according to technical configuration and in (b) they are displayed according to the operation mode.

Figure 4.
LCOH as a function of the total annual hydrogen production of all configurations considered in this study with a discount rate of 6%. The shaded area represents the range of LCOH values for grey hydrogen, projected for 2030.
Figure 4.
LCOH as a function of the total annual hydrogen production of all configurations considered in this study with a discount rate of 6%. The shaded area represents the range of LCOH values for grey hydrogen, projected for 2030.

Figure 5.
Costs composition for different electrolyser operation modes at a discount rate of 6%. The configurations are ordered from left to right by decreasing value of utility. (a) Constant load operation; (b) autonomous operation; (c) grid-assisted operation; (d) the 10 configurations with higher utility for the 72 configurations in this study (C stands for constant mode; A stands for autonomous mode; G stands for grid-assisted mode).

Figure 6.
Spider graphs for the ten configurations with the higher value of utility of each electrolyser operating mode. Graphs display exports to and imports from the national electricity grid, the LCOE produced at the facility, the capacity factor of the electrolyser, and the water consumption of the electrolyser, based on the stoichiometric conversion of water into molecular hydrogen, compared to water consumption in the Sines municipality.


Table 1.
Characteristic equivalent full-load hours (EFLH) for solar PV and wind in sunny and windy years.
Table 1.
Characteristic equivalent full-load hours (EFLH) for solar PV and wind in sunny and windy years.
| Renewable Technology | Weather Condition | Equivalent Full-Load Hours |
|---|---|---|
| Solar PV | Sunny | 1701 |
| Solar PV | Windy | 1595 |
| Wind | Sunny | 2296 |
| Wind | Windy | 2450 |
Table 2.
Description of the conditions used for each mode of operation of the electrolyser.
| Mode of Operation | Nominal Capacity (GW) | Electrolyser Input Power | Exchanges with Electricity Grid | ||
|---|---|---|---|---|---|
| Solar PV | Wind | Electrolyser | |||
| Constant load | 0–3 | 0–3 | 1 | Constant 0.5 PN and 0.8 PN | imports and exports |
| Autonomous | 0–3 | 0–3 | 0.5–1.5 | variable | exports only |
| Grid-assisted | 0–3 | 0–3 | 0.5–1.5 | variable | imports and exports |
Table 3.
CAPEX and O&M values. Cost figures refer to 2020.
| CAPEX | CAPEX | O&M Costs | Lifetime | |
|---|---|---|---|---|
| 2030 | 2040 | % of Annualised CAPEX | ||
| PEM electrolyser | 603,000 EUR/MW | 367,000 EUR/MW | 3.2% | 50,000 h |
| Solar PV | 368,800 EUR/MW | - | 2.3% | 25 years |
| Wind | 1,003,000 EUR/MW | - | 1.2% | 25 years |
| Hydrogen storage | 4660 EUR/MWh | - | 0.02% | 25 years |
Table 4.
Variable costs. Cost figures refer to 2020.
| Variable Costs | |
|---|---|
| Price of electricity imports | 37.05 EUR/MWh |
| Average tariff on access to electricity grid | 26.34 EUR/MWh |
| Price of electricity exports | LCOE up to a maximum of 37.05 EUR/MWh |
| Tariff for injection in the transmission grid | 0.56 EUR/MWh |
| Price of water (drinking quality) | 2.04 EUR/m3 |
| Water grid access tariff | 21,300 EUR/year |
Disclaimer/Publisher’s Note: The statements, opinions and data contained in all publications are solely those of the individual author(s) and contributor(s) and not of MDPI and/or the editor(s). MDPI and/or the editor(s) disclaim responsibility for any injury to people or property resulting from any ideas, methods, instructions or products referred to in the content. |
© 2024 by the authors. Licensee MDPI, Basel, Switzerland. This article is an open access article distributed under the terms and conditions of the Creative Commons Attribution (CC BY) license (https://creativecommons.org/licenses/by/4.0/).
Share and Cite
MDPI and ACS Style
Borges, R.P.; Franco, F.; Serralha, F.N.; Cabrita, I. Green Hydrogen Production at the Gigawatt Scale in Portugal: A Technical and Economic Evaluation. Energies 2024, 17, 1638. https://doi.org/10.3390/en17071638
AMA Style
Borges RP, Franco F, Serralha FN, Cabrita I. Green Hydrogen Production at the Gigawatt Scale in Portugal: A Technical and Economic Evaluation. Energies. 2024; 17(7):1638. https://doi.org/10.3390/en17071638
Chicago/Turabian StyleBorges, Rui P., Flávia Franco, Fátima N. Serralha, and Isabel Cabrita. 2024. "Green Hydrogen Production at the Gigawatt Scale in Portugal: A Technical and Economic Evaluation" Energies 17, no. 7: 1638. https://doi.org/10.3390/en17071638
Note that from the first issue of 2016, this journal uses article numbers instead of page numbers. See further details here.