
Research on the Calculation Method for the Load Distribution of the Dual-Input Counter-Rotating Transmission System

State Key Laboratory of Mechanical Transmission, Chongqing University, Chongqing 400044, China
*
Author to whom correspondence should be addressed.
Appl. Sci. 2024, 14(7), 2899; https://doi.org/10.3390/app14072899
Submission received: 4 March 2024
/
Revised: 25 March 2024
/
Accepted: 27 March 2024
/
Published: 29 March 2024
Abstract
:In order to solve the problem of an uneven load distribution in a double-input and double-output gearbox, based on the small-displacement Jacobi spin theory and considering the manufacturing and assembly errors of the gearbox, a Jacobi spin analysis model of the gearbox was established. In order to improve the accuracy of the three-dimensional tolerance analysis of the gearbox, on the basis of the processing method of parallel chain of gears and shafts and box and shafts, the serialization method of parallel chain of meshing gear pairs is proposed, and the gearbox was established. For the three-dimensional tolerance analysis model, three-dimensional tolerance analysis was carried out on the side-clearance dimensions of double-input and double-output gearboxes, and the side clearance values under the extreme value method and Monte Carlo method were deduced and combined with the theoretical side clearance to obtain the range of the side clearance of the gearboxes. Elastic deflection analysis was carried out on the gearbox shaft system, and the compensation relationship between the elastic deflection and the side clearance was investigated, so as to calculate the range of the value of the gearbox uniform load coefficient from 1 to 1.259. The error between the theoretically calculated uniform load coefficient and the experimentally tested uniform load coefficient was 6.61%, which verifies the reasonableness of the load distribution method of double-input and double-output gearboxes calculated using three-dimensional tolerance analysis combined with the elastic deflection angle, and provides a theoretical basis for the optimal design of the uniform load of multi-branch input gearboxes.
1. Introduction
A counter-rotating output transmission system which adopts a power shunt when transmitting power can meet the requirements of high-speed and heavy-duty working conditions with a small volume and mass, and this system is widely used in helicopters, torpedoes, underwater unmanned boats, and aviation. For redundancy and safety, multiple inputs and multiple-branch shunt-convergence drives are generally used. However, due to the inevitable manufacturing and installation errors of the gear system, as well as the influence of factors such as the deformation of the moving components, the gap size between each branch and the output gear is inconsistent, resulting in an uneven distribution of the load transmitted by each branch, which seriously affects the power density and reliability of the transmission system. The size of the torsional stiffness of each branch is also an important factor affecting the load distribution. Therefore, it is important to study the matching relationship between the clearance and the torsional stiffness of each branch gear and optimize the corresponding parameters to reduce the unevenness of the load distribution of each branch and improve the reliability of the transmission system.
To determine how to allocate the side clearance of the gearbox with the stiffness of each branch to obtain a reasonable load distribution coefficient, scholars around the world have performed a large amount of research in this area.
- (1)
- Calculation of load distribution based on hydrostatic gear split-torsion transmission
Krantz et al. [1,2] conducted a theoretical analysis and experimental study on the load distribution of a gear split-torsion transmission system under a static load using a synchronous angular load equalization design method without any load equalization device. Gmirya and Leigh [3,4] conducted a hydrostatic study on the equal load problem of multi-branch power-shunt reducers and derived equal load coefficients satisfying the prevailing manufacturing and installation conditions. Hao et al. [5,6] investigated the static mean load characteristics of gear shunt drive wheel systems with different structures based on deformation coordination conditions using the concentrated parameter theory. Li and Jin [7,8,9] investigated the effects of the error, torsional stiffness, and standoff stiffness on the static load matching performance of multi-branch gearing systems.
- (2)
- Optimization of the load-equalization performance of a gear split-torsion transmission system based on a flexible shaft device
Isabelle et al. [10] proposed the use of elastic devices, such as elastic torsion shafts and rectangular elastic pads, to optimize the load distribution in gear shunt transmission systems. White [11] proposed the design method of nesting a flexible shaft inside a duplex shaft, which resulted in a better load equalization performance of the system. Gmirya et al. [12,13] used a flexible shaft device in a multi-branch gear shunt transmission system and conducted a static and dynamic experimental study on the load equalization performance of the multi-branch transmission system. Gui et al. [14] studied the equal load characteristics of the elastic torsion shaft system for a dual-input gear split transmission system and proposed a calculation method for the torsional stiffness of the elastic torsion shaft and the transmission error of the system. Hu [15] studied the equal load characteristics of a dual-branch gear transmission system and proposed optimization measures for the flexibility of the wheel spokes and the support shaft.
- (3)
- Analysis of gearbox backlash based on three-dimensional tolerance
The three-dimensional tolerance analysis model of Jacobian-torsor takes the backlash at the output end of the gearbox as the demand dimension and the other errors affecting the backlash as the constituent ring dimensions, which are calculated with the matrix method to avoid the complex derivation of geometric relationships. Desrochers et al. [16] proposed a three-dimensional tolerance analysis model based on small displacement torsor (SDT) theory and a Jacobian matrix for characterizing the dimensional and form tolerances in geometries. In Amda et al. [17], three-dimensional tolerance analysis methods in product design were studied. In Liu [18], a dummy functional unit approach was proposed to simplify parallel chains by integrating tolerance information into the torque parameter of a specified dummy functional unit. Laperrière et al. [19] developed a Jacobian-torsor volume tolerance analysis model based on the interval algorithm, which could perform tolerance analysis based on the extreme value method and statistical methods. Zuo [20] developed an error propagation model based on the Jacobian-torsor theory. Weihua et al. [21,22,23] proposed a contact analysis method for the rapid determination of the gear-drive clearance based on the Jacobian-torsor model and the Monte Carlo simulation technique.
The existence of local parallel chains in the process of gear backlash analysis affects the accuracy of backlash analysis. Zeng et al. [24] compared the analytical results of spiral bevel gearboxes with and without partial parallel chains and proved that the effect of partial parallelism on the resolution accuracy was not negligible. The authors of [25,26,27,28,29] studied linear construction and parallel construction methods and proposed a probabilistic approach using a connected assembly model without considering partial parallel effects. Jin et al. [30] studied a method to solve the partial parallel chain problem caused by deterministic deviations and established a generalized deviation propagation formulation for n-level component assembly. Chen et al. [31,32,33] proposed the spin measure model to transform parallel chains into serial chain tolerances with complex algebraic operations. Zeng [34] proposed the use of the geometric structure leverage effect and combined the advantages of the CLIC (an acronym for “localization tolerancing with contact influence”) method and the analytical line method to generate new serial chain tolerances.
The current methods for calculating the load distribution based on static and elastic shaft structures do not take into account the effect of tolerance zones on the gear backlash distribution or three-dimensional tolerance analysis for parallel shafts, and there has been less research on multi-branch split-torsion transmission. The dual-input counter-rotating drive system has a complex structure and many factors affect the load distribution. In this research, we consider the effects of the backlash and elastic shaft torsional stiffness on the equal load performance at the output of two branches of the dual-input-to-rotation transmission system, and we establish a three-dimensional tolerance Monte Carlo analysis model of gear backlash based on the small displacement torsor theory and Jacobian matrix. The method of local parallel chain theory of gearbox meshing tooth pairs is proposed, and the calculation method of an elastic deflection angle and an equal load coefficient of the gearbox is combined with the theory of the elastic torsional deformation of the shaft system. The side clearance and the range of the equal load coefficient are calculated for the dual-input counter-rotating gearbox, and they are then verified through tests and proposed measures to optimize the equal load performance of the system.
2. Calculation Method of Gear Backlash Based on Jacobian–Torsor Theory
2.1. Analytical Model of Jacobian–Torsor Based on SDT Theory
The basic concept of SDT theory is to consider the geometric defects of features as a result of the motion of a three-dimensional Euclidean space point set and to represent the spatial motion of points with tiny vectors. As a tolerance expression model, SDT theory characterizes the actual variation of the key geometric features of a part with respect to the ideal posture using three translational components and three rotational components, and the theory can also characterize the variation in the gap between the key geometric features of a part in an assembly. The tolerance expression is as follows:
where are the ideal geometric features of the translation along the X, Y, and Z coordinate axes, respectively; and are the rotation of the ideal geometric features along the X, Y, and Z coordinate axes, respectively.
A detailed list of SDT models with various characteristics is given in the literature [34].
The Jacobian model can accurately transfer the robot’s joint variations to the end, and the 3D deviation of the actual features in the assembly from the ideal position can be perfectly transferred to the functional requirements (FRs) of the assembly with the help of the Jacobian model. With the help of SDT to represent each characteristic deviation, the Jacobian matrix is introduced into the tolerance transfer model to establish the Jacobian-torsor model for three-dimensional tolerance analysis, whose expression is shown in Equation (2). Each functional element of the part layer in the Jacobian-torsor model has a corresponding coordinate system: 0 is the closed-loop element, i denotes the i-th functional element in the tolerance transfer chain, (i = 1, 2, …, n), and n is the last functional element.
where is the Jacobian matrix of tolerances, is the small displacement torsor of the functional requirements elements, and is the amount of small displacement torsor associated with the i-th functional element.
According to SDT theory, the tolerance band can be expressed in a matrix form as follows:
When the constituent tolerance zone is skewed with respect to the direction of tolerance analysis, it is necessary to project this tolerance zone in the direction of tolerance analysis, whose axis direction must coincide with or be parallel to the reference coordinate axis. To obtain a projection of the tolerance band, the change in the tilt of the tolerance band with respect to the basic reference system must be applied to the translational and rotational torsor of the tolerance band. denotes the translational small displacement torsor, and denotes the rotational small displacement torsor. The expressions for the projected torsor of the tolerance band are as follows:
where denotes the inconsistency coefficient of the tolerance analysis direction with respect to the i-coordinate system, with the columns designating the unit vectors along axes Xi, Yi, and Zi, respectively, for the tolerance zone tilted according to the direction to be analyzed in reference mark i. The final expression of the small displacement torsor associated with the i-th functional element is as follows:
The Jacobian matrix represents the transformation relationship between the requirement elements of the assembly and the functional elements of the part level, given as
where is the directional transformation matrix between coordinate systems, is the transformation matrix of the positions between coordinate systems, and is the matrix that is corrected for the spatial location to overcome the leverage effect.
represents the directional change of the i-coordinate system with respect to the zero-coordinate system, and its expression is as follows:
where are the direction vectors of the axes , respectively, in the 0th coordinate system.
is the change in position of the n-coordinate system relative to the i-coordinate system, given as
where and are the X-values, and are the Y-values, and and are the Z-values of the origin of the i, n coordinate system in the 0 coordinate system.
2.2. Three-Dimensional Tolerance Analysis Parallel Chain Serialization Method
Two or more assembly positioning nodes exist for inter-part assembly positioning, which constitutes a parallel chain. According to the type of benchmark, parallel chains can be divided into two categories: multiple benchmarks and common benchmarks. Multiple datums and common datums are used as criteria for classifying parallel chains. Multiple datums are based on the spatial degree of freedom restrictions on the part features from mutually independent coordinate systems, while common datums are based on spatial degrees of freedom restrictions on part features from mutually coupled coordinate systems.
Multi-basis parallel chains are commonly found in contact pairs formed between two surfaces, where cylindrical nodes combined with planar nodes are the most common type. When a key connection or a clearance fit is used between the gear and the shaft, a chain of parallel tolerances similar to the hole-pin is formed, and the partial parallel chain is calculated with the parallel or intersection operation [31].
The parallel dimensional chain with the geometric tolerance datum in the dimensional chain is the common datum. The tolerance of the two contact surfaces can no longer take the serial chain operation method due to the existence of the leverage effect, and to eliminate the influence of the geometric structure leverage effect on part of the parallel chain, the advantages of the CLIC method and the analytical line method are integrated to transform the parallel chain into the new serial chain tolerance [24].
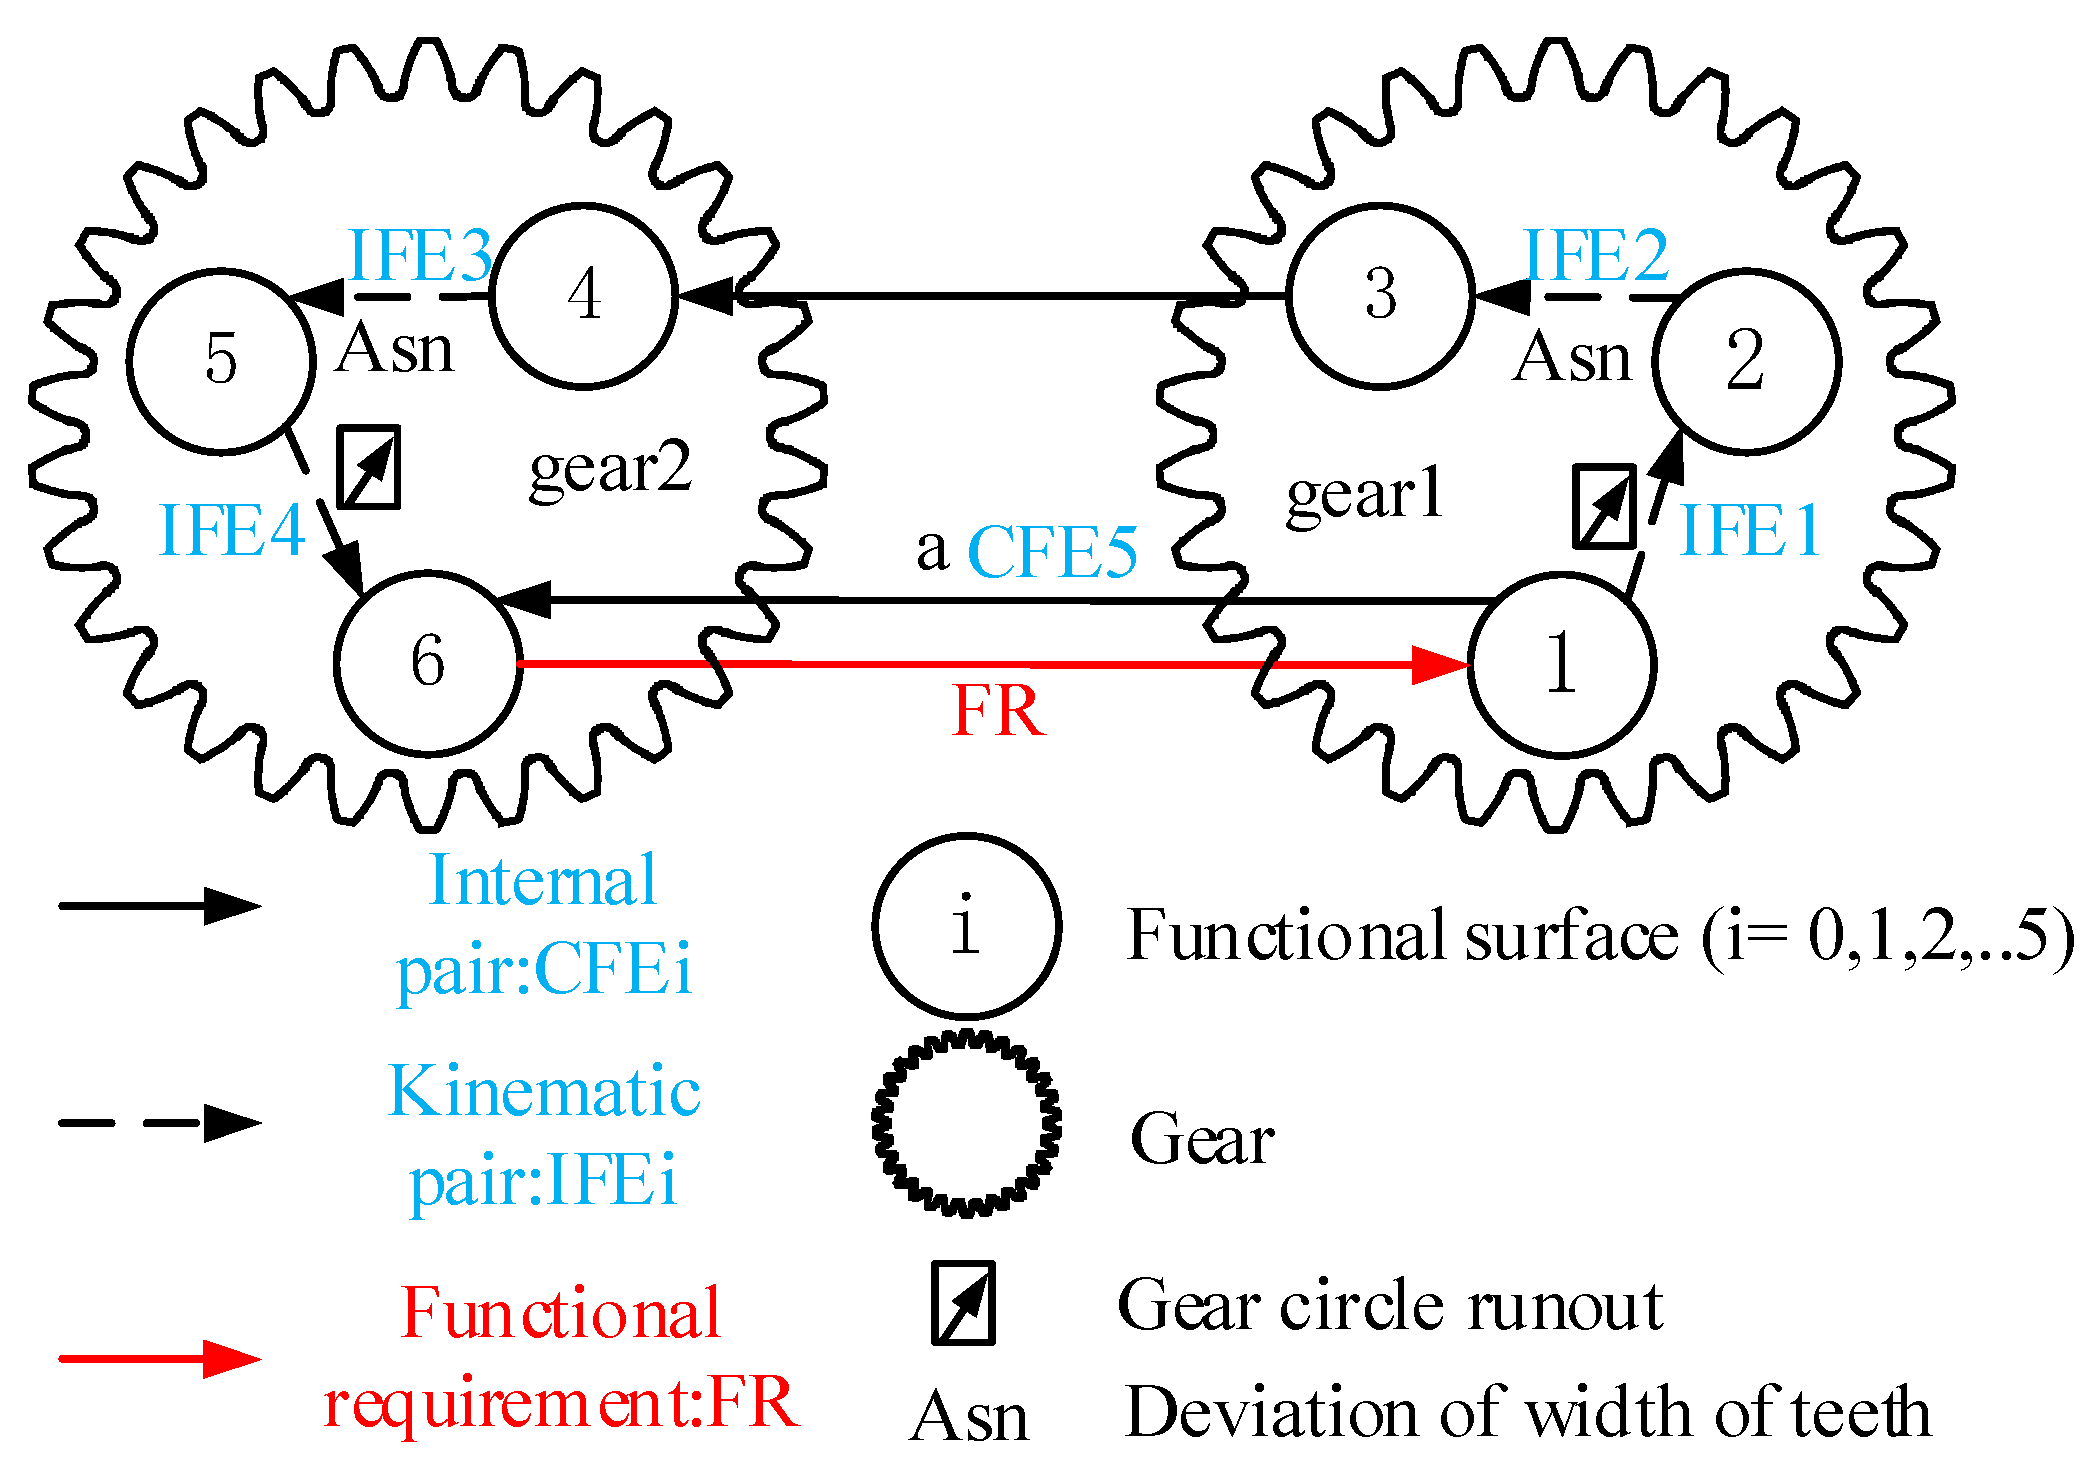
When a pair of gears meshes, with the active shaft axis as the positioning reference, there is a relative offset between the drive shaft axis and the active shaft axis, and the offset of the center distance tolerance causes the gears on the shaft to also be offset. The offset makes the gears misaligned and there is a local parallel chain between the main serial chain and the center distance tolerance; the dimensional chain is shown in Figure 1. Directly superimposing the center distance tolerance on the gear tolerance will increase the error. The center distance tolerance can be equated to the gear tooth thickness manufacturing deviation through the geometric relationship, which is shown in Figure 1.
IFE3 in Figure 1 represents the tooth thickness deviation of gear 2, given by
CFE5 indicates the center distance deviation of the two gears, given by
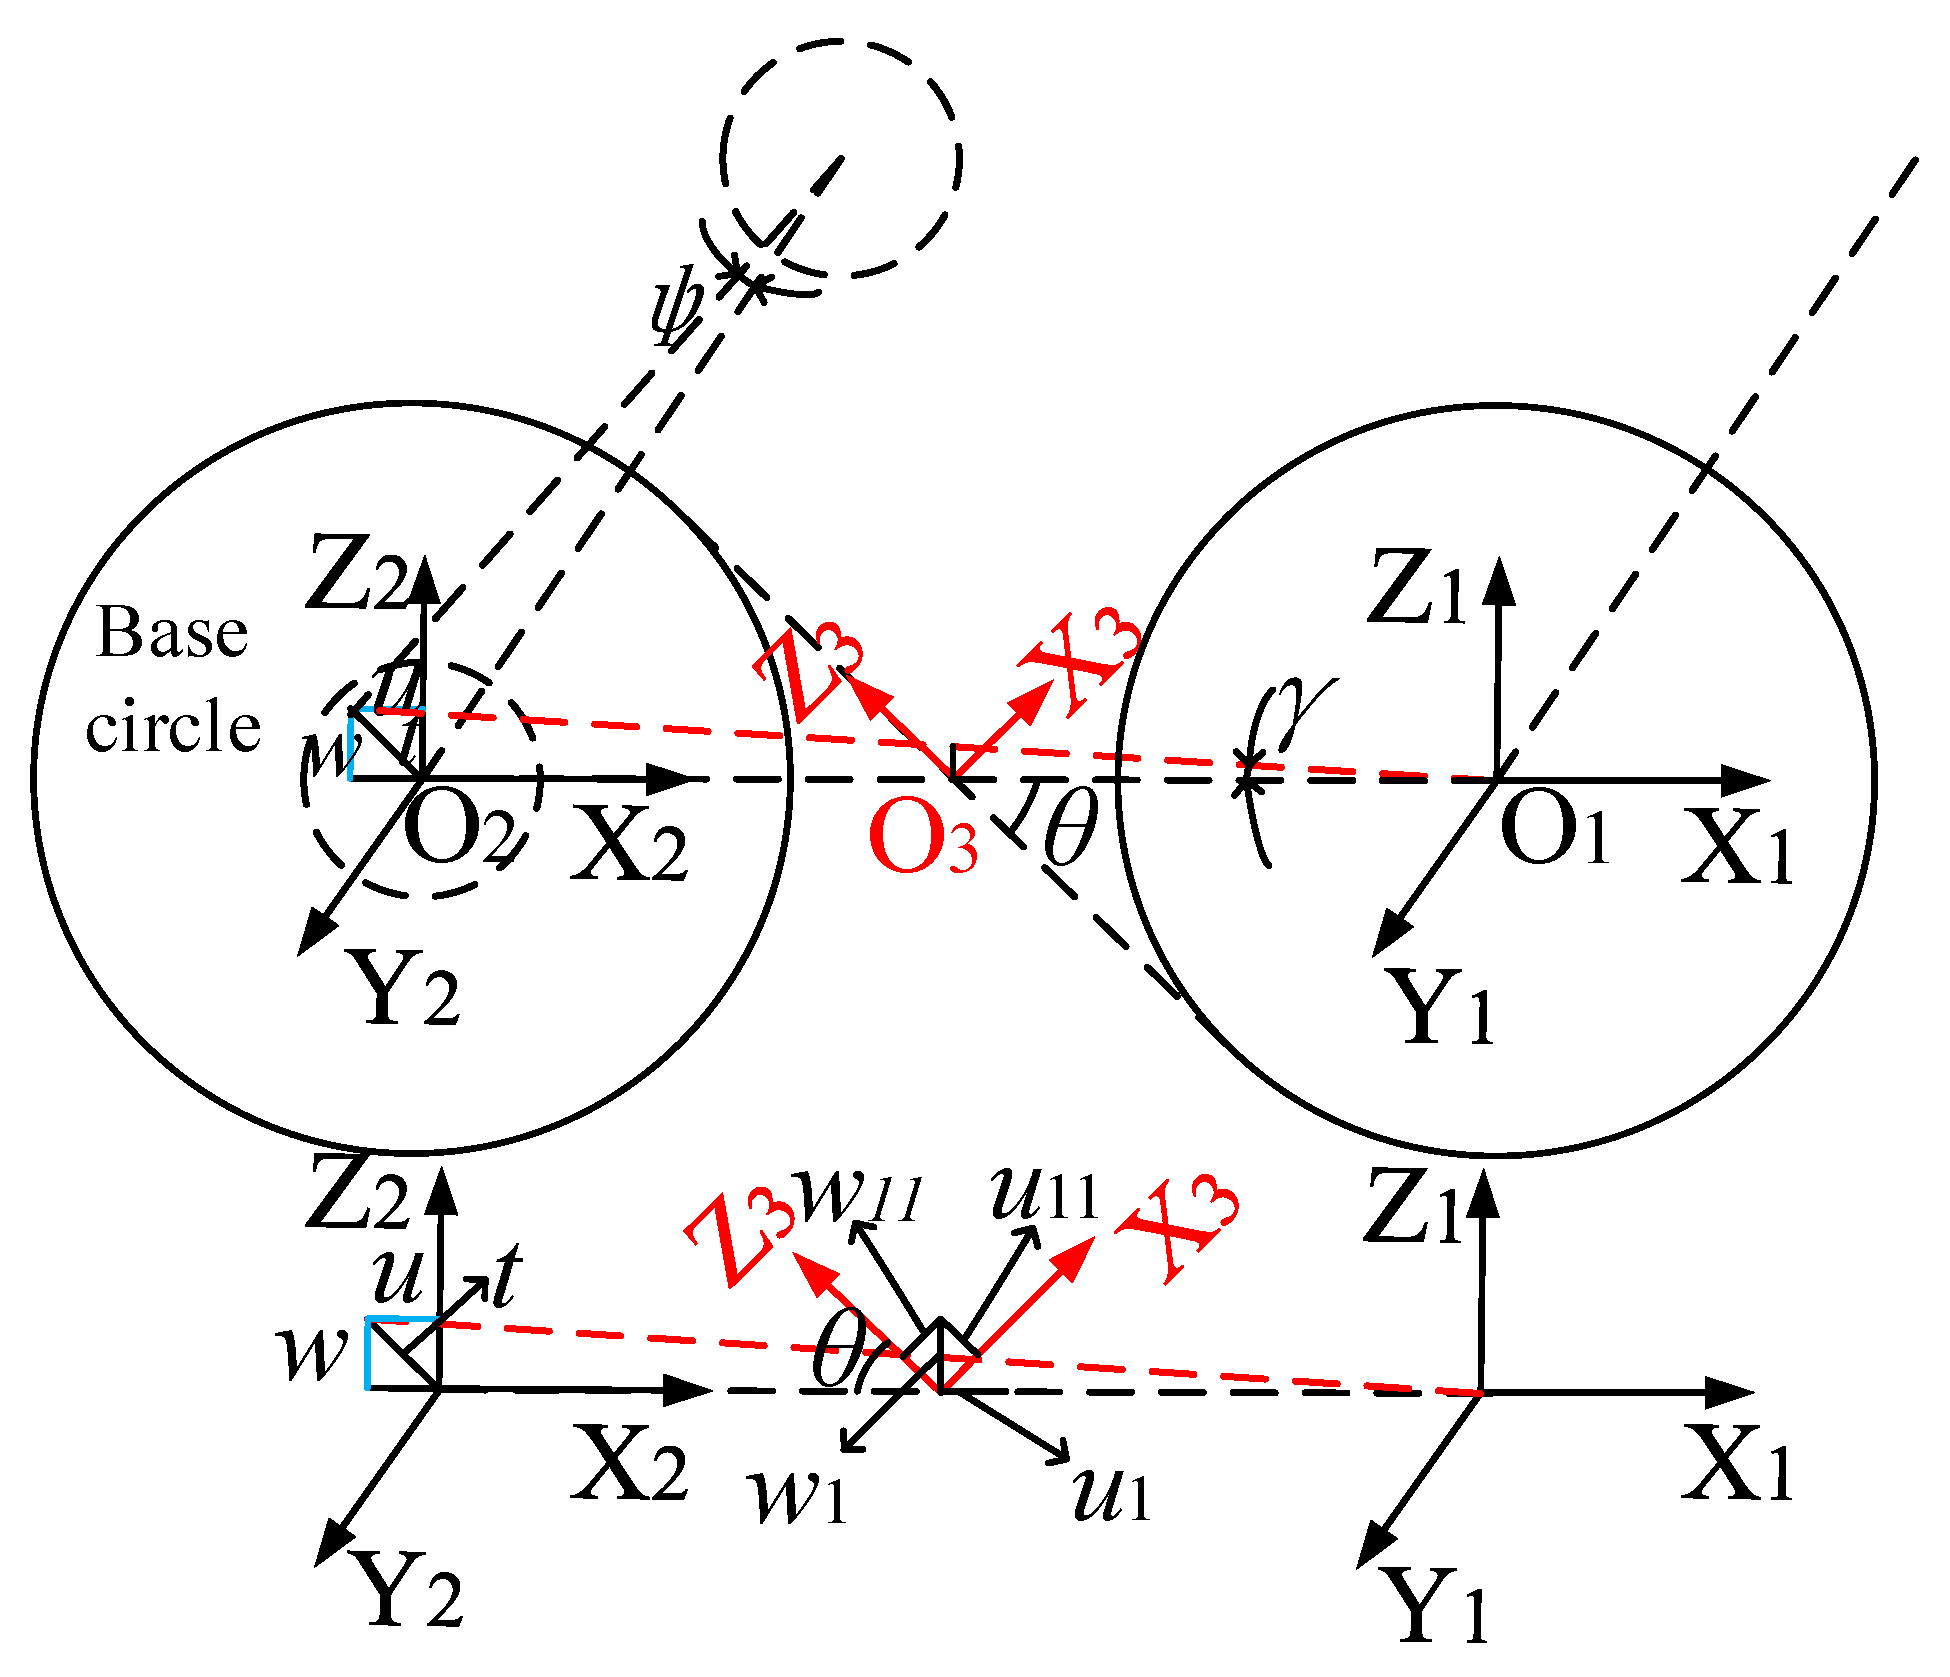
In Figure 2, t is the center distance deviation, and are the displacement components of the center distance deviation, is the displacement component of the center distance deviation at the point of engagement, and are the displacement components of the center distance deviation on the engagement line, and and are the rotational components of the center distance deviation. O1O3 is the length of the pitch circle radius of gear 1, which is denoted by , and O2O3 is the length of the pitch circle radius of gear 2, which is denoted as , the length of O1O2 is the central distance and is denoted as , and θ is the mesh angle of the two gears, which can be expressed as the radius of the base circle and the radius of the indexing circle of gear 1.
The deviation of the center distance of the two gears is in the same direction as the rotational component of the tooth thickness deviation of gear 2 and can be algebraically superimposed. The displacement component of the center distance deviation needs to be translated to the meshing line with the geometric relationship and then algebraically superimposed with the displacement component of the gear 2 tooth thickness deviation. For and , as shown in Equations (12) and (13), after converting the center distance deviation to the gear 2 tooth thickness deviation, the tolerance torsor is IFE3′, as shown in Equation (14).
After the transformation, the center distance deviation CFE5 and the tooth thickness deviation IFE3 form a new tolerance torsor IFE3′, the coordinates of which coincide with those of IFE3.
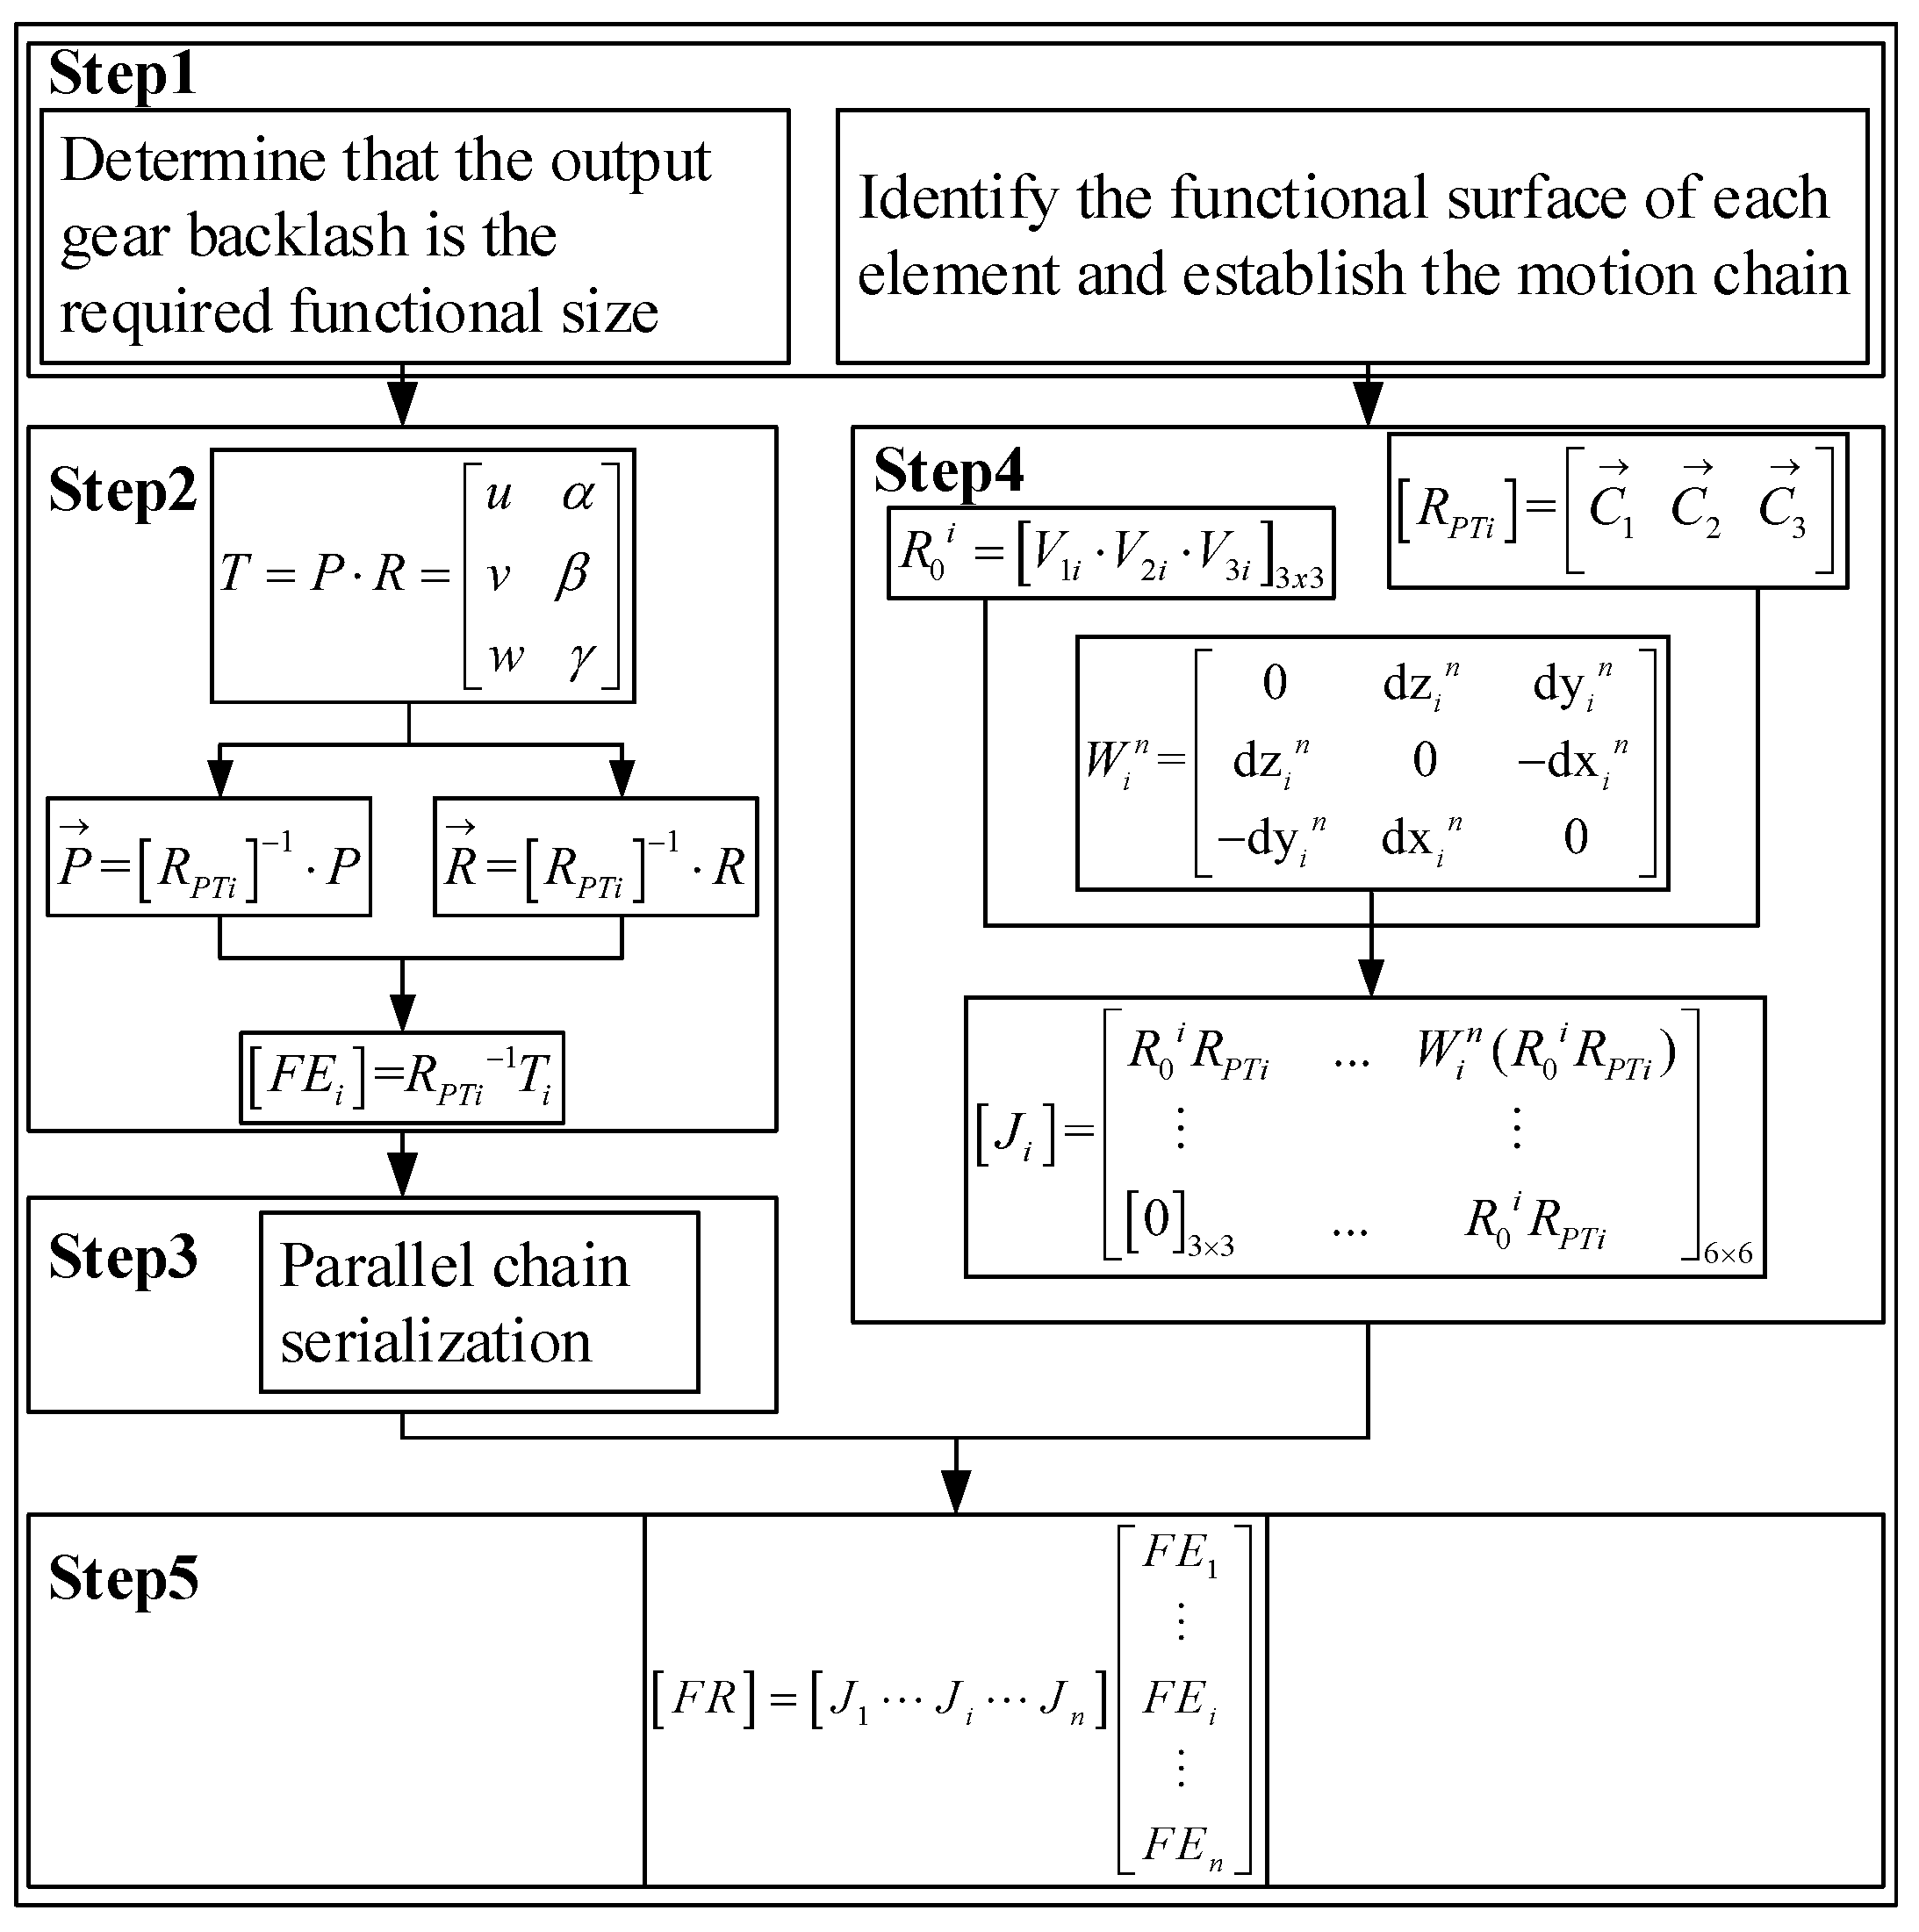
The gearbox is composed of main parts such as the drive shaft, gear, bearing, and box. For a gear transmission system with a known transmission structure, the three-dimensional tolerance analysis of the gearbox backlash is as shown in Figure 3.
3. Condition of Backlash Distribution of Dual-Input Counter-Rotating Gearbox
The dual-input counter-rotating gearbox is symmetrical from left to right. The parameters are shown in Table 1. Taking the bearing seat axis of output shaft 1 as the positioning reference, and the backlash between Gd1, Gd2, and Go1 as the functional requirement FRi, and each element tolerance torsor as FEi, serializing the parallel chain is established for the Jacobian-torsor model of the gearbox, the distribution of the gearbox can be calculated, and the distribution of the gearbox backlash is calculated.
The tooth thickness deviation parameter shows that the theoretical backlash at the engagement of Gd1 and Gd2 with Go1 is 0.2443 mm.
3.1. Structural Analysis of Dual-Input Counter-Rotating Gearbox
A multi-branch shunt drive system adopts the method of a fixed shaft drive to achieve a power shunt, and a multi-branch input, so that the load of each branch is only part of the original load, thus greatly reducing the volume and weight of the wheel. A multi -branch drive system has a certain fault tolerance. When one of the branches is damaged, the other branches can still maintain the normal operation of the system, which improves the reliability of the drive system.
Due to the existence of these errors, the backlashes between the multi-branch gears and the output gears are not equal, resulting in an uneven distribution of the system’s load. To study the system’s load equalization performance, the backlash distribution of each branch is calculated with the system errors, and thus the system load equalization factor is calculated.
The three-dimensional tolerance analysis model based on a Jacobian-torsor can consider the coupling of various errors in gearboxes well, avoiding the derivation of complex geometric relationships. The small displacement torsor and matrix are used to represent the tolerance of each element, and can be combined with the Monte Carlo analysis method to calculate the distribution of the backlash at the output end.
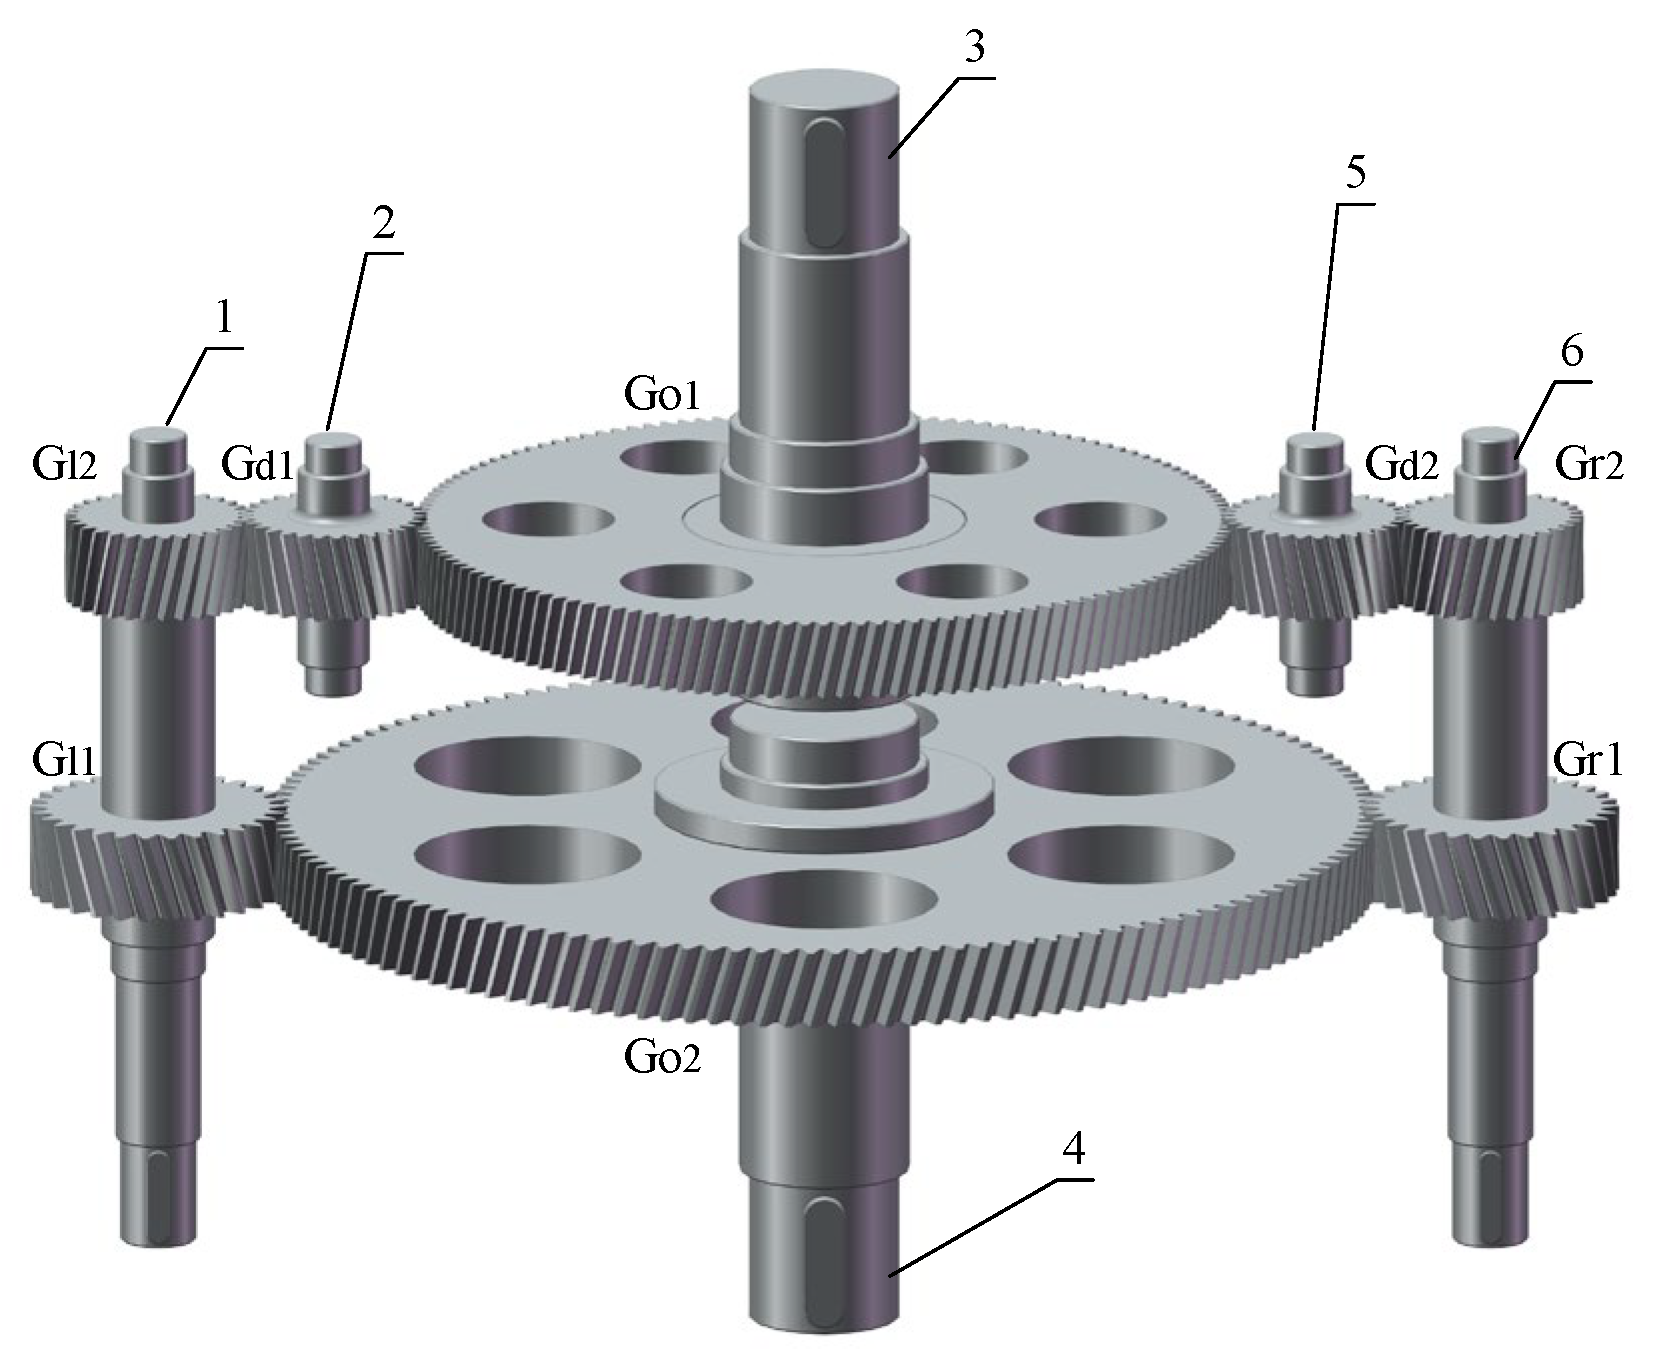
Due to the difficulty of processing and cost limitations, the test was carried out using a double-input counter-rotating gearbox for theoretical calculation and experimental verification. The gearbox had synchronized inputs on the left and right branches and counter-rotating outputs on the two output shafts, and its transmission structure sketch is shown in Figure 4.
In Figure 4, 1 is the first output shaft; 2 is the left idler shaft; 3 is the first output shaft; 4 is the second output shaft; 5 is the right idler shaft; and 6 is the second input shaft.
3.2. Tolerance Specifications for Gearing Systems
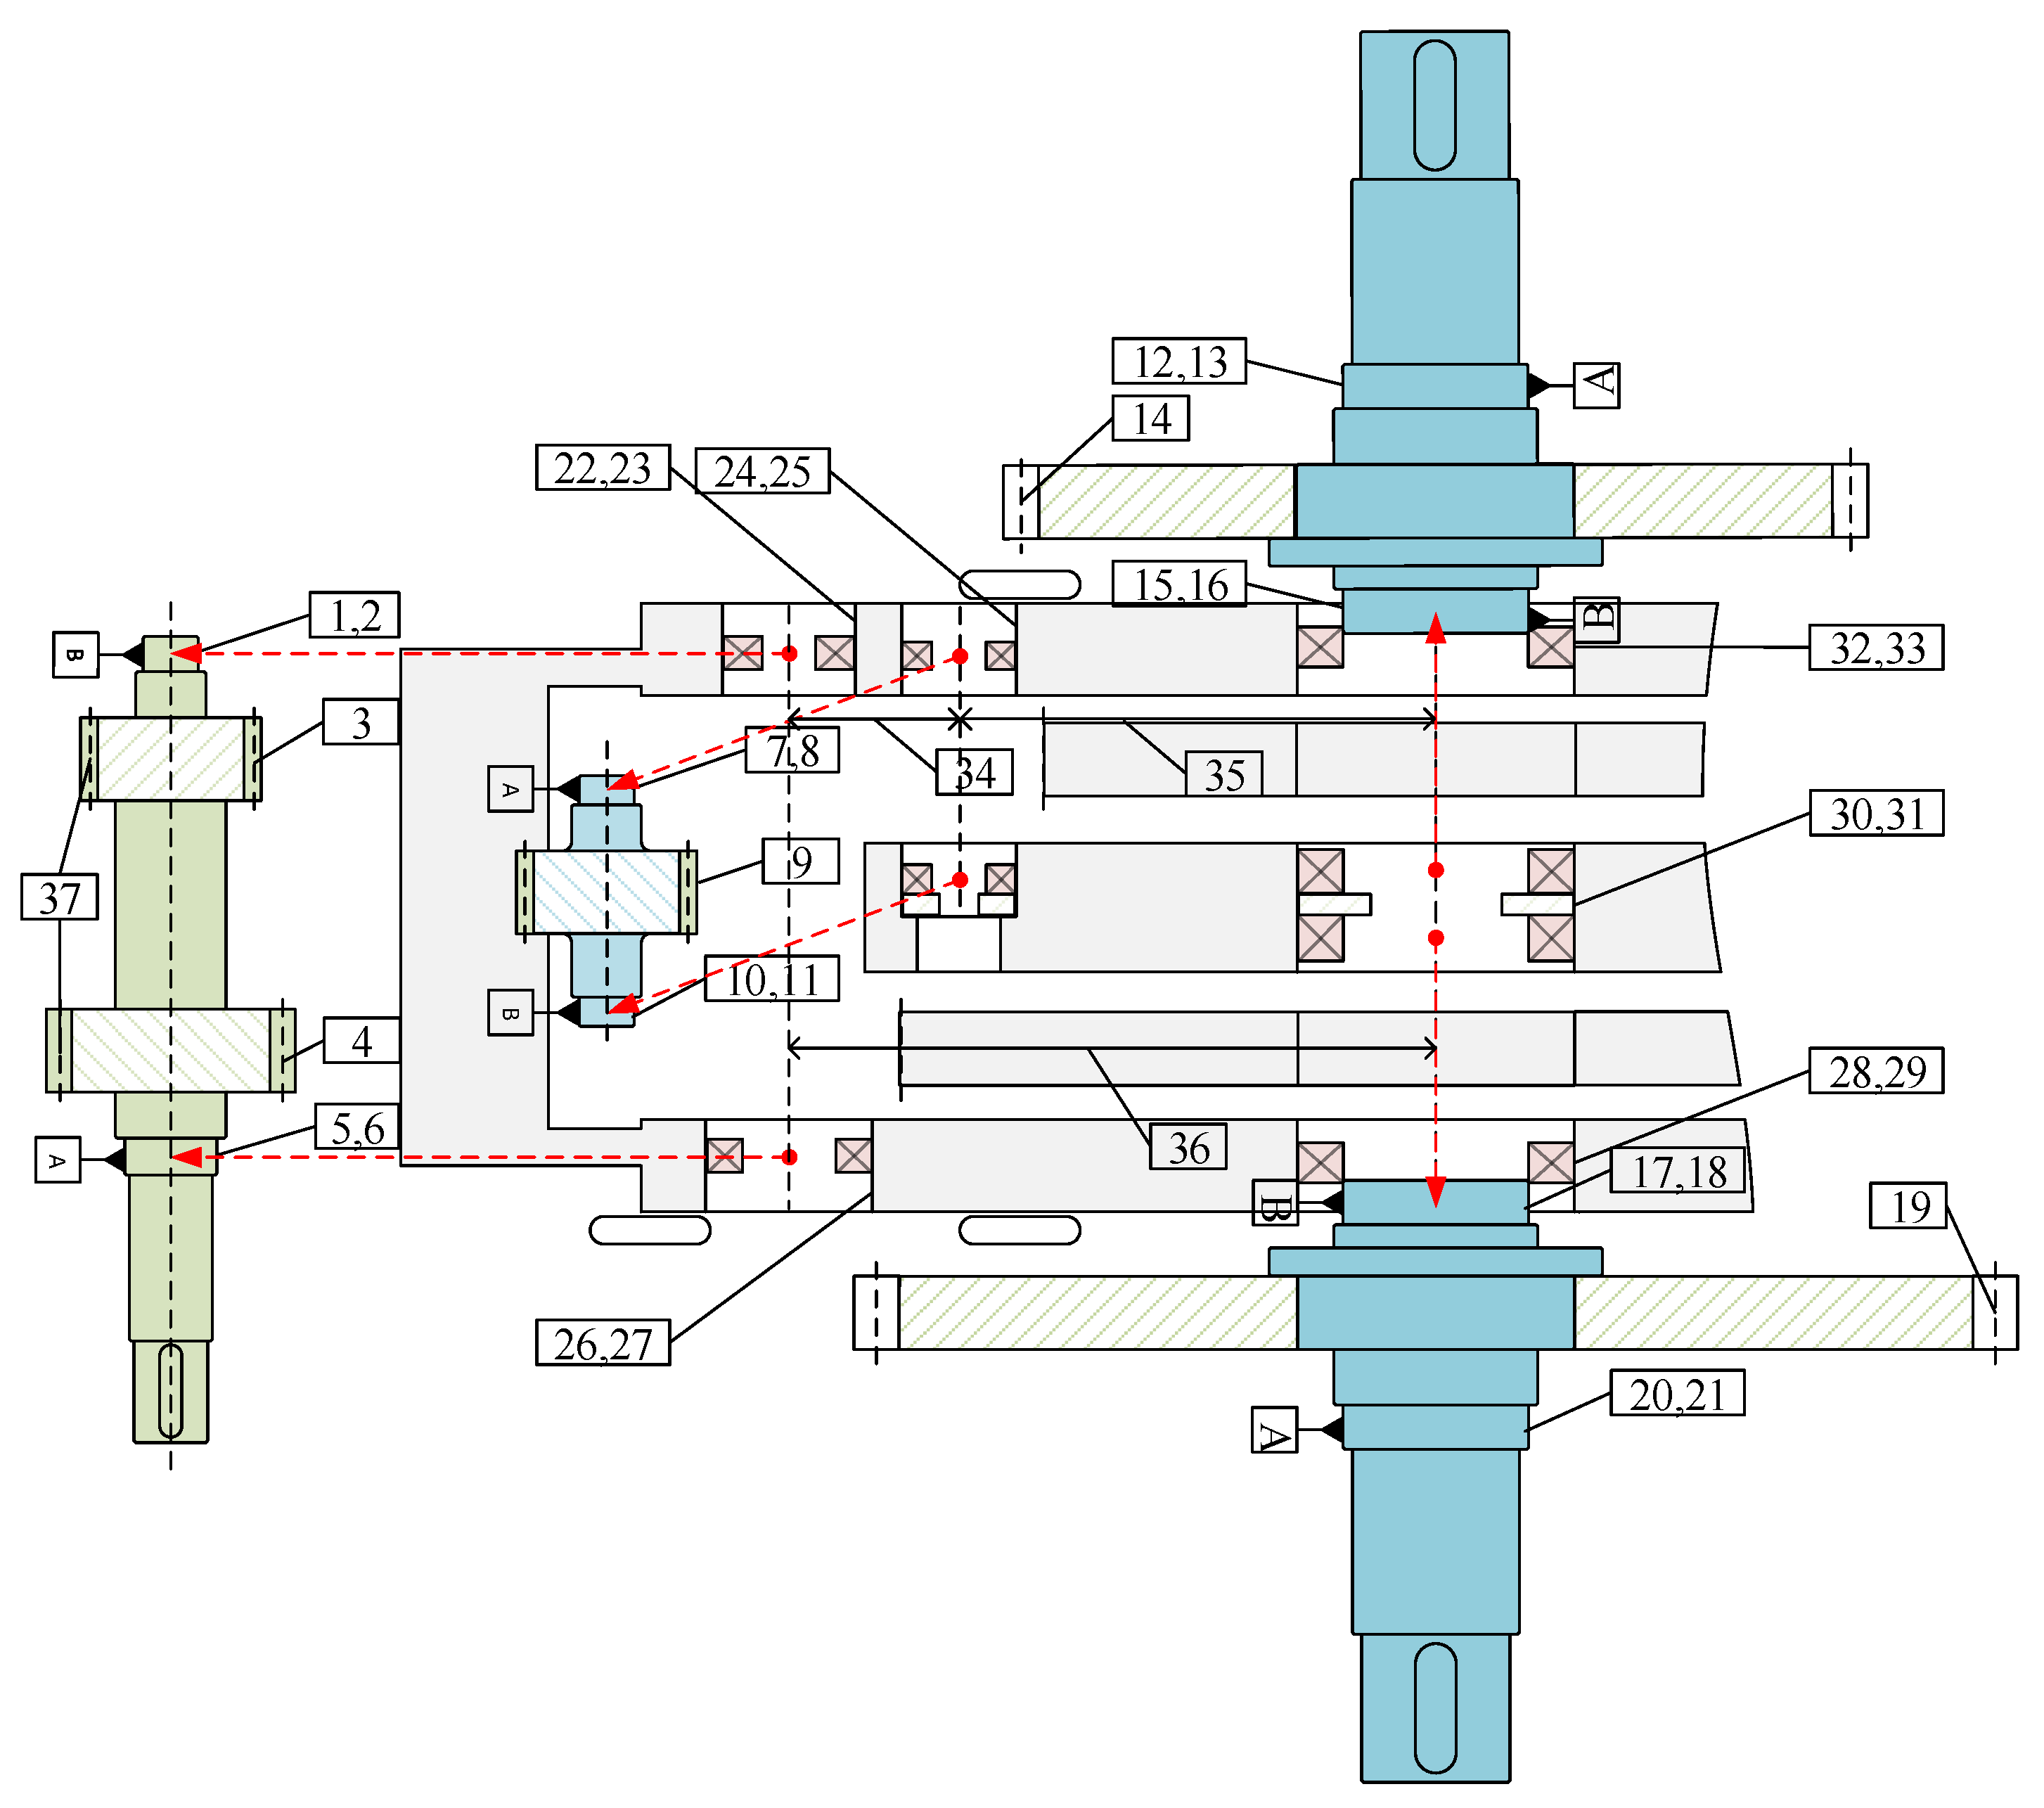
Based on the new generation GPS standard system, the main parts of the gear transmission system include the case, shaft, bearing, and gear. The bearing clearance is not considered here. Go1, Go2, and the output shaft were hot-mounted without considering the assembly clearance. The tolerance specification of each part is shown in Figure 5, in Figure 5, the numbers represent the tolerances of the individual parts, and the red dotted lines indicate the direction of movement of the parts. and the tolerance dimensions are shown in Table A1 in Appendix A.
3.3. Modeling of the Jacobian–Torsor Model of the Gearing System
The gearbox was symmetrical from left to right and could be modeled on one side. The left side of the gearbox was modeled with output shaft 1 as the positioning reference and the backlash between Gd1 and Go1 as the closed ring.
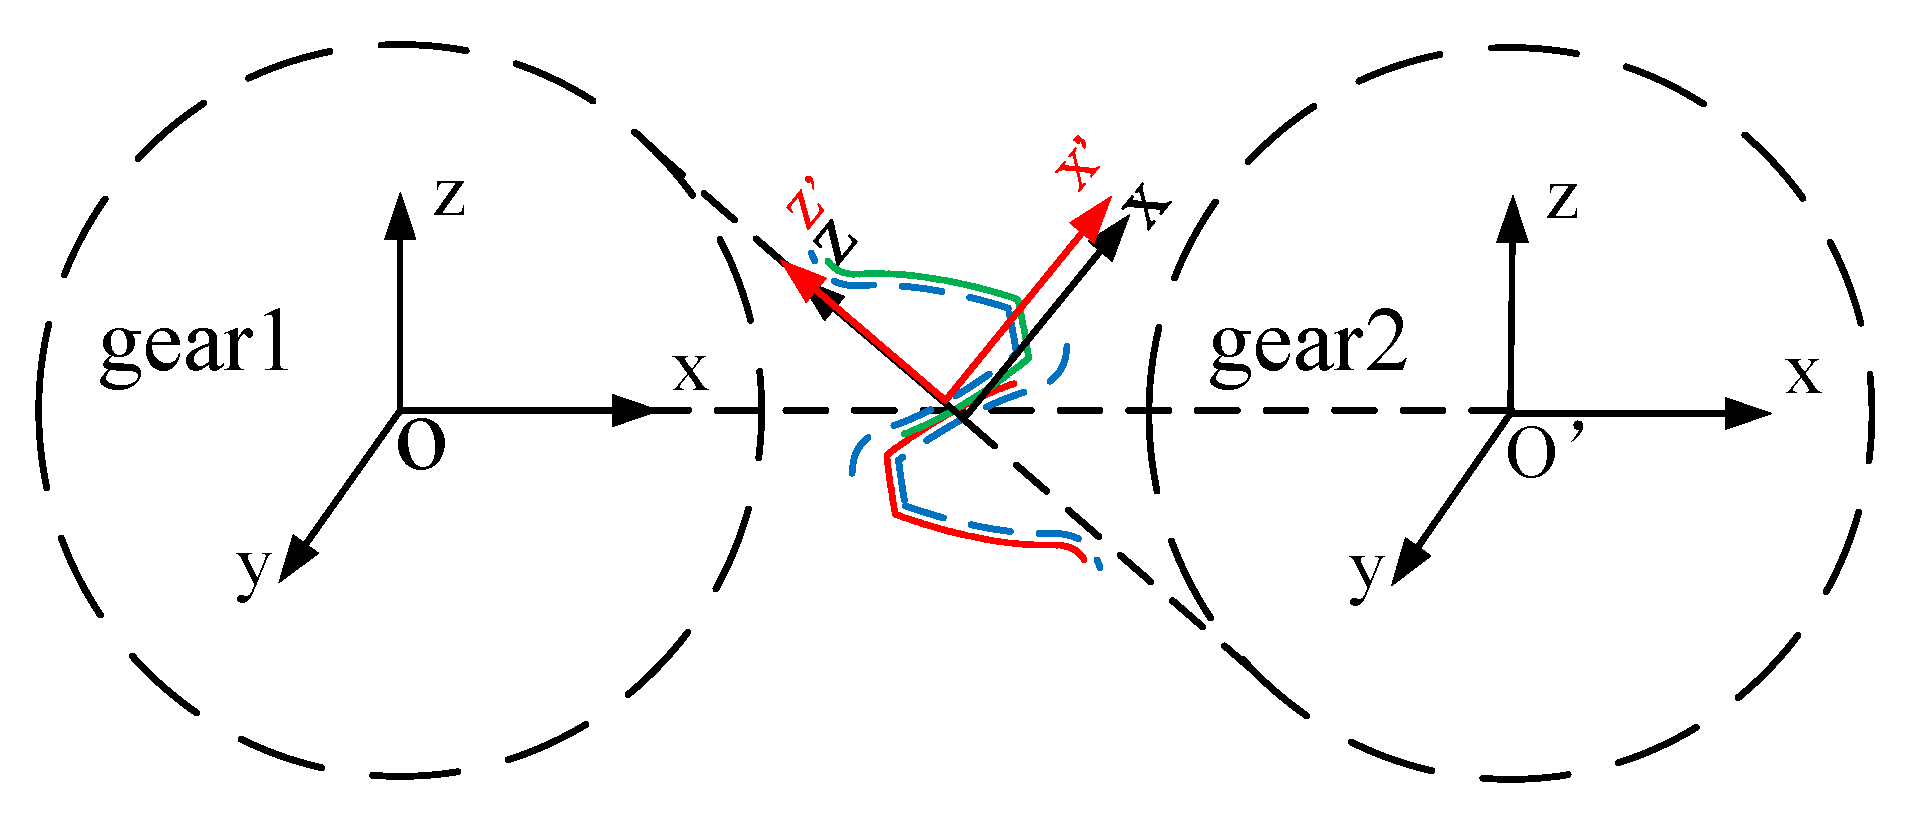
In the gear transmission system, choosing a reasonable working backlash is beneficial for improving the transmission accuracy. The intersection of the two gear axis lines and the gear mesh line is the origin of the characteristic coordinate system on the two gear tooth profiles, and the backlash is the minimum distance between the two tooth profiles. The schematic diagram of the two gears meshing is shown in Figure 6.
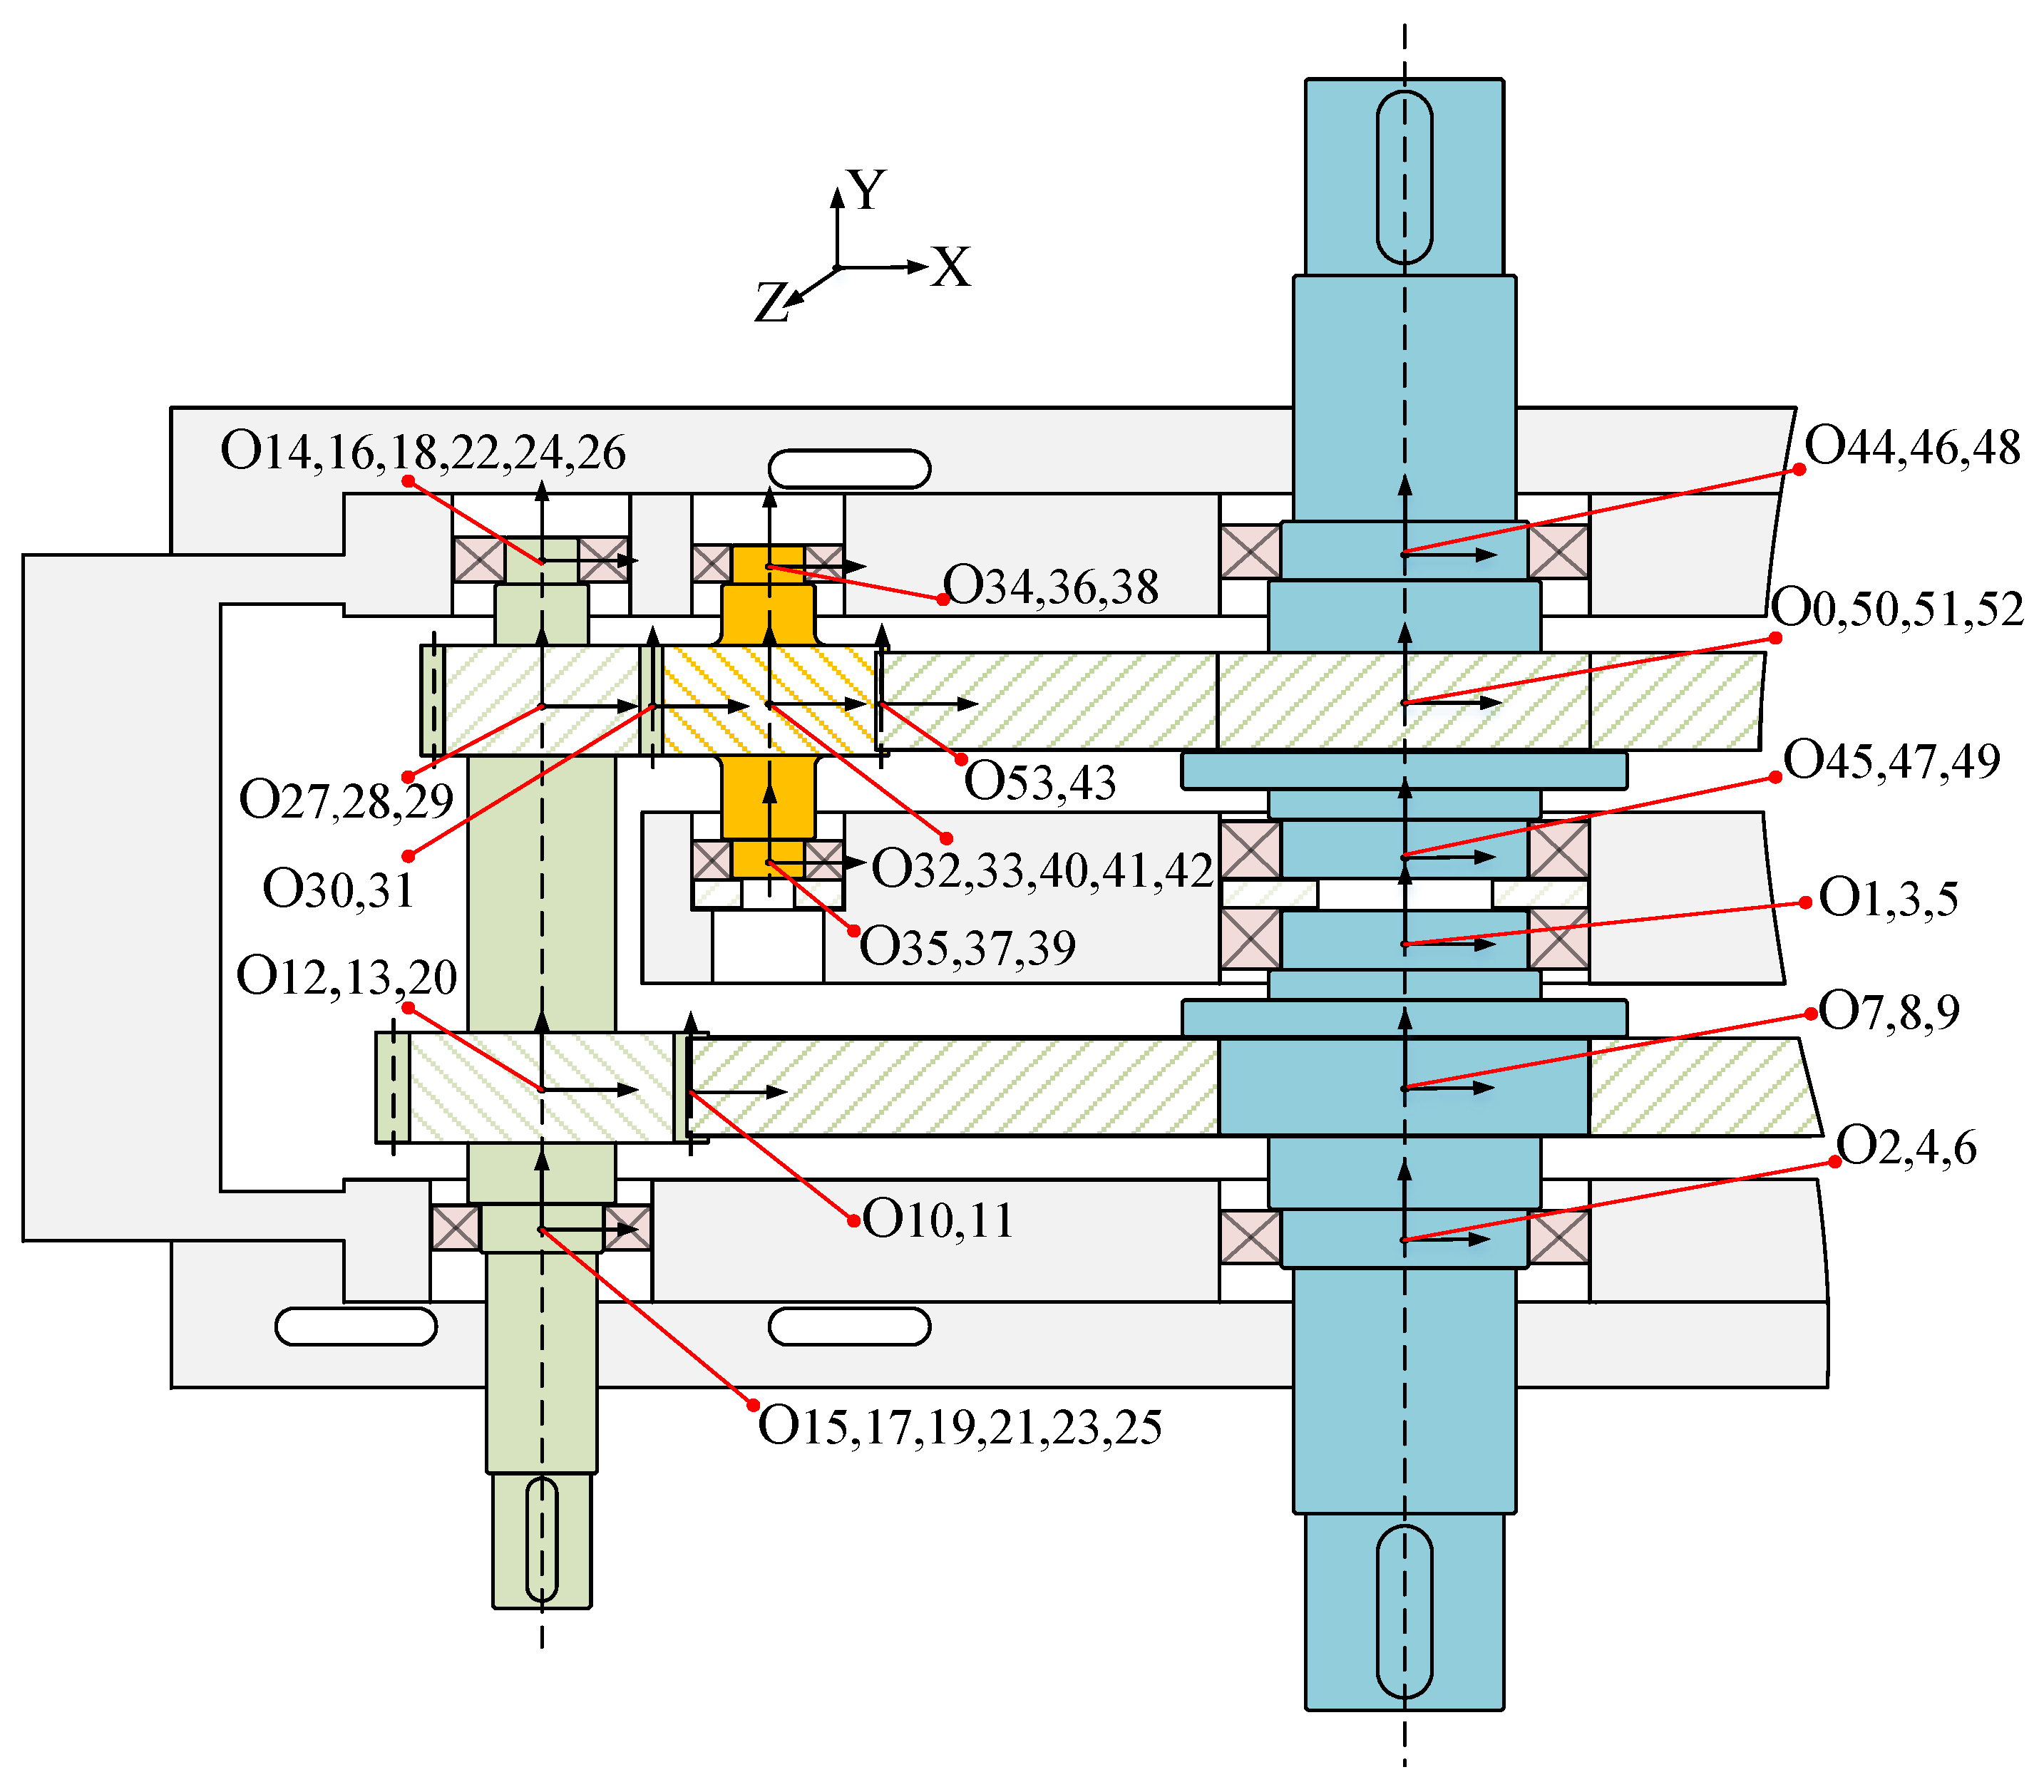
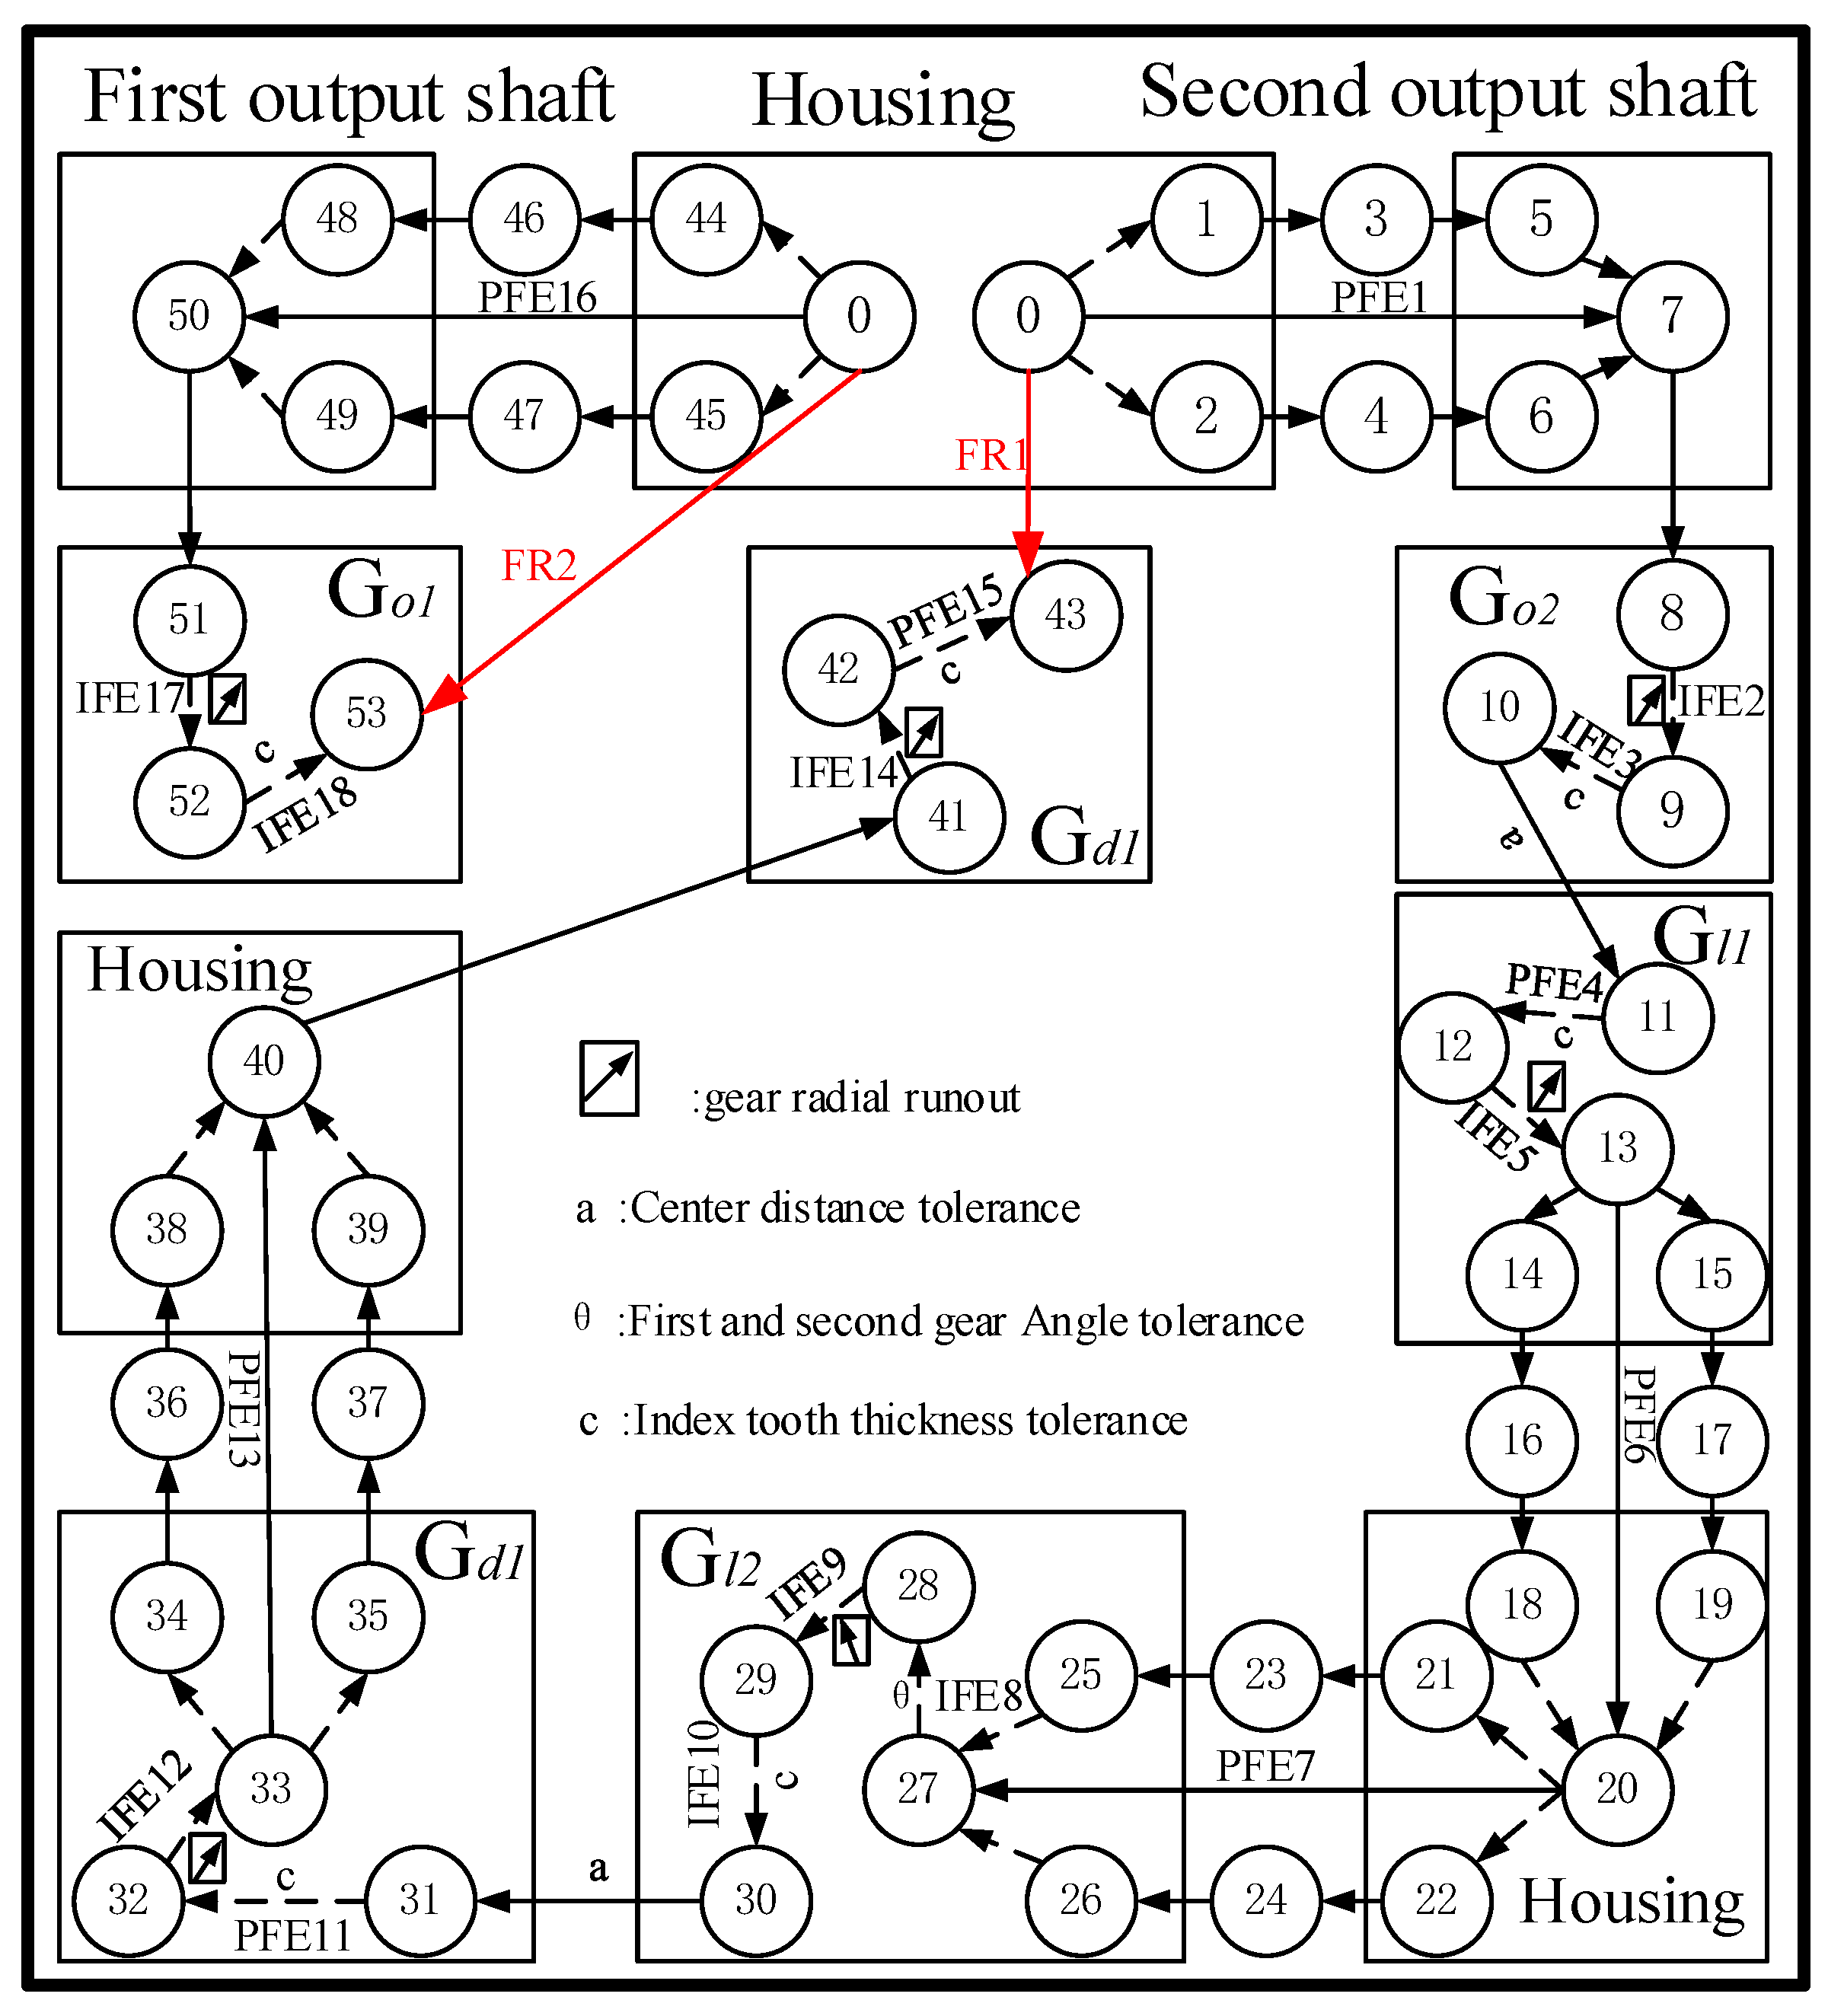
In accordance with the gearbox assembly relationship and the tolerance specification of each part, the coordinate system shown in Figure 7 was established with the gearbox bearing bond surface as the reference In Figure 7, Oi (i = 1, …, n) represents the coordinate axes of each part tolerance. The housing bore was machined based on a uniform datum, so the output shaft 1 and output shaft 2 mounting bores shared a common datum. Considering the gear tooth thickness deviation and center distance tolerance, the Jacobian spin volume model was established, with each part’s manufacturing error and assembly error as the constituent ring and the output gear backlash as the closed ring. Three-dimensional tolerance calculations are usually performed in the closed-loop tolerance direction. However, the direction of the constituent ring tolerance is mostly inconsistent with the backlash direction, so the output shaft reference hole was used as the tolerance analysis direction, and finally was calculated with an angular conversion to the closed ring coordinate system direction. The dimensional chain of the gearbox assembly is shown schematically in Figure 8. In Figure 8, i (i = 1, …, n) denotes the axis designation of each part tolerance.
As shown in Figure 8, FRi is the output gear backlash tolerance torsor, IFE is the internal part tolerance torsor, CFE is the inter-part tolerance torsor, and the PFE parallel tolerance torsor can be solved as described in Section 2.2
The housing and shaft parallel chains were converted into serial chain parameters as shown in Table A2 in Appendix A. The SDT of each tolerance is shown in Table A3 in Appendix A. The Jacobian matrix of each tolerance is shown in Table A4 in Appendix A.
The calculation of in the Table A1 is as follows:
where is the base circle radius of Go2, and is the reference circle radius of Go2.
3.4. Three-Dimensional Tolerance Analysis of Output Gear Backlash of Gearbox
Three-dimensional tolerance analysis mainly has an extreme value method and a statistical method. The backlash calculated with the extreme value method is large. In this research, we used the Monte Carlo method in the statistical method for the tolerance analysis of the backlash.
Monte Carlo simulation is a numerical method for solving approximate solutions to mathematical, physical, and engineering technology problems through stochastic simulations and statistical experiments. The method is computationally accurate and consistent with the actual generation, and it is suitable for the solution of assembly functions with nonlinear expressions.
The dimensional and shape tolerances of the gearbox follow the principle of independence, and the tolerance zones of their dimensional and shape tolerances are symmetrically distributed and obey a normal distribution. The symmetrically distributed tolerances, regardless of whether they are defined as increasing or decreasing rings, have the same effect on the closed ring. Therefore, in the process of tolerance analysis, the tolerance of each component ring is expressed as (t is the tolerance of the component ring).
The closed-loop samples FR1 and FR2 conformed to a normal distribution, for which the tolerance can be calculated as follows:
where and are the mean and the variance of FR, respectively. The confidence level at 99.73% probability was used, and Z was taken as 3.
The backlash value was calculated as follows:
where is the upper deviation of the Z-directional translation of closed-dimensional chain 1, is the lower deviation of the Z-directional translation of closed-dimensional chain 2, is the upper deviation of the Z-directional rotation of closed-dimensional chain 1, is the lower deviation of the Z-directional rotation of closed-dimensional chain 2, and is the angle of engagement of Gd1 and Gd2 with Go1.
The results of the calculation are shown in Table 2.
The theoretical value of 0.2443 mm was used as the lower limit of the backlash, and the value calculated with the Monte Carlo method, 0.4150 mm, was used as the upper limit of the backlash. The actual measurement of the backlash should be distributed in this range.
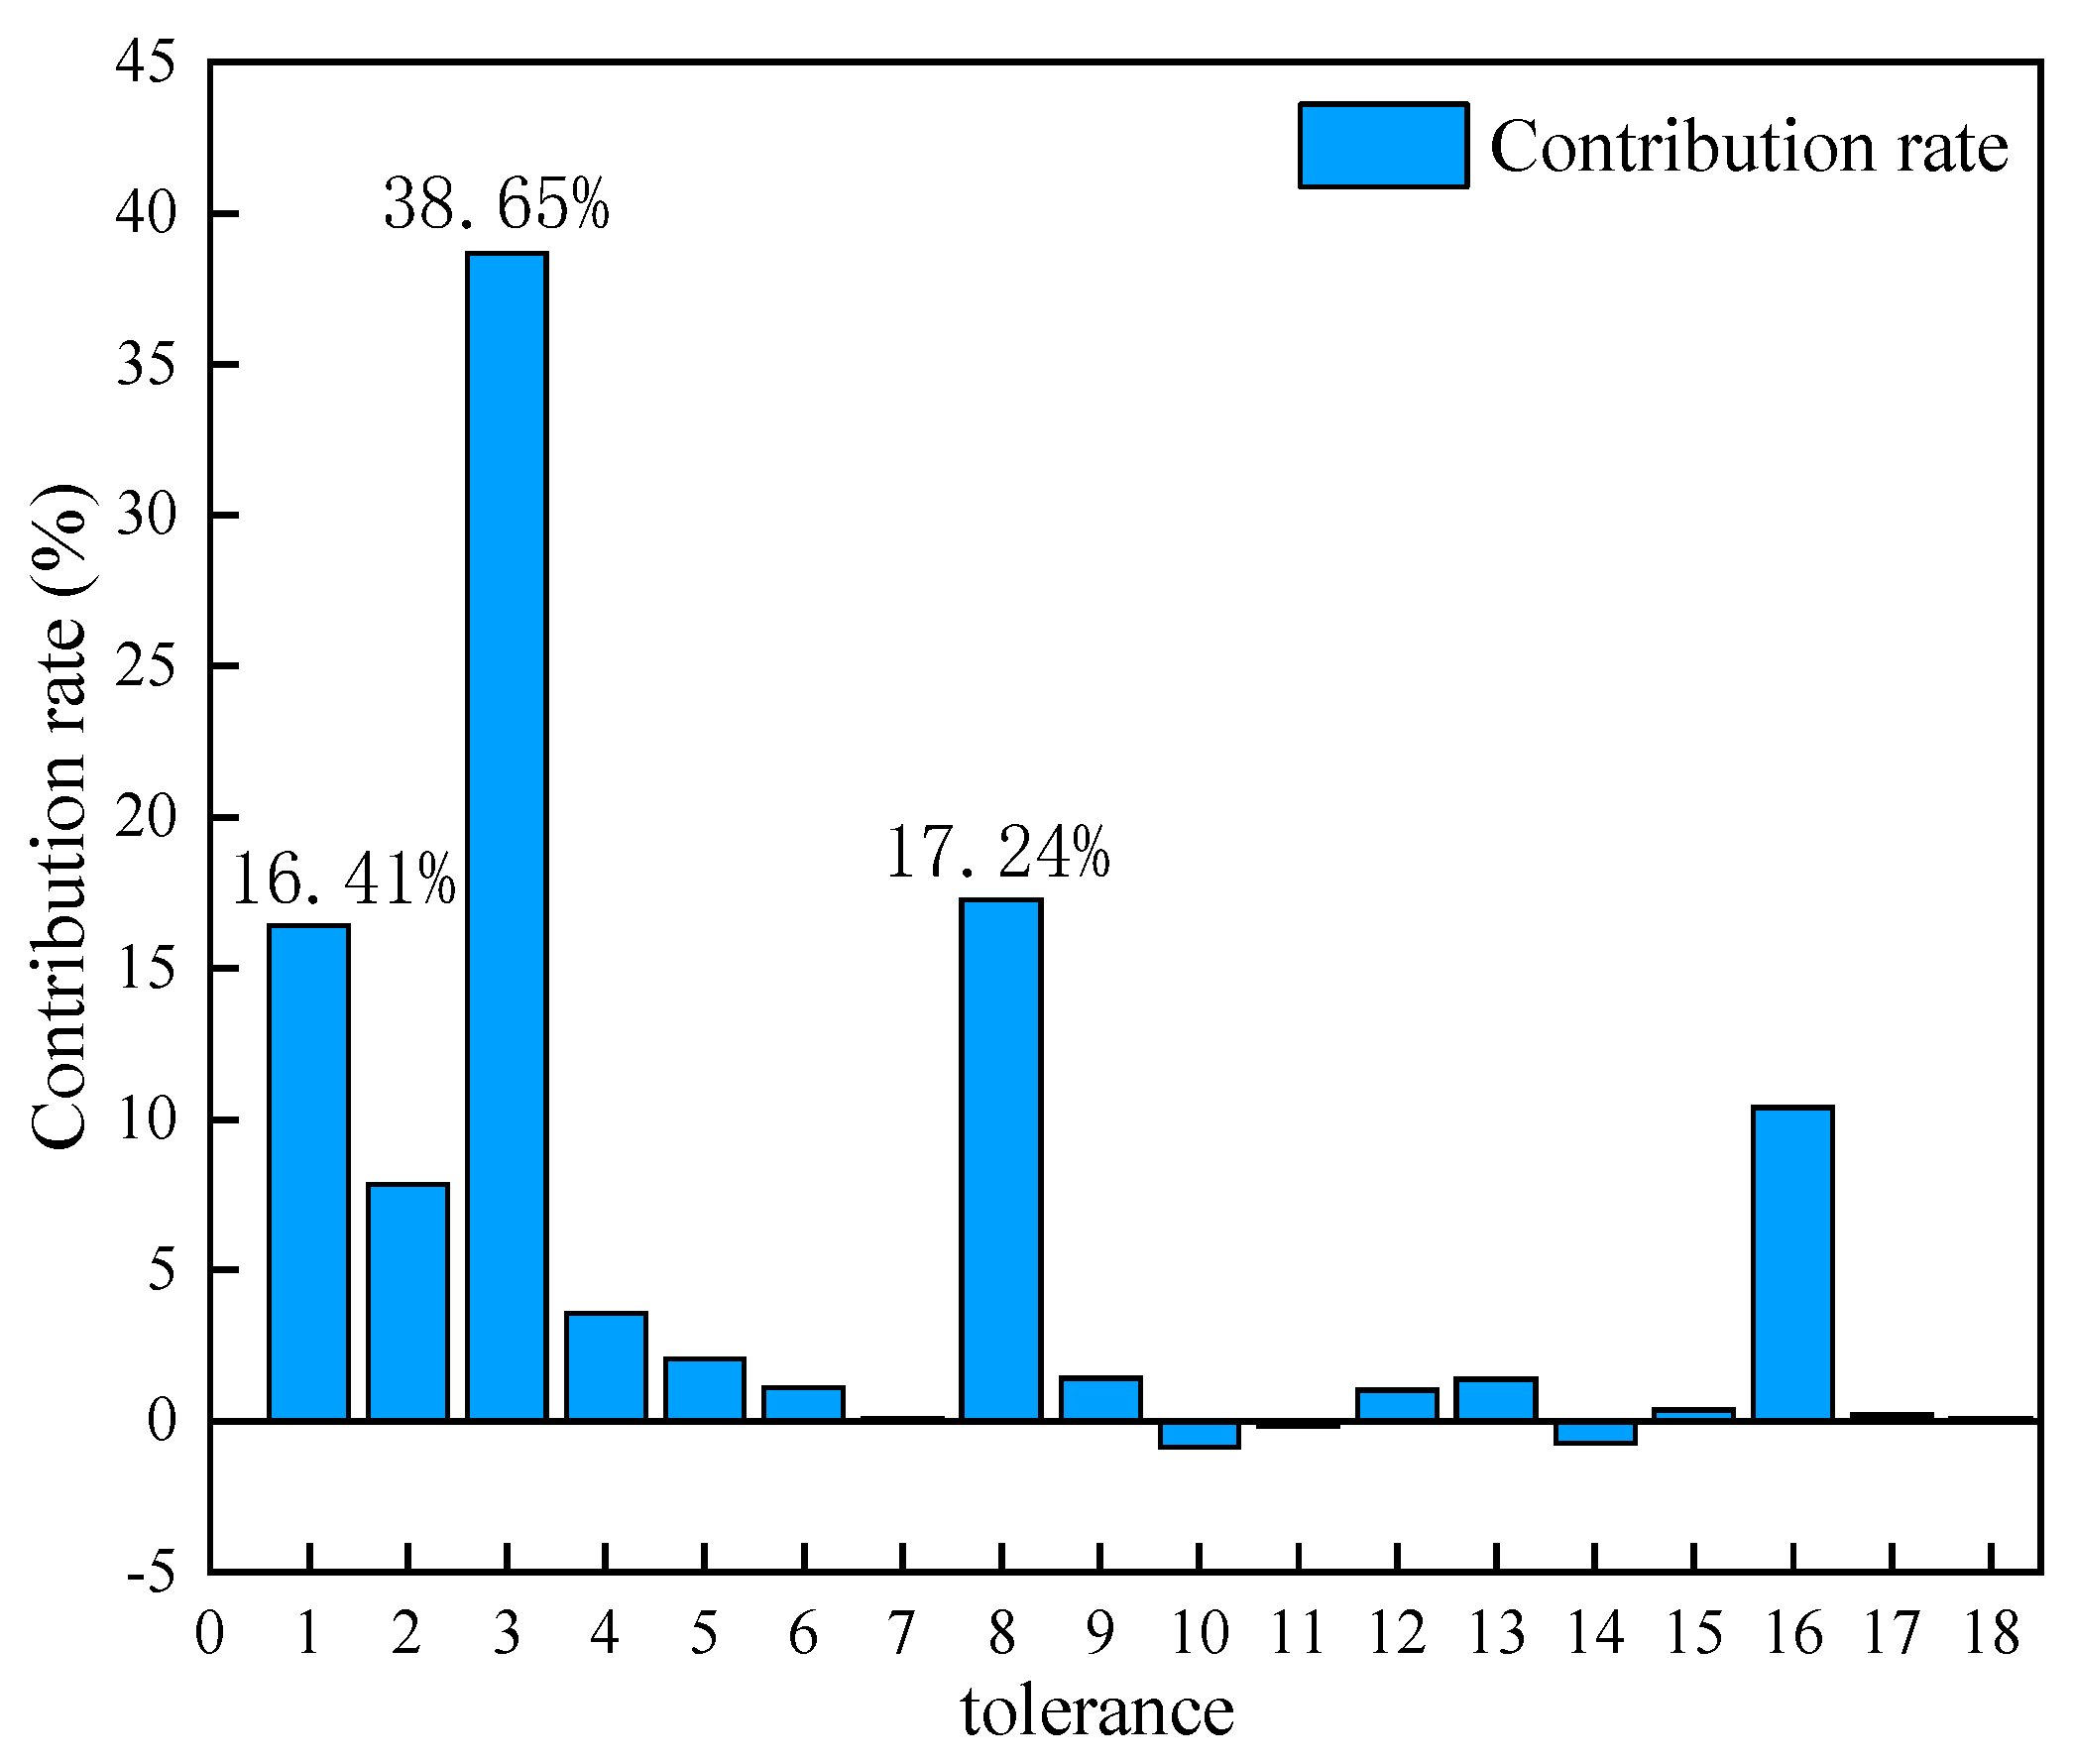
The contribution of each dimensional tolerance to the backlash closure ring is shown in Figure 9.
As can be seen from Figure 9, the tolerance T3 has the highest contribution to the backlash at 38.65%, followed by the tolerances T8 and T1 at 17.24% and 16.41%, respectively. Tolerance T3 is the center distance error of the first stage gear, tolerance T8 is the phase angle error of the first and second stage gear. The error value of the center distance and phase angle is consistent with the direction of the backlash, and at the same time, due to the large value of the center distance error, it has the greatest impact on the backlash, followed by the phase angle error.
4. Calculation Method of Equal Load Factor for Dual-Input Counter-Rotating Gearbox
4.1. Calculation of the Elastic Deflection Angle of the Gear Shaft System
For the dual-input counter-rotating transmission system, when the two input torques are the same, the load difference between Gl1, Gr1, and Go2 is neglected because the cumulative error between Gl1, Gr1, and Go2 is small, the two gears are very close to the input motor, and the deformation of the shaft system is small. During the loading process, one of the two idler pulleys enters into engagement first. Due to the influence of manufacturing and installation errors, there is a gap between the idler pulley that enters into engagement later and Go1, and with the increase in the input torque T, the gap is gradually eliminated through the elastic deformation of the engagement sub and input shaft system. Then, all idler pulleys enter into engagement. The rotation angle of Gl1 and Gr1 is . The rotation angles of Gl2 and Gr2 are , respectively, while the Go1 and Go2 rotation angles are , respectively. The left and right input shaft torsion angles are , respectively.
The gear meshing deformation and rotation angle were calculated as shown in Equation (18). The torsion angle formed by the torsional deformation of the shaft was calculated as shown in Equation (19). The equations for the static balance of the input shaft, idler shaft, and output shaft 1 are shown in Equation (20). The theoretical normal backlash could be converted into a circumferential backlash with Equation (21).
where i is the transmission ratio, is the average meshing stiffness of gears Go2 and Gl1, and is the average meshing stiffness of gears Go1 and Gl2. is the torque applied to gear Gl1, and is the radius of the base circle of the gear. is the torque applied to gear Gl2 and is the radius of the base circle of the Gl2. is the torque applied to gear Gr1 and is the radius of the base circle of gear Gr1. is the torque applied to gear Gr2 and is the radius of the base circle of gear Gr2. is the torque applied to gear Go1 and is the torque applied to gear Go2. is the base helix angle of gear Go1, is the gear Go1 engagement angle, is the input shaft length, is the input shaft diameter, and is the input shaft modulus of elasticity.
In Equations (18) and (21), the torsional deformation of the input shaft was solved according to material mechanics, the average meshing stiffness of the gear was calculated according to GB/T 3480-1997 [35], and the meshing angle was calculated by referring to ISO/TR10064-2:1996 [36].
When the input torques are equal to 200 N m, the calculated deformation of the system under a load, Gd1 turns at an angle of 0.007 rad with respect to Go1. The previous theoretical backlash value of 0.2443 mm is the normal backlash, and the rotation angle corresponding to the Gd1 circumferential backlash is 0.006 rad. If the manufacturing and assembly errors of the system are not considered, the theoretical equal load performance of the system is good.
4.2. Analysis and Calculation of the Uniform Load Factor
In fact, the dual-input counter-rotating gearbox had manufacturing and assembly errors, and the two branches were not loaded in the same way. It was then assumed that the left branch backlash was the theoretical value of 0.2443 mm and the right branch backlash value was the upper limit of 0.4150 mm, and the elastic deformation of the two branches could compensate for the backlash. The torque values of gears Gl2 and Gr2 were calculated according to Equations (18) and (19), and the equal load factor is defined as follows:
where are the torque values of gear Gl2 and Gr2, respectively.
From the previous calculations of backlash and torque values, it can be seen that the uniform load coefficient of the dual-input counter-rotating gearbox ranged from 1 to 1.259.
5. Experimental Verification of Load Distribution Characteristics of Dual-Input Counter-Rotating Gearbox
The range of the Gd1, Gd2, and Go1 backlash calculated with the three-dimensional tolerance discussed in Section 3.3 shows that when the input torque of the two branches was equal, the backlash of Gl2 and Gr2, and the value of the torque applied were not equal.
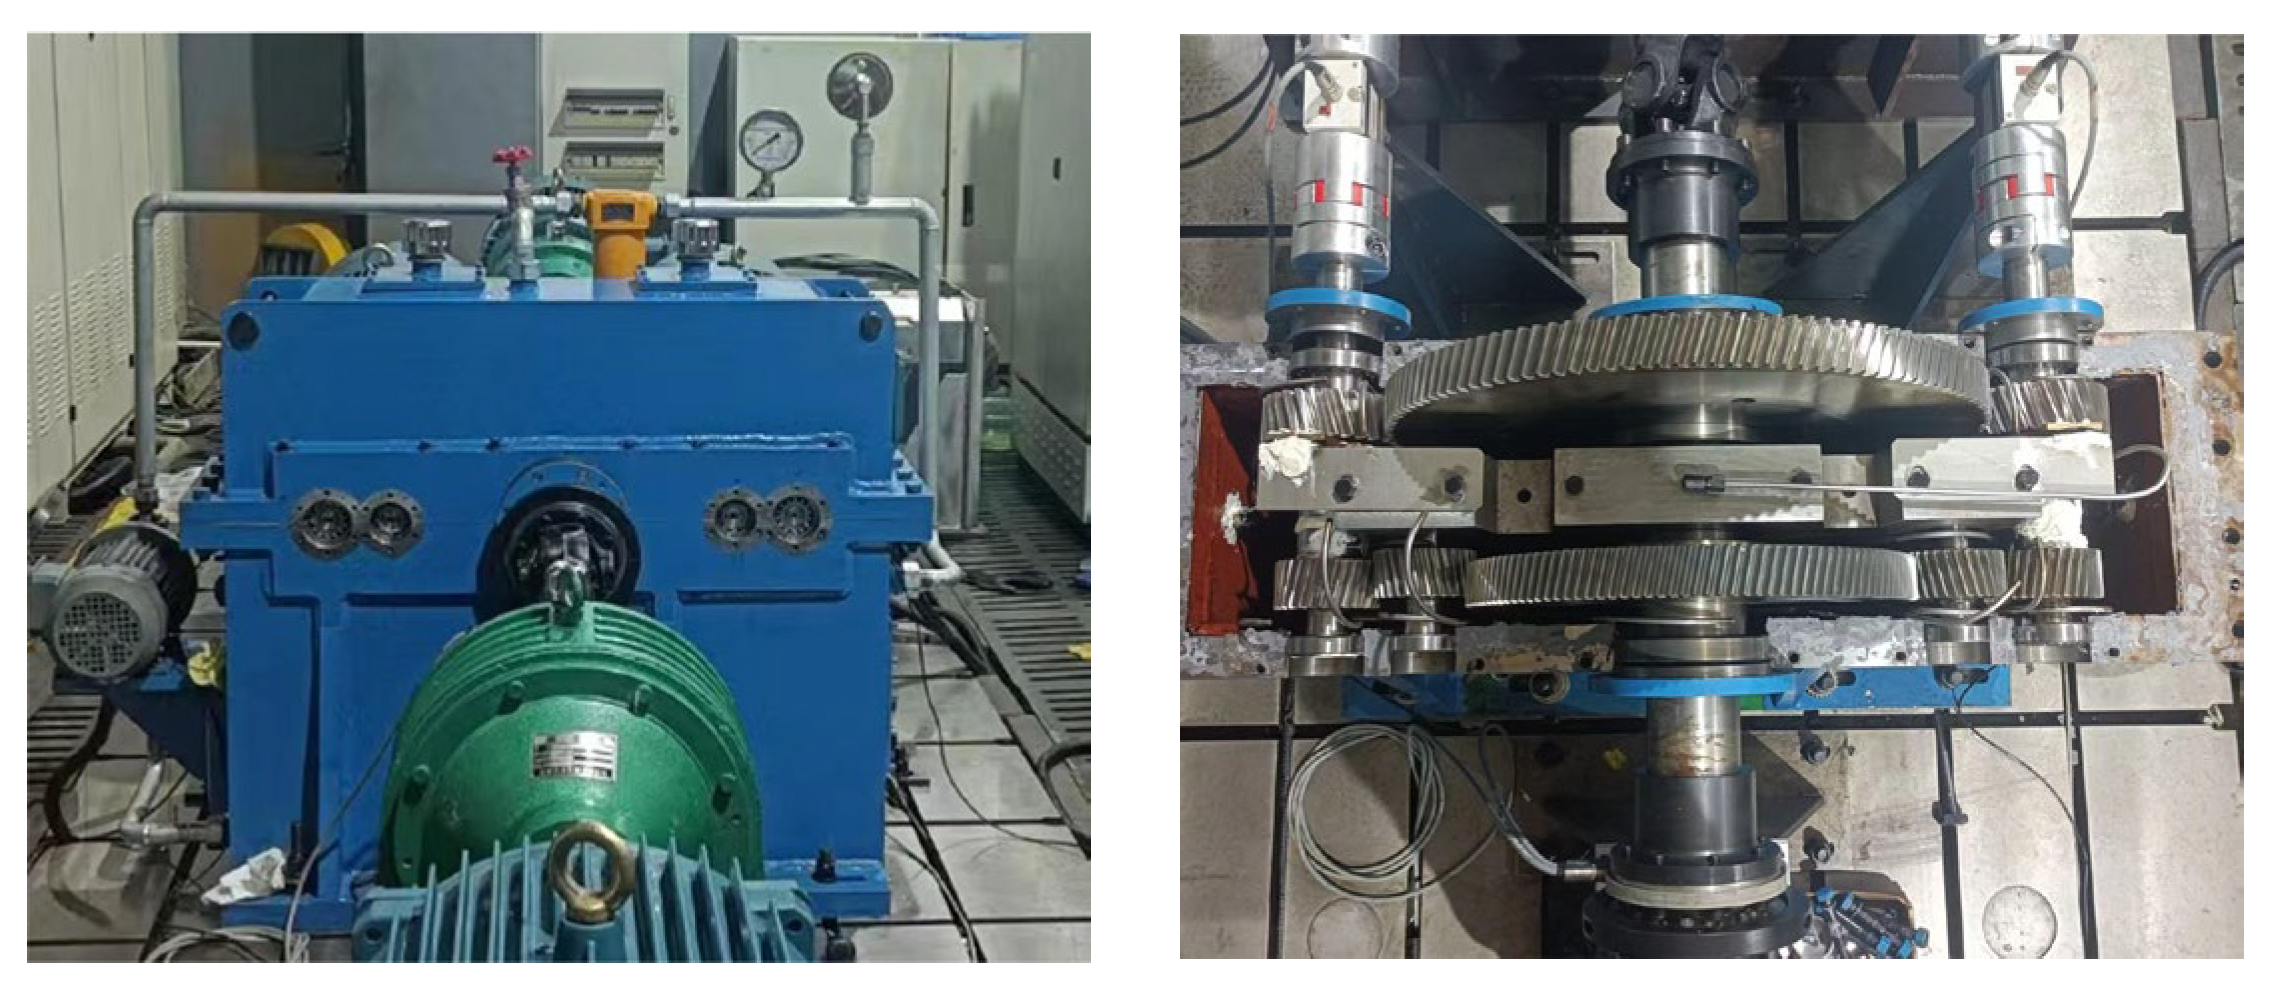
The previous calculation showed that the Gd1, Gd2, and Go1 backlash range was 0.2443–0.4150 mm, and the system’s uniform load coefficient range was 1–1.259. To verify the reasonableness of the previous calculation method, a test rig was built for testing. The test rig for the dual-input counter-rotating gearbox is shown in Figure 10.
5.1. Backlash Test Verification
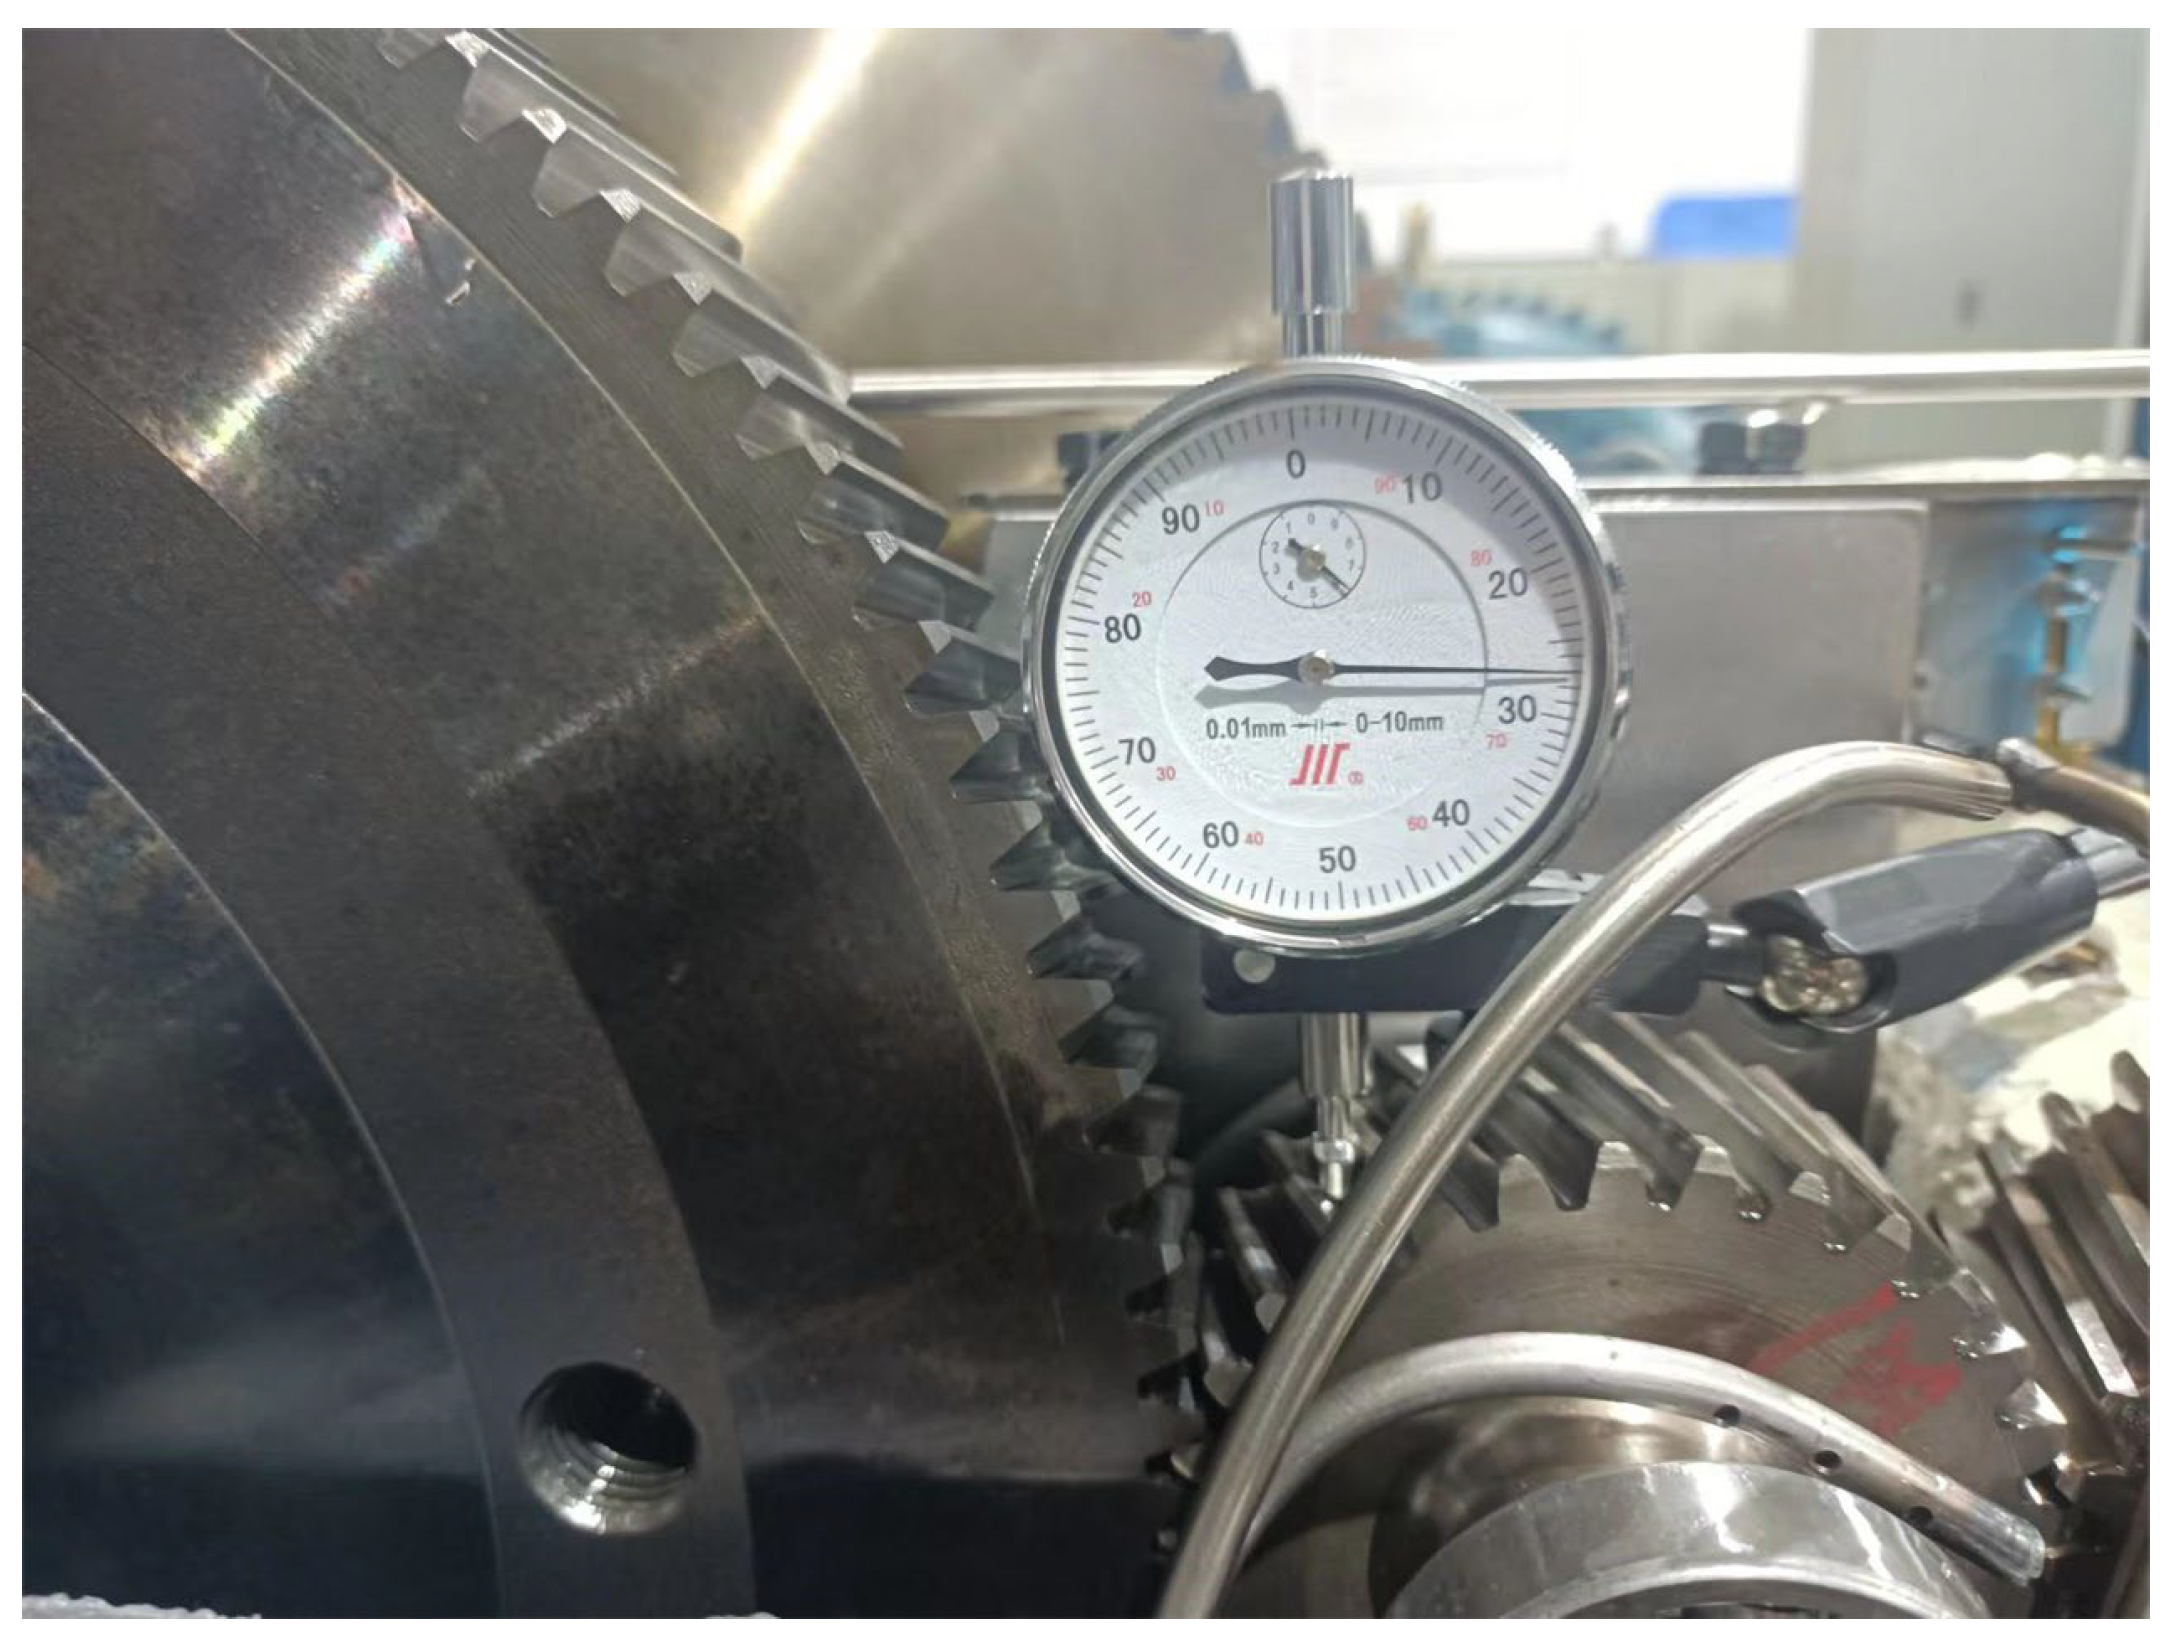
The Gd1, Gd2, and Go1 backlash was measured using a dial gauge. When measuring the side clearance, the input shaft and output shaft 1 positions were fixed, and the dial gauge was located at the Gd1 and Gd2 indexing circle. Then, Gd1 and Gd2 were turned and the dial gauge reading was the backlash value. The actual measurement method is shown in Figure 11.
When measuring, the input shaft was rotated four times with the output shaft 1 position, and the backlash was taken as the average of eight measurements. The measurement data are shown in Table 3.
The actual measured Gd1 and Go1 backlash value was 0.251 mm and the Gd2 and Go1 backlash value was 0.410 mm. The actual measured backlash was within the theoretical calculated backlash range of 0.2443–0.4150 mm, and the three-dimensional tolerance analysis played a more important role in the study of the system’s even load performance.
With the actual measured backlash values, the two branch torques were calculated as 86.736 N m and 141.680 N m using Equations (18)–(21), and the uniform load coefficient was calculated as 1.241 according to the definition of the uniform load coefficient in Equation (22).
5.2. Uniform Load Performance Test
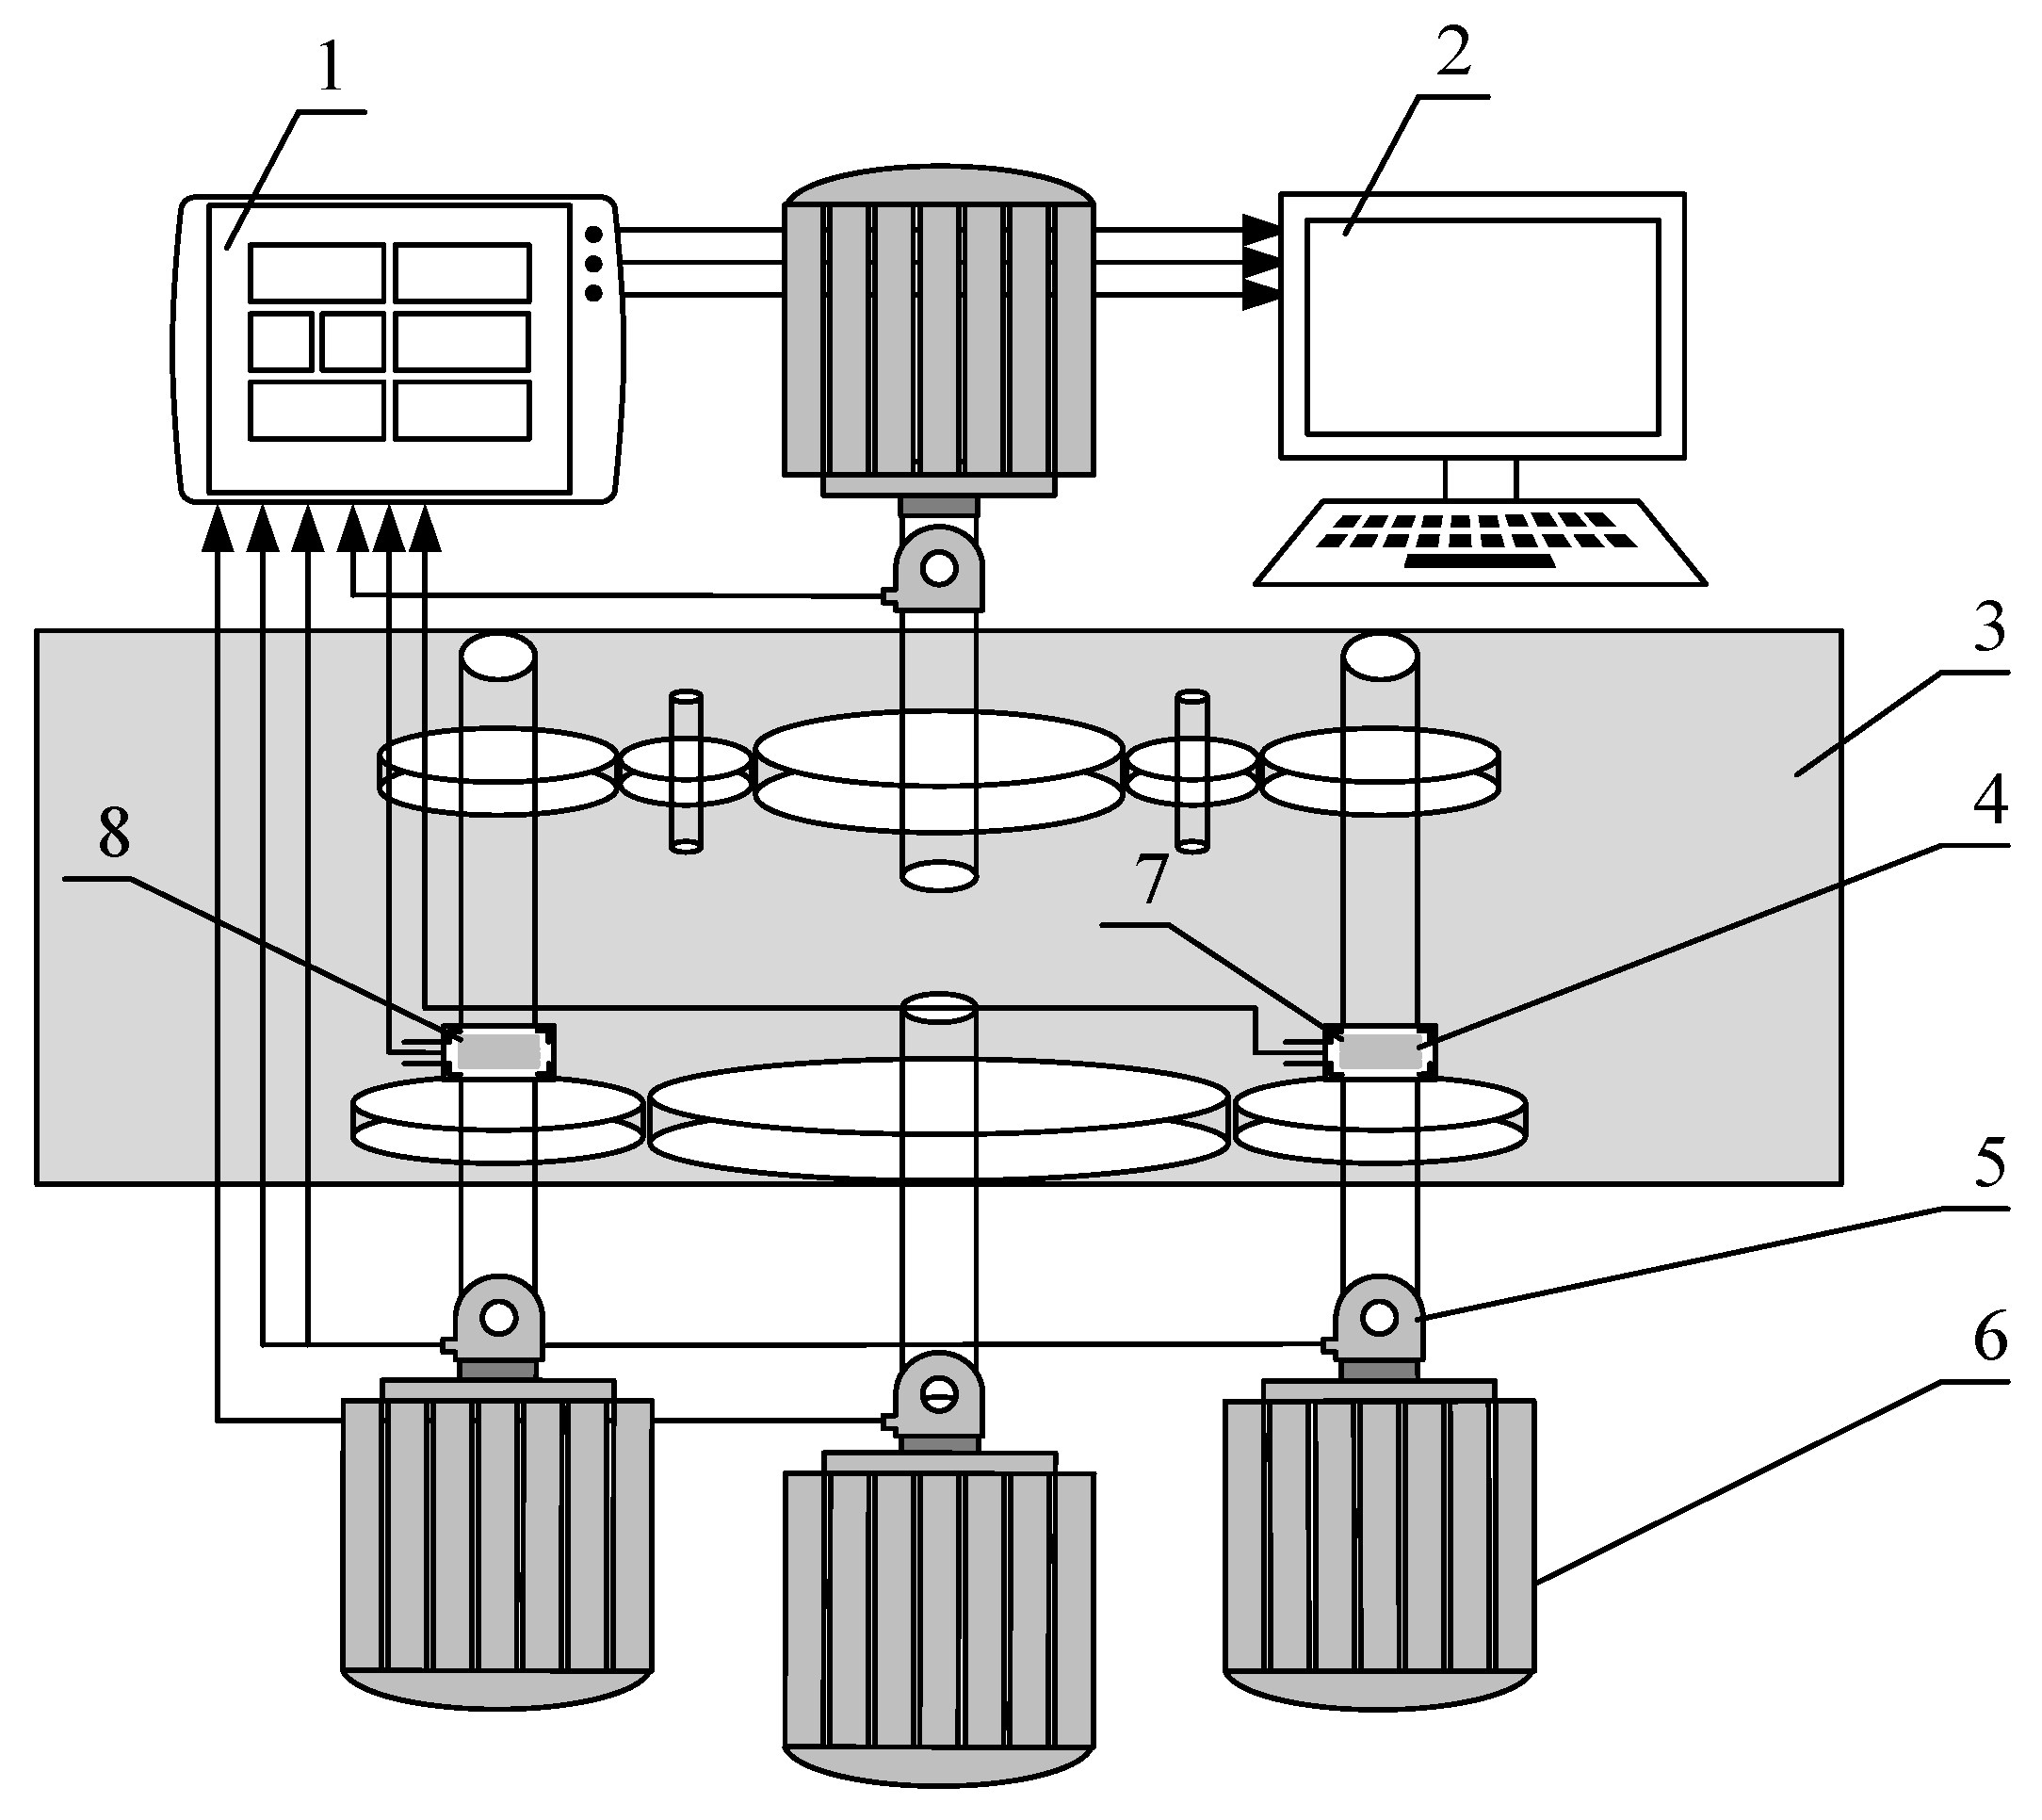
The uniform load coefficient was calculated to be 1.241 according to the backlash, and the gear Gl2 and Gr2 torque values were then measured using a stress-torque sensor with strain gauges applied to the two input shafts at the corresponding two measurement points. The measurement principle is shown in Figure 12.
In Figure 12, 1 is the signal acquisition system; 2 is the PC; 3 is the gear box; 4 is the strain sensor; 5 is the speed and torque sensor; 6 is the driving motor; 7 is measurement point 1; and 8 is measurement point 2.
The results of the torque measurements at measurement point 1 and measurement point 2 for various input conditions are shown in Table 4.
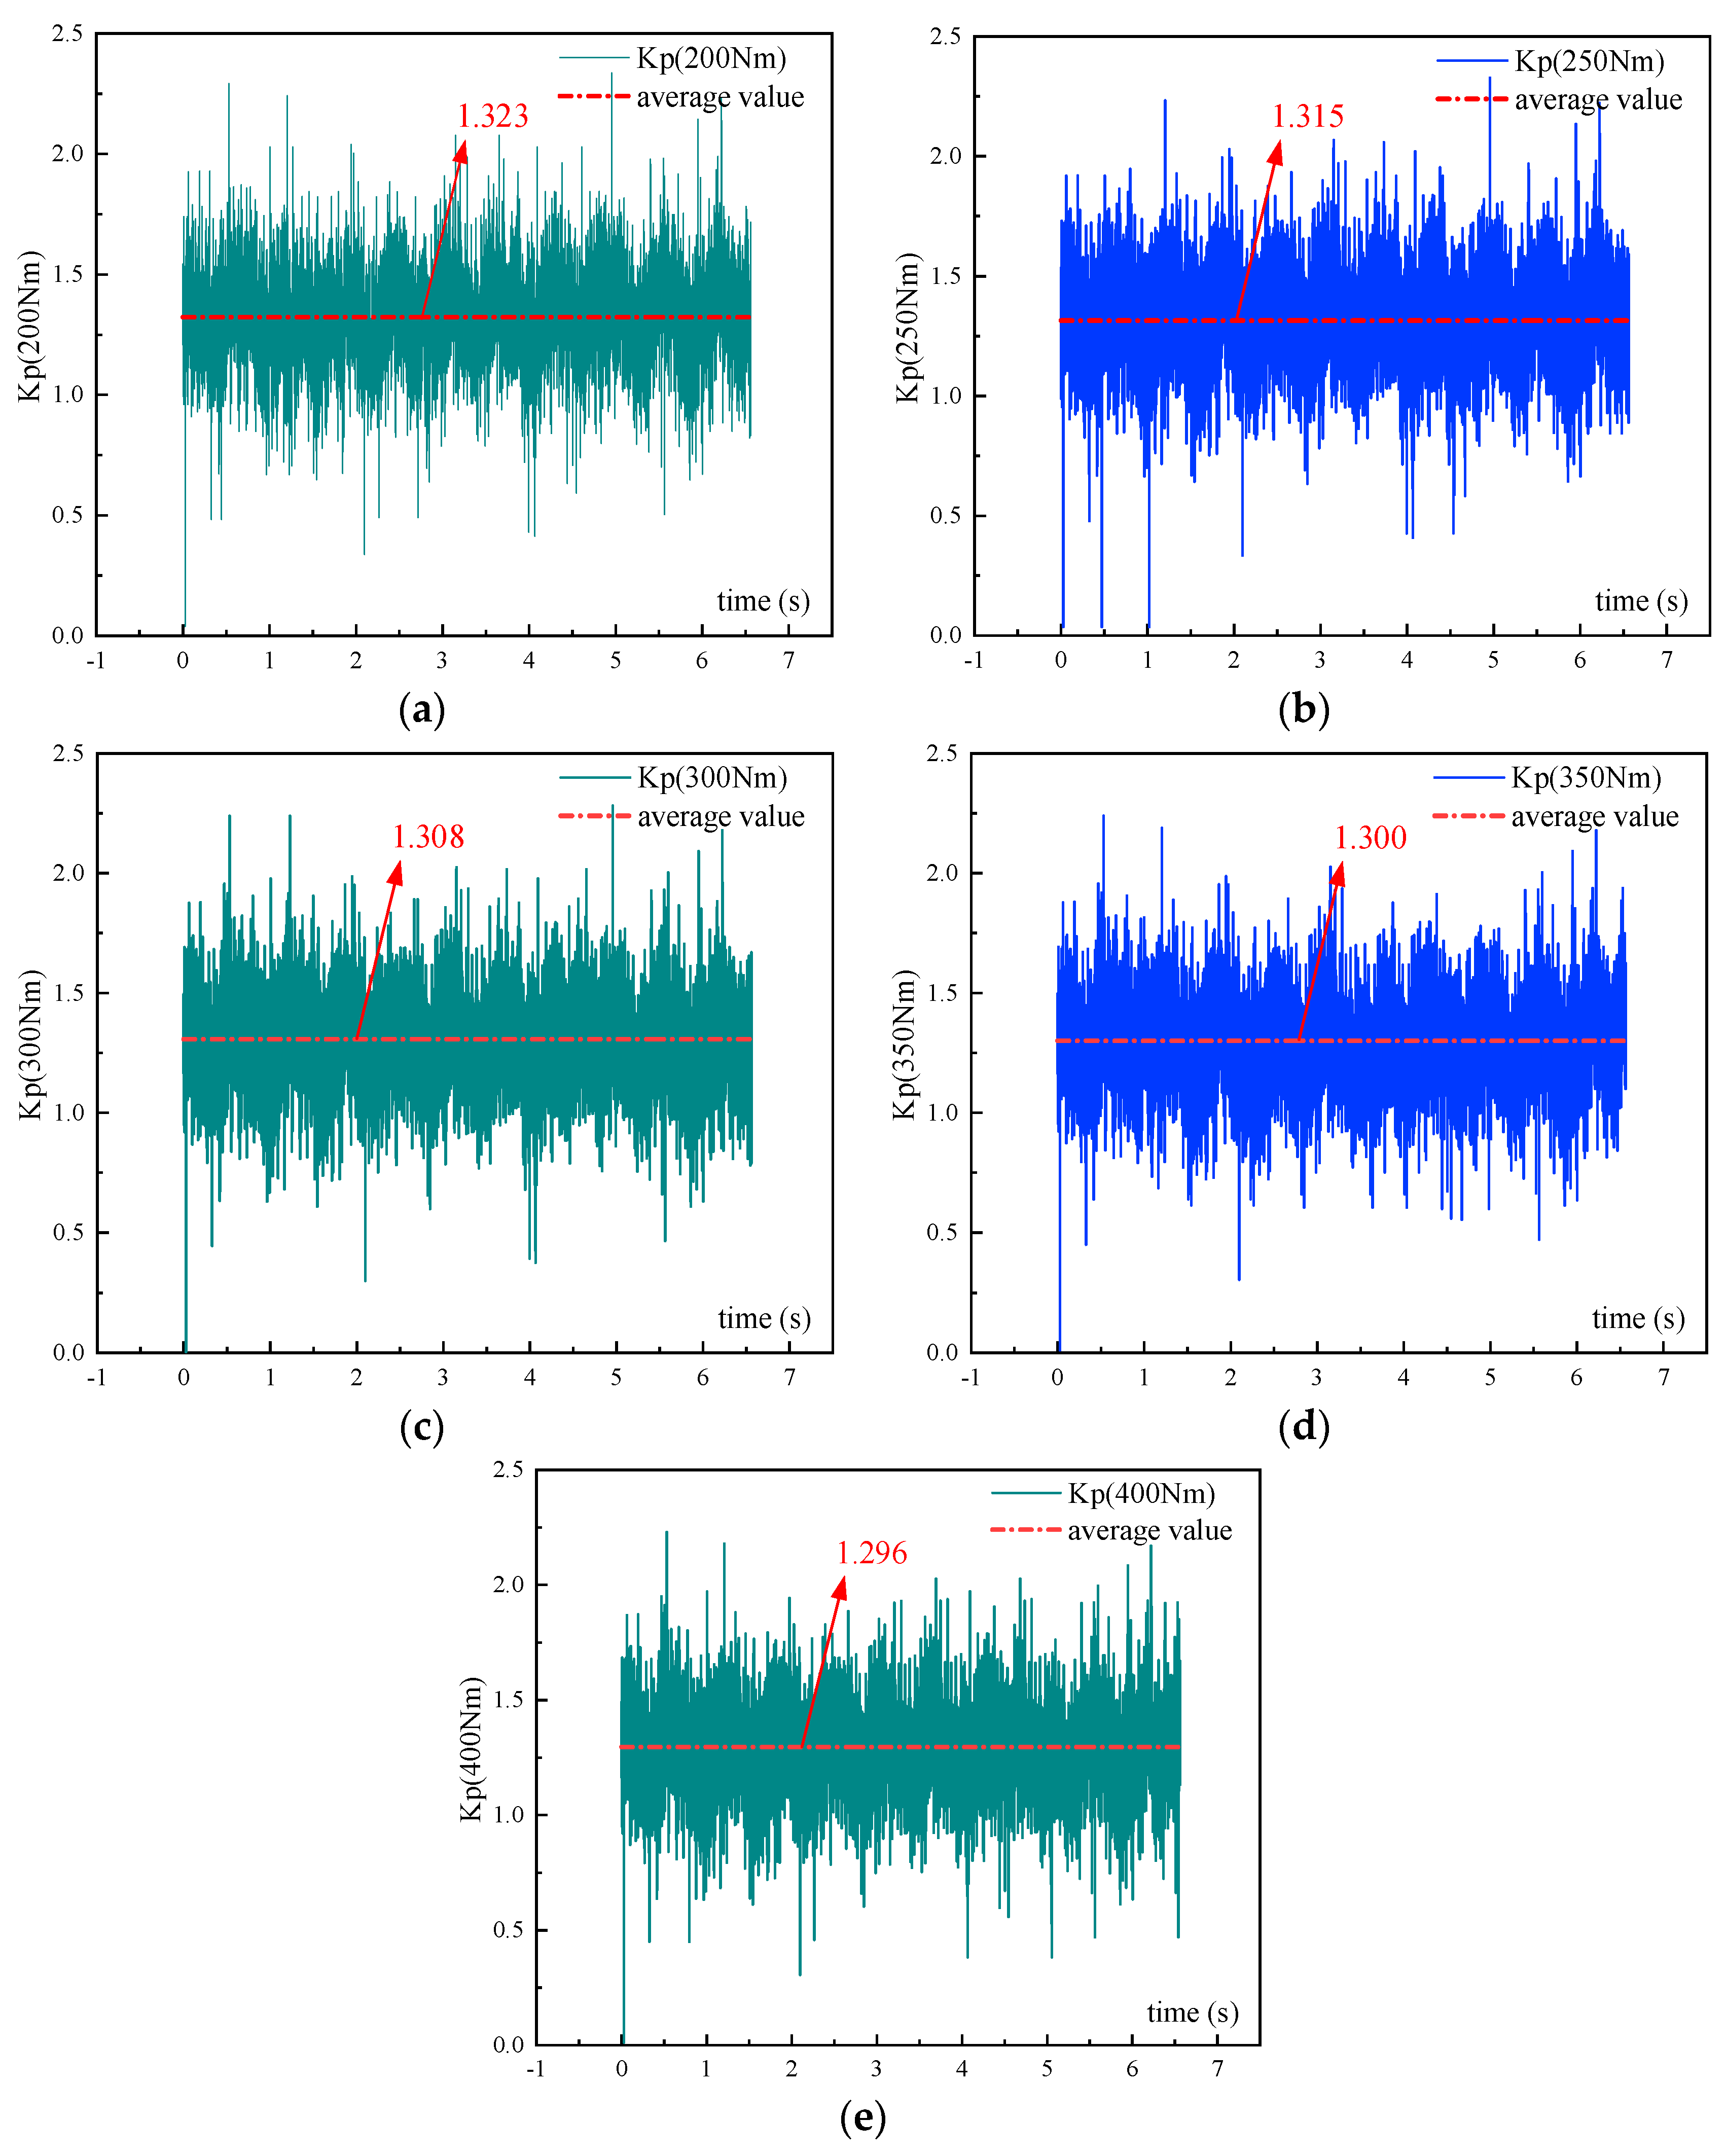
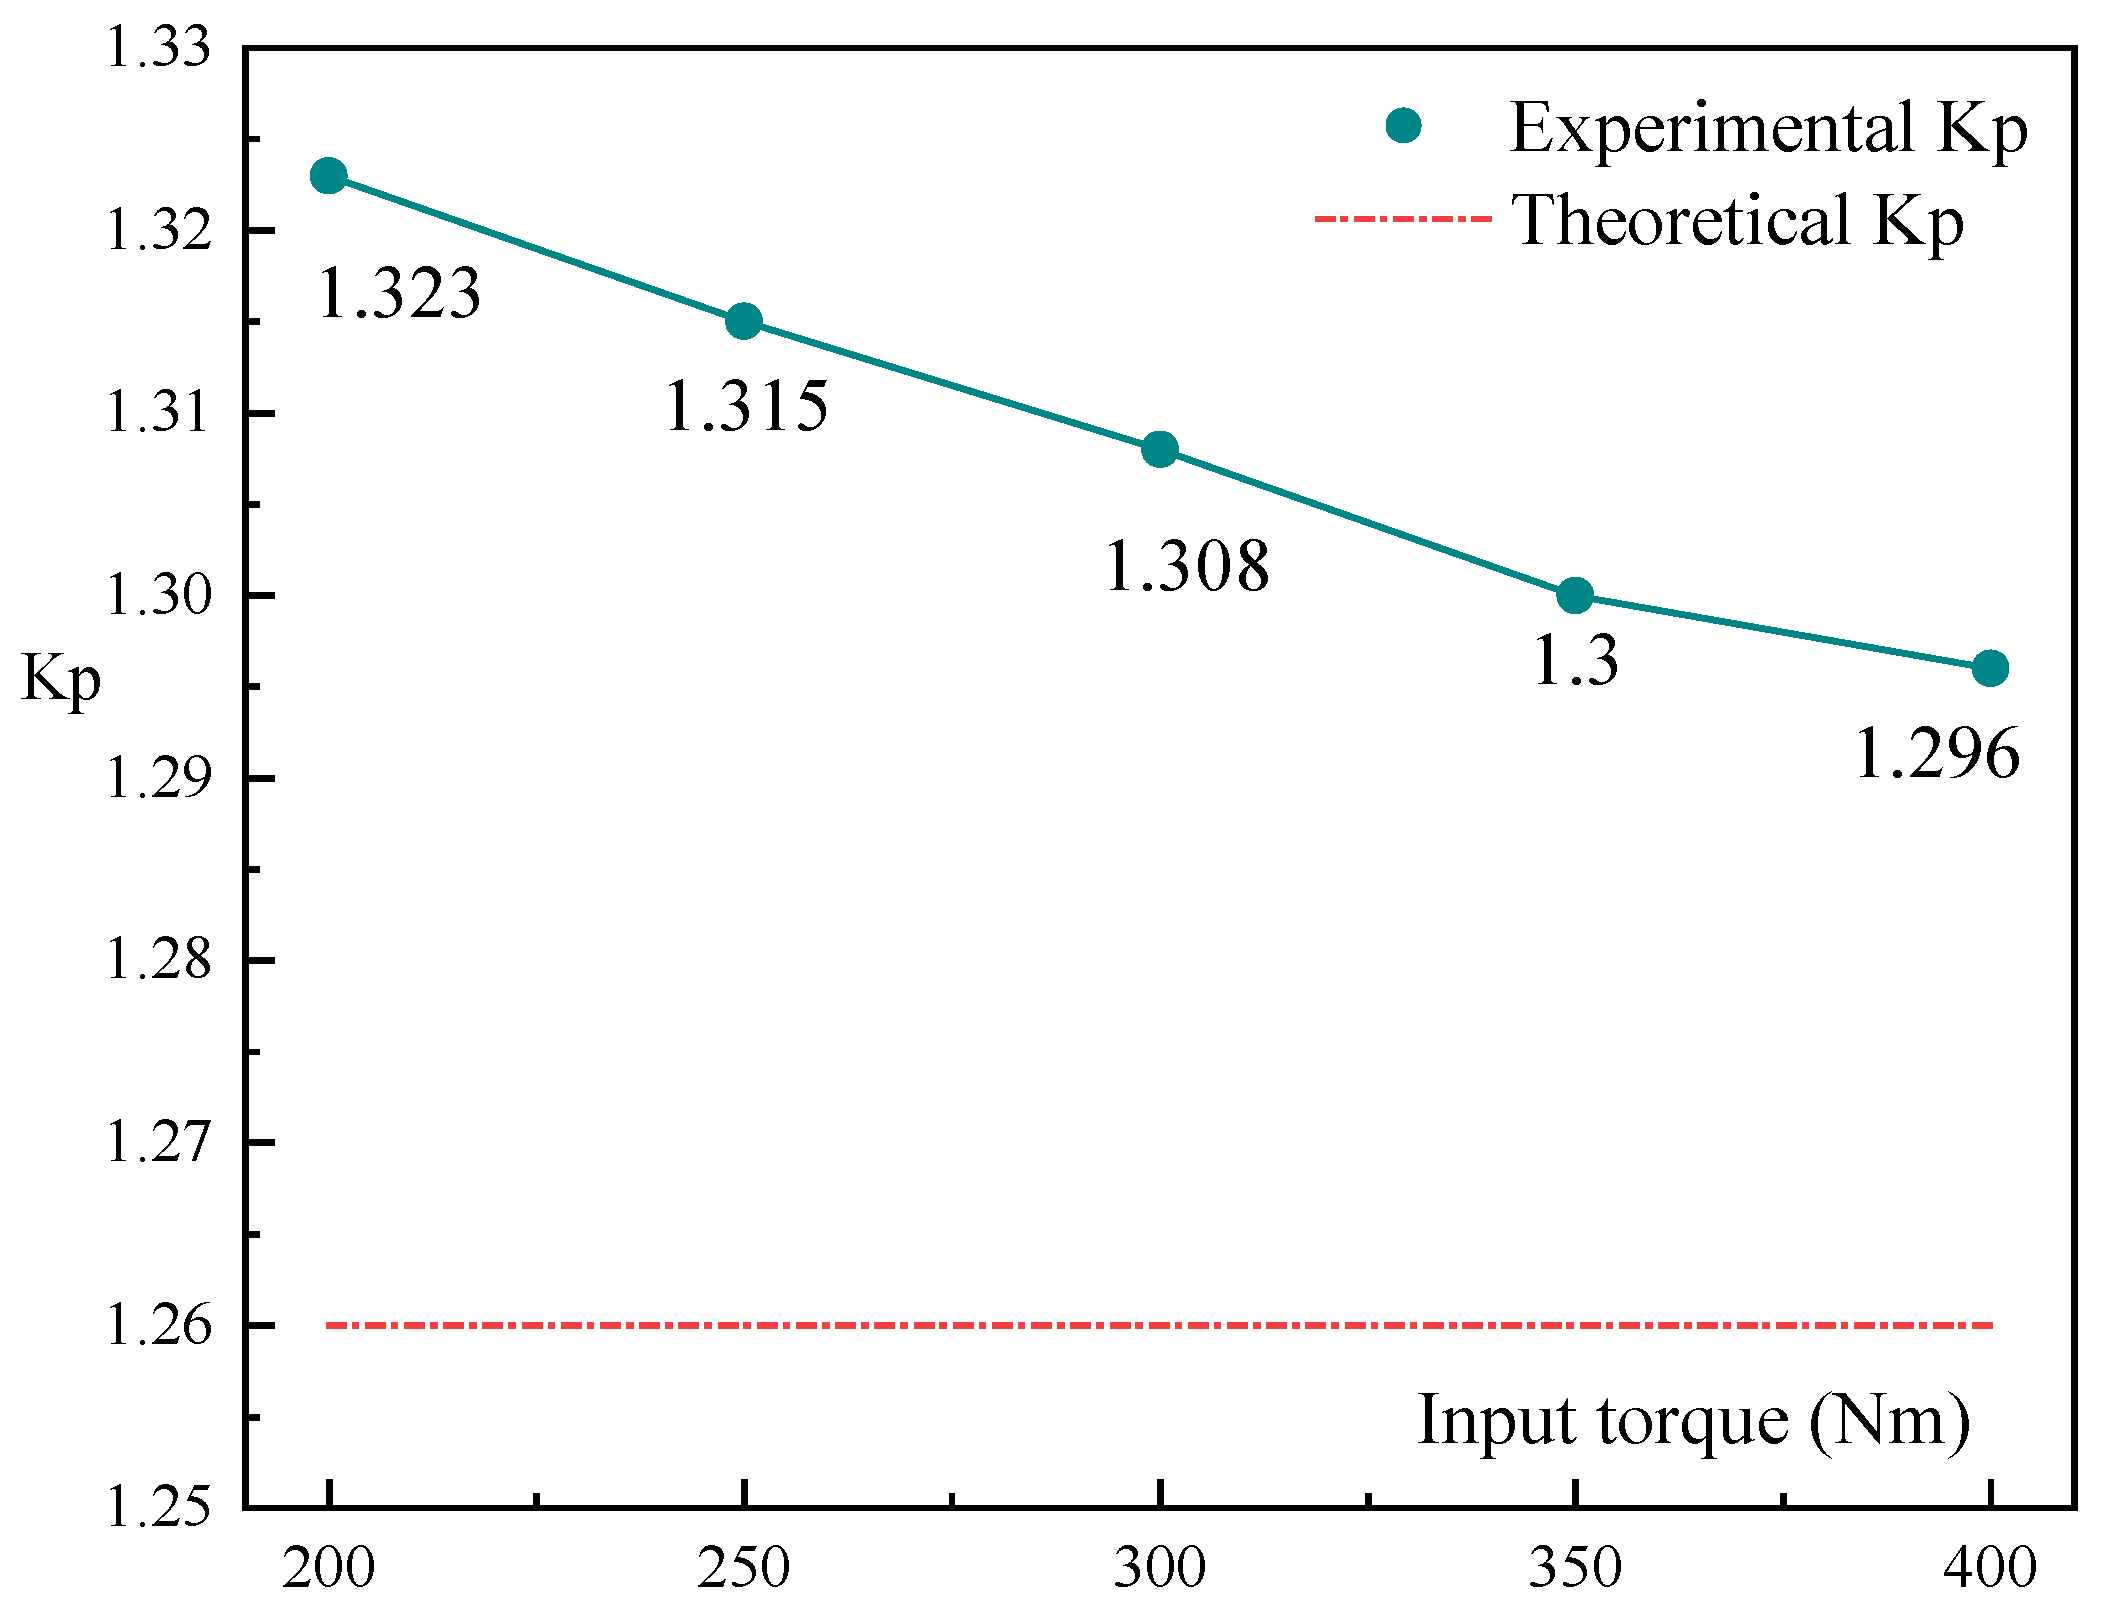
The uniform load coefficient test data are shown in Figure 13, and the relationship between the input torque and the average value of the uniform load coefficient is shown in Figure 14.
From Figure 14, it can be seen that the maximum system uniform load coefficient is 1.323, and with a theoretically calculated equalization factor of 1.259, this result exceeds the theoretical uniform load coefficient by 0.064, and the test-measured uniform load coefficient exceeds the theoretical value by 5.08%. The error was 6.61% compared to the uniform load coefficient calculated from the measured backlash. According to the experimental data, it can be seen that the larger the input torque is, the lower the equal load coefficient is. The difference between the elastic deflection angles of the two branches decreases as the torque increases, resulting in a more uniform load distribution of the system. Due to the input torque limitation, the system load equalization performance can be improved by reducing the elastic shaft torsional stiffness of the branch with a large backlash.
6. Conclusions
- (1)
- From the tolerance contribution degree, it can be seen that T3 is the output shaft 2 large gear tooth thickness deviation and T8 is the input shaft 1 two gear phase angle deviation. Tolerance T3 is the center distance error of the first stage gear; tolerance T8 is the phase angle error of the first and second stage gear; the error value of the center distance and phase angle is consistent with the direction of the backlash, and at the same time, due to the large value of the center distance error, it has the greatest impact on the backlash, followed by the phase angle error. These two design tolerances can be reduced appropriately in the theoretical design stage to obtain a more reasonable equal load factor.
- (2)
- The small-displacement-based Jacobian spin theory was used for three-dimensional tolerance modelling, and a three-dimensional tolerance analysis method was used to derive the backlash distribution law, which is of great significance for the optimization of gear system parameters. Meanwhile, the load balancing performance of the system can be improved by reducing the torsional stiffness of the branch elastic shaft with large tooth backlash.
- (3)
- The three-dimensional tolerance theory analysis method can calculate the backlash range more accurately, and utilizes the backlash range to calculate the uniform load coefficient range. The test-measured uniform load coefficient exceeded the theoretical range by 5.08%. The error was 6.61% compared to the uniform load coefficient calculated from the measured backlash. This method of calculating the uniform load coefficient has a greater reference value.
Replication of Results: Both the backlash results and the mean load factor results in this paper can be reproduced using the data and equations in the research.
Author Contributions
H.Y. collected and organized the data, conceived and designed the analysis, and conceived and wrote the paper; W.S. collected and organized the data and revised the paper; Z.S. contributed to writing and revisions. All authors have read and agreed to the published version of the manuscript.
Funding
The author declares that no funds, grants, or other support were received during the preparation of this manuscript.
Institutional Review Board Statement
Not applicable.
Informed Consent Statement
Not applicable.
Data Availability Statement
The original contributions presented in the study are included in the article, further inquiries can be directed to the corresponding authors.
Acknowledgments
The authors would like to thank Shi Wankai and Zhenhao Su of Chongqing University for their contribution to this work.
Conflicts of Interest
The authors declare no conflict of interest.
Appendix A

Table A1.
Tolerance dimensions of each part.
| Component | Serial Number | Dimensional Tolerance | Position Tolerance |
|---|---|---|---|
| First input shaft | 1, 2 |  | |
| 3 | / |  | |
| 5, 6 | | ||
| 37 | / | ||
| Left idler shaft | 7, 8, 10, 11 | | |
| 9 | / | | |
| First output shaft | 12, 13, 15, 16 | | |
| 14 | / | | |
| Second output shaft | 17, 18, 20, 21 | | |
| 19 | / | | |
| Housing | 22, 23 |  | |
| 24, 25 | | ||
| 26, 27 | | ||
| 28, 29, 32, 33 |  | ||
| 30, 31 | | ||
| 34, 35, 36 | / |
Table A2.
Housing and shaft parallel chain conversion to serial chain parameters.
| /mm | /mm | /mm | /mm | /mm | /mm | |
|---|---|---|---|---|---|---|
| 74 | 121.5 | 24 | 145.5 | 0.051 | 0.046 | |
| 224.5 | 273 | 19 | 292 | 0.043 | 0.039 | |
| 66.5 | 273 | 19 | 292 | 0.043 | 0.039 | |
| 63.5 | 120.5 | 16 | 136.5 | 0.0415 | 0.039 | |
| 74 | 121.5 | 24 | 145.5 | 0.051 | 0.046 |
Table A3.
SDT for each tolerance of the gearbox.
| Tolerance | Type | Small-Displacement Torsor |
|---|---|---|
Table A4.
Jacobian matrix for each tolerance.
| 0→7 | ||||
| 0→9 | ||||
| 0→10 | ||||
| 0→11 | ||||
| 0→13 | ||||
| 0→20 | ||||
| 0→27 | ||||
| 0→28 | ||||
| 0→29 | ||||
| 0→30 | ||||
| 0→31 | ||||
| 0→32 | ||||
| 0→33 | ||||
| 0→42 | ||||
| 0→43 | ||||
| 0→50 | ||||
| 0→52 | ||||
| 0→53 |
References
- Krantz, T.L. A Method to analyze and optimize the load sharing of split path transmissions. Technical Report. In Proceedings of the International Power Transmission and Gearing, San Diego, CA, USA, 6–10 October 1996. [Google Scholar]
- Krantz, T.L.; Delgado, I.R. Experimental study of splitpath transmission load sharing. In Proceedings of the International Power Transmission and Gearing Conference, San Diego, CA, USA, 6–9 October 1996. [Google Scholar]
- Gmirya, Y. Multi-Pat h Rotary Wing Aircraft Gearbox. US Patent 7,918,146, 5 April 2011. [Google Scholar]
- Yuriy, G.; Shulin, H.; Gregory, B. Leighleslie load sharing test of the ch-53k split torque main gearbox. In Proceedings of the American Helicopter Society 65th Annual Forum, Grapevine, TX, USA, 27–29 May 2009; pp. 977–986. [Google Scholar]
- Dong, H.; Fang, Z.-D.; Wang, B.-B.; Du, J.-F. Load-sharing characteristics of gear train with dual power split based on deflection compatibility. J. South China Univ. Technol. 2012, 40, 18–23. [Google Scholar]
- Dong, H.; Fang, Z.; Du, J. Static load sharing characteristics analysis for power split transmission system. J. Harbin Inst. Technol. 2013, 45, 6. [Google Scholar]
- Guanghu, J.; Wei, R.; Rupeng, Z. Influence of torsional stiffness on load sharing characteristics of power split transmission system. J. Aerosp. Power 2019, 34, 2478–2489. [Google Scholar]
- Gui, Y.F.; Zhu, R.P.; Jin, G.H.; Li, Z.J. Dynamic and load sharing characteristic analysis of a nonlinear cylindrical gear split-torque transmission system with backlash. J. Vib. Shock. 2014, 33, 177–184. [Google Scholar]
- Li, Z.; Wang, S.; Li, F.; Peng, Q.; Li, J. Research on matching conditions of coaxial six-branch split-torsion herringbone gear transmission system. Xibei Gongye Daxue Xuebao J. Northwestern Polytech. Univ. 2021, 39, 341–349. [Google Scholar] [CrossRef]
- Isabelle, C.J.; Kish, J.G.; Stone, R.A. Elastomeric Load Sharing Device. US Patent 5,113,713, 19 May 1992. [Google Scholar]
- White, G. Design study of a split-torque helicopter transmission. Proc. Inst. Mech. Eng. Part G J. Aerosp. Eng. 1998, 212, 117–123. [Google Scholar] [CrossRef]
- Gmirya, Y. Split Torque Gearbox for Rotary Wing Aircraft with Translational Thrust System. US Patent US7413142B2, 30 November 2006. [Google Scholar]
- Gmirya, Y.; Alulis, M.; Palcic, P.; Leigh, L.; Navairsyscom, H.Q. Design and development of a modern transmission baseline configuration of the CH-53K drive system. In Proceedings of the American Helicopter Society 67th Annual Forum, Virginia Beach, VA, USA, 2–4 May 2011; The American Helicopter Society International: Virginia Beach, VA, USA, 2011; pp. 2323–2334. [Google Scholar]
- Gui, Y.F.; Zhu, R.P.; Fu, B.B.; Li, H.F.; Li, Z.J. Impact of torsional stiffness on dynamic load sharing coefficient of two-input cylindrical gear split-torque transmission system. Hangkong Dongli Xuebao J. Aerosp. Power 2014, 29, 2264–2272. [Google Scholar]
- Hu, Z.; Tang, J.; Wang, Q.; Chen, S.; Qian, L. Investigation of nonlinear dynamics and load sharing characteristics of a two-path split torque transmission system. Mech. Mach. Theory 2020, 152, 103955. [Google Scholar] [CrossRef]
- Desrochers, A.; Ghie, W.; Laperriere, L. Application of a unified jacobian—Torsor model for tolerance analysis. J. Comput. Inf. Sci. Eng. 2003, 3, 2–14. [Google Scholar] [CrossRef]
- kumar Amda, S.; Srinivasulu, N.V.; Krishna, L.S. A review on tolerance analysis approaches in mechanical assemblies. Mater. Today Proc. 2023, in press. [Google Scholar]
- Liu, S.; Yu, H.; Xia, Z.; Chen, K. A new virtual functional element method for deviation prediction of assembled structures with parallel connection chain. CIRP J. Manuf. Sci. Technol. 2024, 48, 42–45. [Google Scholar] [CrossRef]
- Laperri, L.; ElMaraghy, H.A. Tolerance analysis and synthesis using jacobian transforms. CIRP Ann. 2000, 49, 359–362. [Google Scholar] [CrossRef]
- Zuo, X.; Li, B.; Yang, J.; Jiang, X. Application of the jacobian–torsor theory into error propagation analysis for machining processes. Int. J. Adv. Manuf. Technol. 2013, 69, 1557–1568. [Google Scholar] [CrossRef]
- Weihua, N.; Zhenqiang, Y. Integrating cylindricity error into tolerance analysis of precision rotary assemblies using jacobian–torsor model. Proc. Inst. Mech. Eng. Part C J. Mech. Eng. Sci. 2013, 227, 2517–2530. [Google Scholar] [CrossRef]
- Desrochers, A.; Rivi, A. A matrix approach to the representation of tolerance zones and clearances. Int. J. Adv. Manuf. Technol. 1997, 13, 630–636. [Google Scholar] [CrossRef]
- Bruyere, J.; Dantan, J.-Y.; Bigot, R.; Martin, P. Statistical tolerance analysis of bevel gear by tooth contact analysis and monte carlo simulation. Mech. Mach. Theory 2007, 42, 1326–1351. [Google Scholar] [CrossRef]
- Zeng, W.; Rao, Y.; Wang, P.; Yi, W. A solution of worst-case tolerance analysis for partial parallel chains based on the unified jacobian-torsor model. Precis. Eng. 2017, 47, 276–291. [Google Scholar] [CrossRef]
- Yang, Z.; Hussian, T.; Popov, A.A.; McWilliam, S. A comparison of different optimization techniques for variation propagation control in mechanical assembly. IOP Conf. Ser. Mater. Sci. Eng. 2011, 26, 012017. [Google Scholar] [CrossRef]
- Yang, Z.; Hussain, T.; Popov, A.A.; McWilliam, S. Novel optimization technique for variation propagation control in an aero-engine assembly. Proc. Inst. Mech. Eng. Part B J. Eng. Manuf. 2011, 225, 100–111. [Google Scholar] [CrossRef]
- Yang, Z.; Popov, A.A.; McWilliam, S. Variation propagation control in mechanical assembly of cylindrical components. J. Manuf. Syst. 2012, 31, 162–176. [Google Scholar] [CrossRef]
- Hussain, T.; McWilliam, S.; Popov, A.A.; Yang, Z. Geometric error reduction in the assembly of axi-symmetric rigid components: A two-dimensional case study. Proc. Inst. Mech. Eng. Part B J. Eng. Manuf. 2012, 226, 1259–1274. [Google Scholar] [CrossRef]
- Yang, Z.; McWilliam, S.; Popov, A.A.; Hussain, T. A probabilistic approach to variation propagation control for straight build in mechanical assembly. Int. J. Adv. Manuf. Technol. 2013, 64, 1029–1047. [Google Scholar] [CrossRef]
- Jin, S.; Ding, S.; Li, Z.; Yang, F.; Ma, X. Pointbased solution using jacobian-torsor theory into partial parallel chains for revolving components assembly. J. Manuf. Syst. 2018, 46, 46–58. [Google Scholar] [CrossRef]
- Chen, H.; Jin, S.; Li, Z.; Lai, X. A modified method of the unified jacobian-torsor model for tolerance analysis and allocation. Int. J. Precis. Eng. Manuf. 2015, 16, 1789–1800. [Google Scholar] [CrossRef]
- Chen, H.; Jin, S.; Li, Z.; Lai, X. A solution of partial parallel connections for the unified jacobian–torsor model. Mech. Mach. Theory 2015, 91, 39–49. [Google Scholar] [CrossRef]
- Chen, H.; Jin, S.; Li, Z.; Lai, X. A comprehensive study of three dimensional tolerance analysis methods. Comput. Aided Des. 2014, 53, 1–13. [Google Scholar] [CrossRef]
- Binbin, C.; Meifa, H.; Zhiyue, W.; Jianguo, F.; Changlin, W.U. Research of assembly tolerance modeling method based on actual working condition. Mach. Tool Hydraul. 2016, 44, 116–120. [Google Scholar]
- GB/T 3480-1997; Measures for Calculation of Load Carrying Capacity of Involute Cylindrical Gear. The State Bureau of Quality and Technical Supervision: Beijing, China, 1997.
- ISO/TR10064-2:1996; Practical Test Procedure for Cylindrical Gears Part 2: Inspection of Radial Deviation, Ellipticity, Tooth Thickness and Tooth Clearance. ISO: Geneva, Switzerland, 1996.
Figure 1.
Gear meshing partial parallel dimensional chain diagram.

Figure 2.
Geometric relationship between center distance and gear 2 tooth thickness deviation.

Figure 3.
Flowchart of three-dimensional tolerance analysis of gearbox backlash.

Figure 4.
Schematic diagram of the transmission structure of a double-input reverse-rotating gearbox.
Figure 4.
Schematic diagram of the transmission structure of a double-input reverse-rotating gearbox.

Figure 5.
Tolerance specification of each part of gearbox.

Figure 6.
Schematic diagram of gear meshing.

Figure 7.
Characteristic coordinate system of dual-input counter-rotating gearbox.

Figure 8.
Schematic diagram of the left dimensional chain of the gearbox.

Figure 9.
Contribution of each dimensional tolerance to the backlash closure ring.

Figure 10.
Dual-input counter-rotating gearbox test stand.

Figure 11.
Dual-input counter-rotating gearbox backlash measurement physical diagram.

Figure 12.
Gearbox equal load test schematic.

Figure 13.
(a–e) Graph of the test data of the uniform load coefficient.

Figure 14.
Input torque versus equal load factor.

Table 1.
Basic parameters of dual-input counter-rotating gearbox.
| Gear | Number of Teeth | Normal Module | Pressure Angle | Helix Angle | Face Width | Center Distance | Tooth Thickness Deviation |
|---|---|---|---|---|---|---|---|
| Z | /mm | /° | /° | b/mm | /mm | Asn/mm | |
| Gl1 Gr1 | 30 | 4.0 | 20 | 16.26 | 45 | 350 | 0.03 |
| Go1 | 138 | 40 | 0.08 | ||||
| Gl2 Gr2 | 30 | 3.0 | 20 | 12.27 | 45 | 92 | 0.03 |
| Gd1 Gd2 | 30 | 45 | 0.03 | ||||
| Go2 | 138 | 40 | 258 | 0.06 |
Table 2.
Calculation results of .
| N | Closed-Loop z-Translation Coordinates/mm | Closed-Loop z-Rotation Coordinates/mm | /mm | ||
|---|---|---|---|---|---|
| 1000 | (−0.405, 0.391) | (−0.047, 0.048) | (−0.0059, 0.0062) | (−0.0042, 0.0041) | 0.4107 |
| 5000 | (−0.402, 0.399) | (−0.049, 0.049) | (−0.0058, 0.0058) | (−0.0042, 0.0042) | 0.4191 |
| 10000 | (−0.397, 0.395) | (−0.047, 0.047) | (−0.0059, 0.0059) | (−0.0042, 0.0042) | 0.4146 |
| 15000 | (−0.401, 0.399) | (−0.047, 0.047) | (−0.0059, 0.0059) | (−0.0042, 0.0042) | 0.4185 |
| 20000 | (−0.397, 0.398) | (−0.047, 0.047) | (−0.0059, 0.0059) | (−0.0042, 0.0043) | 0.4173 |
| 25000 | (−0.396, 0.396) | (−0.047, 0.047) | (−0.0059, 0.0059) | (−0.0042, 0.0042) | 0.4150 |
Table 3.
Actual backlash measurement data.
| 1 | 2 | 3 | 4 | 5 | 6 | 7 | 8 | Average | |
|---|---|---|---|---|---|---|---|---|---|
| Gd1 | 0.24 | 0.25 | 0.25 | 0.24 | 0.25 | 0.26 | 0.26 | 0.26 | 0.251 |
| Gd2 | 0.42 | 0.46 | 0.39 | 0.38 | 0.42 | 0.37 | 0.42 | 0.41 | 0.410 |
Table 4.
Multi-case torque measurement results.
| Same Torque Input for Left and Right | Measurement Point 1 Torque/N.m | Measurement Point 2 Torque/N.m | |
|---|---|---|---|
| 100 | 0 | 159.255 | / |
| 150 | 0 | 273.940 | / |
| 200 | 68.417 | 133.560 | 1.323 |
| 250 | 85.695 | 164.660 | 1.315 |
| 300 | 103.664 | 196.106 | 1.308 |
| 350 | 123.015 | 228.243 | 1.300 |
| 400 | 140.708 | 259.344 | 1.296 |
Disclaimer/Publisher’s Note: The statements, opinions and data contained in all publications are solely those of the individual author(s) and contributor(s) and not of MDPI and/or the editor(s). MDPI and/or the editor(s) disclaim responsibility for any injury to people or property resulting from any ideas, methods, instructions or products referred to in the content. |
© 2024 by the authors. Licensee MDPI, Basel, Switzerland. This article is an open access article distributed under the terms and conditions of the Creative Commons Attribution (CC BY) license (https://creativecommons.org/licenses/by/4.0/).
Share and Cite
MDPI and ACS Style
Yu, H.; Shi, W.; Su, Z. Research on the Calculation Method for the Load Distribution of the Dual-Input Counter-Rotating Transmission System. Appl. Sci. 2024, 14, 2899. https://doi.org/10.3390/app14072899
AMA Style
Yu H, Shi W, Su Z. Research on the Calculation Method for the Load Distribution of the Dual-Input Counter-Rotating Transmission System. Applied Sciences. 2024; 14(7):2899. https://doi.org/10.3390/app14072899
Chicago/Turabian StyleYu, He, Wankai Shi, and Zhenhao Su. 2024. "Research on the Calculation Method for the Load Distribution of the Dual-Input Counter-Rotating Transmission System" Applied Sciences 14, no. 7: 2899. https://doi.org/10.3390/app14072899
Note that from the first issue of 2016, this journal uses article numbers instead of page numbers. See further details here.