Article

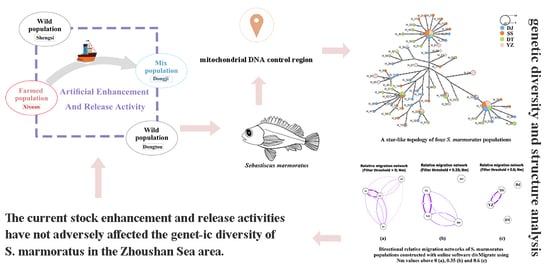
Does the Artificial Enhancement and Release Activity Affect the Genetic Diversity of Marbled Rockfish Sebastiscus marmoratus in Zhoushan Waters?

1
National Engineering Research Center for Marine Aquaculture, Zhejiang Ocean University, Zhoushan 316022, China
2
School of Fishery, Zhejiang Ocean University, Zhoushan 316022, China
3
Key Laboratory of Sustainable Utilization of Technology Research for Fisheries Resources of Zhejiang Province, Scientific Observing and Experimental Station of Fishery Resources for Key Fishing Grounds, Ministry of Agriculture and Rural Affairs of China, Zhejiang Marine Fisheries Research Institute, Zhoushan 316021, China
*
Authors to whom correspondence should be addressed.
These authors contributed equally to this paper.
Fishes 2024, 9(5), 161; https://doi.org/10.3390/fishes9050161
Submission received: 29 March 2024 / Revised: 24 April 2024 / Accepted: 26 April 2024 / Published: 28 April 2024

Abstract

:
Artificial enhancement and release activity is an important method in the restoration of fishery resources. In order to understand the possible genetic effect of hatchery-released populations on wild populations during the artificial enhancement and release activities of Sebastiscus marmoratus in Zhoushan waters, we utilized mitochondrial DNA control region sequences to examine the genetic diversity in four S. marmoratus populations, including one farmed population, one released population and two wild populations. A total of 68 haplotypes from 123 individuals were detected, including 3 shared haplotypes. Haplotype diversity ranged from 0.944 to 0.980, with a mean of 0.966. The nucleotide diversity ranged from 0.020 to 0.025, with a mean of 0.022. Analysis of Molecular Variance (AMOVA) indicated that the primary genetic variation occurs within populations and the index of genetic differentiation between populations (FST) among the four populations showed no differentiation. The results indicate that the current artificial enhancement and release has not impacted the S. marmoratus population in Zhoushan waters. Continued long-term monitoring is essential to protect the high-quality germplasm resources of S. marmoratus.
Key Contribution: This article discusses the influences of genetic diversity of Sebastiscus marmoratus caused by the artificial enhancement and release activity in Zhoushan water and provides data on future artificial enhancement and release activity.

Graphical Abstract

1. Introduction

Artificial enhancement and release involve the use of artificial methods to introduce aquatic animals, including parents and fertilized eggs, into natural waters. This practice aims to bolster population numbers, restore the structure of aquatic ecosystems, and ultimately enhance fishery resources, improve water quality, and maintain ecological equilibrium [1]. Widely adopted globally, it serves as an effective strategy for replenishing fishery resources and enhancing productivity [2]. The inception of artificial enhancement and release dates back to the early 20th century when countries such as the United States, the United Kingdom, and Norway pioneered these activities, with China following suit in the 1970s and remarkable results of marine fishery resource enhancement of China has been achieved in the last 50 years [3]. The stocking and release areas in China are mainly concentrated in the nearshore harbors, bays, and tidal flats of the Bohai Sea, Yellow Sea, East China Sea, and South China Sea. In the Yellow Sea and Bohai Sea, the execution of Penaeus chinensis artificial enhancement and release initiatives has successfully mitigated the fishing pressure on the natural resources [2]. In the East China Sea, the implementation of artificial enhancement and release activities for Sepiella maindron has played a role in the restoration of S. maindron resources in the northern waters of Zhejiang province [4]. Despite its positive impact on supplementing resources and boosting production capacity, the burgeoning practice of artificial enhancement and release has prompted increased scrutiny regarding its effects on wild populations in restocking areas. Consequently, evaluating the efficacy of restocking has become a paramount concern. This evaluation, centered around the artificial enhancement and release activities, delves into the economic, ecological, and social benefits within a defined timeframe post-release, constituting the significant aspect of artificial enhancement and release [5]. Marking techniques emerge as the primary method for assessing the effectiveness of artificial enhancement and release. In the context of fish as the subject of application, marking technology falls into the following four categories: physical markers, chemical markers, biological markers, and molecular markers [6]. Molecular markers, as exemplified by the exploration of Laikre et al. [7], prove invaluable in analyzing genetic considerations. They address questions concerning the potential for gene exchange during large-scale reproduction of fishery resources, potential loss of original heritage in wild populations, transmission of mutation characteristics and habitat adaptability, and alterations in community composition and structure.
The Zhoushan Fishing Ground is situated at the estuaries of the Yangtze River, Qiantang River, and Yongjiang River, precisely at the pivotal intersection of the Taiwan Warm Current and the Yellow Sea Cold Water Mass. Due to its unique geographical location and abundant nutrient content, the Zhoushan Fishing Ground has become an ideal habitat for the growth and reproduction of various fish species [8,9]. In recent years, the intensive development of the fishing industry and increased fishing activities have led to a significant depletion of fisheries resources in the Zhoushan Fishing Ground, resulting in a sharp decline in the population numbers of economically valuable fish species. With the continuous increase in fishing pressure, some crucial fishery resources face the threats of endangerment and overfishing, including economically vital species such as Sebastiscus marmoratus, Cuvier, 1829 [10]. The marbled rockfish, S. marmoratus, belongs to the class Osteichthyes, order Scorpaeniformes, and family Scorpaenidae. It is a typical warm-water demersal fish [11], mainly distributed in the warm water zone of the central and southern coasts of the Northwest Pacific Ocean [12], especially in the Bohai sea, the Yellow sea, the East China sea and the South China sea in China. The S. marmoratus, renowned for its delicious and nutritious flesh, holds significant economic value, showcasing typical characteristics of the Scorpaenidae family [13]. The S. marmoratus typically reaches a size of 15 to 20 cm, although some individuals are known to grow larger, reaching 30 to 40 cm [14]. It tends to have a sedentary lifestyle, with a relatively small range of activity, usually within one kilometer [15]. However, with the changing seasons, it exhibits slight migratory behavior over short distances, following certain seasonal patterns. During the cold seasons of late autumn and early winter, it tends to migrate towards shallow water areas, while in spring and summer seasons, it returns to deep-water areas [16]. The S. marmoratus stands out due to its unique reproductive strategy of ovoviviparity. In this distinctive method, the eggs are fertilized within the mother’s body, retained, and then develop in the reproductive system of the mother [17]. This reproductive adaptation provides an advantage for its adaptability in specific ecological environments. Sebastiscus marmoratus is also a typical reef-based fish in the Zhoushan sea area and plays a crucial role as one of the primary breeding species in the construction of marine ranches [18]. In recent years, Zhejiang province has actively promoted the release of S. marmoratus in the waters of Zhoushan. In order to carry out artificial enhancement and release more effectively in the Zhoushan sea area without causing adverse effects on the ecosystem, Hao et al. [19] conducted an estimation of the ecological carrying capacity for S. marmoratus using the ecopath model. The determined ecological carrying capacity for S. marmoratus in the Zhoushan sea area was found to be 0.00795 t/km2. Consequently, it is recommended that the stocking quantity for S. marmoratus should be 11,582,000 individuals. According to the reseach of Chen et al. [20], approximately 706,000 S. marmoratus were released in the past five years.
In order to assess whether the artificial enhancement and release activities affect the genetic diversity of S. marmoratus in Zhoushan waters, we used the mitochondrial DNA control region as a marker to analysis the genetic diversity and structure of the two natural wild populations (Shengsi and Dongtou) to assess whether the artificial enhancement and release activity (Dongji) is affected by the introduction of farmed populations (Xixuan). The objective of this study could potentially hide or maintain the natural signal of local genetic variability of S. marmoratus. Understanding the genetic diversity within the region has significant implications for the advancement and management of aquatic organisms, aiding in the mitigation of resource decline and promoting the sustainable development of fishery resources.

2. Materials and Methods

2.1. Experimental Animals and Sampling

A total of 123 samples were collected from four locations (Shengsi (30), Dongji (32), Xixuan (31) and Dongtou (30)). Among these locations, samples from Shengsi and Dongtou were obtained through sea fishing, as no proliferation or release activities of S. marmoratus were detected in these areas. Therefore, these samples are referred to as wild populations, abbreviated as SS and DT, respectively. Samples from Dongji were also obtained through sea fishing, but artificial enhancement and release activities of S. marmoratus were recorded in this area, making it a mixed population, abbreviated as DJ. The samples from Xixuan originated from a local aquaculture farm and serve as the primary source of most of the released S. marmoratus fingerlings, thus referred to as the farming population, abbreviated as YZ (Table 1, Figure 1). All experimental samples were approved by the State Oceanic Administration of China and Ethics Committee of Zhejiang Ocean University, and the procedures were conducted in accordance with national laws and regulations. The muscle tissues from samples were collected and saved in absolute alcohol with −20 °C.

2.2. DNA Extraction and Polymerase Chain Reaction

The genomic DNA of each sample was extracted using the salt-extraction procedure [21]. Subsequently, the extracted DNA was tested on 1.5% agarose gel, and the samples that passed the examination were stored in a −20 °C freezer for future use. The primers used were as follows: DL-S: 5′-CCCACCACTAACTCCCAAAGC-3′(forward) and DL-R: 5′-CTGGAAAGAACGCCCGGCATG-3′(reverse) [22]. The polymerase chain reaction (PCR) was carried out in a 25 μL volume, consisting of 12.5 μL of Taq MasterMix (Beijing Com Win Biotech Co., Ltd., Beijing, China), 1 μL of the forward primer, 1 μL of the reverse primer, 1 μL of genomic DNA, and 10 μL of ddH2O. The PCR protocol included initial denaturation for 3 min at 94 °C, followed by 40 cycles of 30 s at 94 °C for denaturation, 40 s at 52 °C for annealing, 45 s at 72 °C for extension, and a final extension for 10 min at 72 °C. The amplification products were detected and observed using 1.5% agarose gel, and subsequently sent to TSINGKE Biotech Co., Ltd. (Hangzhou, China) for bidirectional sequencing.

2.3. Data Analysis

After obtaining COI genetic sequences through PCR amplification, we first utilized the BLAST function on the online NCBI platform (http://www.ncbi.nlm.nih.gov/) for homology comparisons to ensure the accuracy of the sequences. Subsequently, we employed BioEdit v 7.2.6.1 software [23] for preliminary analysis. Through meticulous screening, potential errors arising from sequencing inaccuracies were meticulously filtered out. We selectively chose fragments displaying standard peak profiles and devoid of interference, converting them into FASTA files. Following this, MEGA-X software [24] was employed for precise sequence comparison and end-trimming, laying a robust foundation for subsequent data processing. This step is crucial to guarantee the high quality and reliability of the obtained sequence data, providing a dependable basis for further genetic analysis and subsequent research. Subsequently, the DnaSP 6 software [25] was employed to differentiate haplotypes and calculate various classical genetic parameters, such as haplotype diversity (h) and nucleotide diversity (π). For a more in-depth exploration of genetic variation, we utilized Arlequin v 3.5.2.2 software [26] to conduct Analysis of Molecular Variance (AMOVA), calculate the genetic differentiation index (FST), and perform neutrality tests among the four populations. Subsequently, a haplotype network diagram was constructed using Network 10.2.0.0 software [27], providing a visual representation of the relationships among the haplotypes. Using the MEGA-X software, we crafted phylogenetic trees that offer a holistic view of the evolutionary relationships among the analyzed sequences. To further probe the intricate patterns of gene flow, we used both R Studio and the online tool divMigrate (https://popgen.shinyapps.io/divMigrate-online/, accessed on 27 November 2023) to investigate the current dynamics of genetic exchange among diverse populations.

3. Results

In this study, sequences of 123 samples of S. marmoratus were aligned and processed, resulting in a 458bp control region sequence used for genetic analysis. The average content of A, T, C, G bases in these sequences was 35.53%, 27.71%, 19.93% and 16.83%, respectively. The content of A + T (63.24%) was significantly higher than that of G + C (36.76%), showing obvious base composition bias. Among the 123 individuals, a total of 68 different haplotypes were identified, with the SS population, DJ population, DT population, and YZ population demonstrating 22, 26, 16, and 23 haplotypes, respectively. Haplotype 6, Haplotype 7, Haplotype 18 and Haplotype 22 are shared haplotypes among the populations. Haplotype 4 is shared by the SS, DJ and DT population, excluding the YZ population. Haplotype 12 is shared by the SS, DJ and YZ population, excluding the DT population (Table 2). In this study, the haplotype diversity (Hd) across the four populations ranged from 0.944 to 0.980, with an average haplotype diversity of 0.966, indicating a high level (Hd > 0.5). The mutation sites ranged from 44 (DJ and SS) to 46 (DT), and the average nucleotide diversity (π) for all populations was 0.022, ranging from 0.020 to 0.025, also at a high level (π > 0.005). Among the four populations, the DJ population exhibited the highest Hd, while the YZ population showed the lowest. In terms of Pi, the YZ population had the highest, while the SS population had the lowest (Table 3).
The genetic distance within populations ranged from 0.021 to 0.026, while the distances between populations ranged from 0.021 to 0.025 (Table 4). Based on the S. marmoratus population origin, the S. marmoratus population was divided into several gene pools for AMOVA analysis (Table 5). The four populations were analyzed as one gene pool and the results showed that the intra-population variation accounted for 99.56% of the overall variation. The four populations were analyzed as two gene pools (SS and DT form one group, and DJ and YZ form another group) and the results showed that the intra-population variation accounted for 99.34% of the overall variation. The four populations were analyzed as three gene pools (SS and DT form one group, DJ is one group and YZ is the other) and the results showed that the intra-population variation accounted for 99.16% of the overall variation. Based on the above results, it can be concluded that genetic variation is primarily derived from interpopulation. Notably, in this experiment, the FST values between populations, excluding the YZ population, were negative. However, all average FST values between populations were less than 0.05, indicating no significant differences among the four populations. Nm values also supported the same results (Table 6, Figure 2). In the exploration of gene flow dynamics across the four distinct S. marmoratus populations, we utilized three distinct thresholds (0, 0.35, and 0.6) to construct directional relative migration networks. A careful examination of these visual representations highlights varying intensities of gene exchange among the populations. Notably, the gene flow from SS to YZ exhibits an asymmetric pattern, demonstrating greater strength compared to the flows from YZ to DJ and YZ to DT. This observed migration pattern strongly suggests an elevated level of genetic exchange between the SS and YZ populations, emphasizing their pronounced genetic similarity.
In addition, on the foundation of a star-like topological structure, haplotypes are predominantly distributed among three branches, namely Haplotypes 6, 7 and 18. Haplotype 4 is exclusive to the SS, DJ, and DT populations, while it is absent in the YZ population. No significant differences in haplotypes within these three branches were observed across the four populations (Figure 3). The phylogenetic tree based on the neighbor-joining method revealed a similar result with a star-like topological structure with no significant geographic agglomeration in the four populations. Based on population origin, the haplotypes from wild individuals tend to cluster together, as do those from individuals in the release area (Figure 4). The results of the neutral tests showed slight differences between the two methods. For Tajima’s D test, the calculated D values were −0.632, −0.412, −0.441, and 0.133 for the SS, DJ, DT, and YZ populations, respectively, with all p-values greater than 0.05. In Fu’s FS test, the calculated F values were −6.966, −11.579, −7.465, and −0.008 for the SS, DJ, DT and YZ populations, respectively. Tajima’s D value of the YZ population was greater than 0, while the other result of the neutral test was less than 0 (Table 7). Overall, the SS, DJ and DT populations exhibited significant negative selection.

4. Discussion

Currently, numerous marine fish are being augmented and released through stocking programs aimed at enhancing their biomass. However, with the widespread implementation of these activities, concerns have arisen about the potential impact of this process on the genetic diversity of released species. Studies have indicated that releasing large quantities of hatchery-reared juveniles may have detrimental effects on the genetic diversity of wild populations [7]. Araki and Schmid [28] conducted an in-depth review of 266 peer-reviewed academic papers. The findings revealed that in the field of aquaculture, the practice of releasing hatchery-reared fish fry into natural environments often leads to adverse effects on local wild fish populations. However, it is noteworthy that in specific contexts, the impact of such stocking activities on the genetic diversity of local fish populations is not always evident. In fact, in some cases, these releases have even shown positive effects on the abundance of fish populations. The investigation conducted by Berejikian et al. [29] exemplifies this phenomenon, illustrating that the introduction of hatchery-reared steelhead salmon into river ecosystems led to a notable augmentation in their spawning numbers at specific locations. This deliberate release strategy was found to significantly enhance the reproductive success of the steelhead salmon in their natural habitat, consequently exerting a favorable influence on the broader river ecosystem. Likewise, as indicated by Agnalt [30], European lobsters that underwent hatchery rearing displayed spawning levels comparable to their wild counterparts upon release. The methodology involving hatchery rearing followed by release was observed not only to sustain spawning levels but also to fortify the indigenous European lobster resources. This approach, thereby, makes a positive contribution to the equilibrium and sustainability of the ecosystem.
From the point of view of genetic diversity, haplotype diversity of S. marmoratus ranged from 0.944 to 0.980, and the average nucleotide diversity ranged from 0.020 to 0.025. Both of this parameters indicate that S. marmoratus has a high level of genetic diversity, indicating a long evolutionary history between its divergent lineages or having undergone secondary contact [31]. Similar results were found by Liu et al. [32] and they also used the mitochondrial DNA (mtDNA) control region as a molecular marker to explore the genetic diversity of S. marmoratus in the northwestern Pacific Ocean. Based on the data of Liu et al. [32], the haplotype diversity of S. marmoratus in Zhoushan was 0.9601 ± 0.0238, and nucleotide diversity was 0.0219 ± 0.0116, which is similar to our results. Furthermore, after conducting a BLAST comparison on the NCBI website (https://blast.ncbi.nlm.nih.gov/Blast.cgi, accessed on 22 April 2024), our study identified 16 haplotypes (including shared haplotypes: Haplotypes 4, 6, 7, 12, 18 and 22) that are identical to those found in the study by Liu et al. The emergence of additional haplotypes may be attributed to recent enhancement and release activities. Based on the AMOVA analysis and haplotype phylogenetic tree, intra-population variability is similar to the inter-population variability. The populations we investigated, especially the mixed population where released individuals often originate from fish farms, may have originated from a relatively limited number of individuals. This could result in a founder effect, where the genetic diversity within the released population and among different populations becomes more similar due to their shared genetic origin. On a larger scale, as observed in our study, the genetic diversity of S. marmoratus exhibited a high haplotype diversity and low nucleotide diversity in the northwestern Pacific [32]. This pattern may be explained by the effects of glacial cycles. Due to the harsh glacial environment, S. marmoratus faced species extinction in many areas, but some individuals survived due to their distribution in the East China Sea basin. During the post-glacial period, as the environment became more favorable, S. marmoratus populations began to expand outward, resulting in the genetic diversity observed today [33,34,35]. Xu et al. [36] used single-nucleotide polymorphisms (SNPs) to conduct PCA and topology analyses, indicating that the East China Sea glacial refugium, particularly the Okinawa Trough, serves as the center of diversity and origin for S. marmoratus.
On the foundation of a star-like topological structure, no significant differences in haplotypes within these three branches were observed across the four populations and shared haplotypes were excited among the four populations (Haplotypes 6, 7, 18 and 22). More interestingly, Haplotype 4 is exclusive to the SS, DJ, and DT populations, while it is absent in the YZ population. Additionally, YZ exhibits the lowest haplotype diversity among the four populations, paired with the highest nucleotide diversity. Tajima’s D test for neutral selection further reveals distinctions in YZ, suggesting positive selection effects. In summary, differences exist between the cultured population and others, likely attributed to unique environmental conditions, the specificity of the number and source of parents [37]. Therefore, considering the specific environment of the farm, Haplotype 4 might not be suitable for survival and could have been eliminated. Furthermore, based on genetic distance, the SS and DT populations are the closest because they are both wild populations. And compared with other populations, the genetic distance of DJ and YZ population is closer. This observation may be linked to the artificial enhancement and release activities of S. marmoratus [38]. Notably, there was an absence of stocking in the SS and DT regions, and DJ was the primary zone for the proliferation and release activities of S. marmoratus. Sebastiscus marmoratus is an ovoviviparous organism, and its strong site fidelity and sedentary behavior make gene flow exchange challenging. The released individuals introduce genes from the breeding farm and facilitate genetic exchange between the YZ and DJ populations. The study’s findings indicate genetic diversity disparities between cultured and other populations, but this difference has not yet reached a significant level [31]. This implies a potential shared evolutionary ancestor between the SS and DT populations, resulting in their relatively close genetic distance. Influenced by the artificial enhancement and release activities of S. marmoratus, the DJ population occupies an intermediate position between the other two populations. For a comprehensive understanding, a deeper analysis of the impact of stocking activities on the genetic structure of S. marmoratus populations was undertaken, revealing novel insights in FST and gene flow analyses. The FST values between the YZ population and others range from 0.011 to 0.034, generally insignificantly small, except for the SS population where FST is both small and significant. Conversely, FST values between the DJ population and the SS and DT populations are less than 0, with Nm values showing a similar pattern. This indicates that, despite differences, the cultured population has not differentiated from others thus far. Directional relative migration networks illustrate the strongest gene flow from SS to YZ, attributed to the parental generation of the YZ population originating from the SS population. The phylogenetic tree based on haplotypes revealed no significant geographic agglomeration among four populations and the inter-population haplotypes were intermixed. Individuals of the same origin coming together and individuals of releasing interspersing within may be due to the fact that samples from the DJ population were obtained from sea fishing, encompassing both wild individuals and released individuals. AMOVA analysis similarly maintains that genetic variation primarily occurs within populations, suggesting no significant differentiation among the four populations.
In this study, we conducted a thorough and detailed analysis of the genetic diversity within the breeding population, released mix population, and wild population of S. marmoratus in the Zhoushan Sea area. The results indicate that there were no significant differences in genetic diversity observed among four populations. We further delved into the genetic differentiation among the four populations under consideration but found no conspicuous signs of genetic divergence. Consequently, we reasonably infer and conclude that the breeding and stocking activities of S. marmoratus in the Zhoushan Sea area have not resulted in significant adverse effects on genetic diversity. Leber et al. [39] suggested that the management and monitoring of the impact of hatchery-reared fish on natural populations are very important. We speculate that this phenomenon may be attributed to two reasons. Firstly, the duration of S. marmoratus enhancement and stocking activities in the Zhoushan Sea area has been relatively short. According to the report of Chen et al. [20], large-scale analyses of S. marmoratus breeding and releasing activities have only been carried out in Zhoushan waters in recent years. A similar phenomenon has been observed in the restocking activities of Sebastes schlegelii [40]. The results showed that compared with wild populations, the genetic diversity of released populations of S. schlegelii did not significantly decrease in the short term, and the genetic diversity index of recaptured populations did not change significantly. Wang et al. [40] shared a comparable perspective and speculated that short-term restocking activities would not significantly impact the genetic diversity of wild populations. Secondly, the selection of broodstock is crucial for producing individuals genetically related to local adaption. As indicated by the director of the breeding farm and research and our study, the parental stock of S. marmoratus originates exclusively from the local area. This approach has significantly minimized the adverse effects of breeding and releasing activities on the genetic diversity of local species. As the global trend of releasing hatchery-reared fish for stock enhancement becomes increasingly widespread, more scholars are delving into the potential impact of hatchery-reared juveniles on the genetic diversity of wild populations. The prevailing consensus among most researchers is that the local origin of hatchery fish broodstock is a key determinant of this impact [41,42]. Therefore, we believe it is essential to conduct genetic analysis on the species intended for release before initiating any enhancement and release activities. This will aid in selecting suitable individuals for release, thus mitigating the potential negative impact of such activities on the genetic diversity of local species.

5. Conclusions

The genetic diversity observed in the S. marmoratus broodstock population, the stocked population, and the marine fishery population was high, with no discernible genetic differentiation. This indicates that the current stock enhancement and release activities have not adversely affected the genetic diversity of S. marmoratus in the Zhoushan Sea area. This phenomenon may be linked to factors such as the quantity and duration of release, as well as the number and origin of the parent group. For future stocking activities, it is crucial to consider these factors, emphasizing the need for careful attention to the number and origin of the population involved and the ongoing monitoring of genetic diversity.

Author Contributions

Conceptualization, K.X. and Y.Y.; methodology, P.L., H.W. and Y.Y.; software, S.J. and X.C.; validation, J.L., Y.Y. and K.X.; formal analysis, S.J. and X.C.; investigation, H.W.; resources, K.X.; data curation, S.J. and X.C.; writing—original draft preparation, S.J. and X.C.; writing—review and editing, Y.Y. and P.L.; project administration, K.X.; funding acquisition, K.X. and J.L. All authors have read and agreed to the published version of the manuscript.

Funding

This research was funded by the Project of Bureau of Science and Technology of Zhoushan (No. 2021C21017) and National Key R&D Program of China (2019YFD0901204).

Institutional Review Board Statement

All animal experiments were conducted under the guidance of and approved by the Animal Research and Ethics Committee of Zhejiang Ocean University (approval code: 2024061; approval date: 17 January 2024).

Informed Consent Statement

Not applicable.

Data Availability Statement

Data will be provided by the corresponding author upon reasonable request.

Conflicts of Interest

The authors declare no conflicts of interest.

References

  1. Li, M.Z.; Zeng, Y.; Ren, T.J. Study on the problems and counter-measures of fishery proliferation and release in China. China Fish. 2021, 2021, 42–45. [Google Scholar]
  2. Li, K.Z.; Wang, C.G.; Liang, H.Y.; Zhao, G.Q.; Li, C.Y.; Qiu, S.Y. Research on contribution rate of resources on proliferation and releasing of penaeus chinensis in the southern Shandong Peninsula. Tournal Yantai Univ. (Nat. Sci. Eng. Ed.) 2019, 32, 165–170. [Google Scholar] [CrossRef]
  3. Shui, B.N. Rethinking and optimization of releasing stock enhancementfor marine fishery resources: A review. J. Dalian Ocean. Univ. 2023, 38, 737–743. [Google Scholar] [CrossRef]
  4. Xu, K.D.; Zhou, Y.D.; Wang, Y.; Wang, W.D.; Xu, H.X.; Zhang, H.L.; Li, P.F.; Lian, J.; Chen, F.; Lu, Z.H.; et al. Effect and assessment of enhancement release of Sepiella maindroni in the northern coastal water of Zhejiang. J. Fish. Sci. China 2018, 25, 654–662. [Google Scholar] [CrossRef]
  5. Li, L.P.; Huang, S.L. A study on management of stock enhancement in China. J. Shanghai Ocean. Univ. 2011, 20, 765–772. [Google Scholar] [CrossRef]
  6. Liao, Z.; Chen, X.Y.; Hao, Y.F.; Yin, D.; Tian, P.; Zeng, S. The Application of Marking Techniques Is Used to Assess the Effects of Fishery Stocking and Release. Mod. Anim. Husb. Sci. Technol. 2024, 02, 112–114. [Google Scholar] [CrossRef]
  7. Laikre, L.; Schwartz, M.K.; Waples, R.S.; Ryman, N. Compromising genetic diversity in the wild: Unmonitored large-scale release of plants and animals. Trends Ecol. Evol. 2010, 25, 520–529. [Google Scholar] [CrossRef]
  8. Qi, J.F.; Yin, B.S.; Zhang, Q.L.; Yang, D.Z.; Xu, Z.H. Seasonal variation of the Taiwan Warm Current Water and its underlying mechanism. Chin. J. Oceanol. Limnol. 2017, 35, 1045–1060. [Google Scholar] [CrossRef]
  9. Wei, Q.S.; Wang, B.D.; Zhang, X.L.; Ran, X.B.; Fu, M.Z.; Sun, X.; Yu, Z.G. Contribution of the offshore detached Changjiang (Yangtze River) Diluted Water to the formation of hypoxia in summer. Sci. Total Environ. 2021, 764, 142838. [Google Scholar] [CrossRef]
  10. Xu, X.; Tang, W.R.; Wang, Y.B. Releasing capacity of Portunus trituberculatus enhancement in Zhoushan fishing ground and Yangtze river estuary fishing ground and their adjacent waters. South China Fish. Sci. 2019, 15, 126–132. [Google Scholar]
  11. Nakabo, T. Fishes of Japan: With Pictorial Keys to the Species; Tokai University Press: Tokyo, Japan, 2002; Volume 2. [Google Scholar]
  12. Fujita, H.; Kohda, M. Timing and sites of parturition of the viviparous scorpionfish, Sebastiscus marmoratus. Environ. Biol. Fishes 1998, 52, 225–229. [Google Scholar] [CrossRef]
  13. Chen, D.G.; Zhang, M.Z. Chinese Marine Fishes; Ocean University of China Press: Qindao, China, 2015. [Google Scholar]
  14. Sun, D.Q.; Shi, G.; Liu, X.Z.; Wang, R.X.; Xu, T.J. Genetic diversity and population structure of the marbled rockfish, Sebastiscus marmoratus, revealed by SSR markers. J. Genet. 2011, 90, e21–e24. [Google Scholar] [CrossRef] [PubMed]
  15. Xu, M.H. Preliminry study on the fishries biology of Sebasticus marmoratus. Fish. Inf. Strategy 2000, 2000, 17–20. [Google Scholar]
  16. Wu, C.W. Biological Studies on Sebastiscus marmoratus of Zhoushan. J. Zhejiang Ocean. Univ. (Nat. Sci. Ed.) 1999, 16, 169–174. [Google Scholar]
  17. Wourms, J.P.; Grove, B.D.; Lombardi, J. The Maternal-Embryonic Relationship in Viviparous Fishes. In Fish Physiology; Hoar, W.S., Randall, D.J., Eds.; Academic Press: Cambridge, MA, USA, 1988; Volume 11, pp. 1–134. [Google Scholar]
  18. Liu, M.Z.; Yang, F.; Jiang, R.J.; Yin, R.; Wang, J.; Xiao, Y.; Ling, T.; Zhu, S.L. Trophic niche and potential carbon source of three reef-associated fishes of Zhongjieshan Islands. Ying Yong Sheng Tai Xue Bao 2023, 34, 1130–1136. [Google Scholar] [CrossRef] [PubMed]
  19. Hao, H.B.; Jiang, R.J.; Lan, D.; Wang, Y.B.; Shan, X.L.; Li, P.F.; Liu, M.Z.; Li, X.F.; Yang, F.; Yin, R. Assessment of ecological carrying capacity of sebastiscus marmoratus in Zhoushan Sea Area in the Ecopath model. Oceanol. Et. Limnol. Sin. 2023, 54, 1672–1681. [Google Scholar]
  20. Chen, X.Y.; Xu, K.D.; Li, P.F.; Wang, H.X.; Zhou, Y.D.; Wang, M.J. Analysis of the Status of Marine Fish Proliferation and Release in Zhejiang Offshore. Ocean. Dev. Manag. 2023, 40, 128–135. [Google Scholar] [CrossRef]
  21. Aljanabi, S.M.; Martinez, I. Universal and rapid salt-extraction of high quality genomic DNA for PCR-based techniques. Nucleic Acids Res. 1997, 25, 4692–4693. [Google Scholar] [CrossRef]
  22. Han, Z.Q.; Gao, T.X.; Yanagimoto, T.; Sakurai, Y. Genetic population structure of Nibea albiflora in Yellow Sea and East China Sea. Fish. Sci. 2008, 74, 544–552. [Google Scholar] [CrossRef]
  23. Hall, T.A. Bioedit: A User-Friendly Biological Sequence Alignment Editor and Analysis Program for Windows 95/98/NT. Nucleic Acids Symp. Ser. 1999, 41, 95–98. [Google Scholar]
  24. Kumar, S.; Stecher, G.; Li, M.; Knyaz, C.; Tamura, K. MEGA X: Molecular Evolutionary Genetics Analysis across Computing Platforms. Mol. Biol. Evol. 2018, 35, 1547–1549. [Google Scholar] [CrossRef] [PubMed]
  25. Rozas, J.; Ferrer-Mata, A.; Sánchez-DelBarrio, J.C.; Guirao-Rico, S.; Librado, P.; Ramos-Onsins, S.E.; Sánchez-Gracia, A. DnaSP 6: DNA Sequence Polymorphism Analysis of Large Data Sets. Mol. Biol. Evol. 2017, 34, 3299–3302. [Google Scholar] [CrossRef] [PubMed]
  26. Excoffier, L.; Lischer, H.E. Arlequin suite ver 3.5: A new series of programs to perform population genetics analyses under Linux and Windows. Mol. Ecol. Resour. 2010, 10, 564–567. [Google Scholar] [CrossRef] [PubMed]
  27. Bandelt, H.J.; Forster, P.; Röhl, A. Median-joining networks for inferring intraspecific phylogenies. Mol. Biol. Evol. 1999, 16, 37–48. [Google Scholar] [CrossRef] [PubMed]
  28. Araki, H.; Schmid, C. Is hatchery stocking a help or harm? Evidence, limitations and future directions in ecological and genetic surveys. Aquaculture 2010, 308, S2–S11. [Google Scholar] [CrossRef]
  29. Berejikian, B.; Johnson, T.; Endicott, R.; Lee-Waltermire, J. Increases in steelhead (Oncorhynchus mykiss) redd abundance resulting from two conservation hatchery strategies in the Hamma Hamma River, Washington. Can. J. Fish. Aquat. Sci. 2008, 65, 754–764. [Google Scholar] [CrossRef]
  30. Agnalt, A.L. Fecundity of the European lobster (Homarus gammarus) off southwestern Norway after stock enhancement: Do cultured females produce as many eggs as wild females? ICES J. Mar. Sci. 2007, 65, 164–170. [Google Scholar] [CrossRef]
  31. Grant, W.; Bowen, B. Shallow population histories in deep evolutionary lineages of marine fishes: Insights from sardines and anchovies and lessons for conservation. J. Hered. 1998, 89, 415–426. [Google Scholar] [CrossRef]
  32. Liu, L.; Zhang, X.M.; Li, C.H.; Zhang, H.; Yanagimoto, T.; Song, N.; Gao, T.X. Population genetic structure of Marbled Rockfish, Sebastiscus marmoratus (Cuvier, 1829), in the northwestern Pacific Ocean. ZooKeys 2019, 830, 127–144. [Google Scholar] [CrossRef] [PubMed]
  33. Hewitt, G.M. Some genetic consequences of ice ages, and their role in divergence and speciation. Biol. J. Linn. Soc. 1996, 58, 247–276. [Google Scholar] [CrossRef]
  34. Liu, J.-X.; Gao, T.-X.; Yokogawa, K.; Zhang, Y.-P. Differential population structuring and demographic history of two closely related fish species, Japanese sea bass (Lateolabrax japonicus) and spotted sea bass (Lateolabrax maculatus) in Northwestern Pacific. Mol. Phylogenetics Evol. 2006, 39, 799–811. [Google Scholar] [CrossRef] [PubMed]
  35. Saavedra Sotelo, N.C.; Calderon Aguilera, L.E.; Reyes Bonilla, H.; Paz García, D.A.; López Pérez, R.A.; Cupul Magaña, A.; Cruz Barraza, J.A.; Rocha Olivares, A. Testing the genetic predictions of a biogeographical model in a dominant endemic Eastern Pacific coral (Porites panamensis) using a genetic seascape approach. Ecol. Evol. 2013, 3, 4070–4091. [Google Scholar] [CrossRef] [PubMed]
  36. Xu, S.; Song, N.; Zhao, L.; Cai, S.; Han, Z.; Gao, T. Genomic evidence for local adaptation in the ovoviviparous marine fish Sebastiscus marmoratus with a background of population homogeneity. Sci. Rep. 2017, 7, 1562. [Google Scholar] [CrossRef]
  37. Jonsson, B.; Jonsson, N. Cultured Atlantic salmon in nature: A review of their ecology and interaction with wild fish. ICES J. Mar. Sci. 2006, 63, 1162–1181. [Google Scholar] [CrossRef]
  38. Bert, T.M.; Crawford, C.R.; Tringali, M.D.; Seyoum, S.; Galvin, J.L.; Higham, M.; Lund, C. Genetic Management of Hatchery-Based Stock Enhancement. In Genetic Management of Hatchery-Based Stock Enhancement; Bert, T.M., Ed.; Springer Netherlands: Dordrecht, The Netherlands, 2007; Volume 6, pp. 123–174. [Google Scholar]
  39. Leber, K.M.; Brennan, N.; Arce, S.M. Recruitment patterns of cultured juvenile pacific threadfin, Polydactylus sexfilis (Polynemidae), released along sandy marine shores in Hawaii. Bull. Mar. Sci. 1998, 62, 389–408. [Google Scholar]
  40. Wang, L.J.; Wu, Z.H.; Wang, Y.J.; Liu, M.X.; Song, A.H.; Liu, H.J.; You, F. Genetic Assessment of a Black Rockfish, Sebastes schlegelii, Stock Enhancement Program in Lidao Bay, China Based on Mitochondrial and Nuclear DNA Analysis. Front. Mar. Sci. 2020, 7, 94–105. [Google Scholar] [CrossRef]
  41. Yang, Y.Y.; Shi, Y.R.; Zhang, H.; Pan, Y.; Zu, K.W.; Gao, T.X.; Song, N. Comparative analyses of genetic diversity of broodstock, hatchery-released and captured populations of Acanthopagrus schlegelii based on the mitochondrial DNA control region sequence. Period. Ocean. Univ. China 2023, 53, 50–58. [Google Scholar] [CrossRef]
  42. Shuang, Y.; Na, S.; Xiumei, Z.; Yunzhou, W.; Sijie, W.; Tianxiang, G. Genetic diversity of swimming crab (Portunus trituberculatus) from four broodstock populations in stock enhancement inferred from mitochondrial control region. J. Fish. China 2014, 38, 1089–1096. [Google Scholar]
Figure 1. The picture shows the sampling locations along the coast of China. SS stands for Shengsi, DJ stands for Dongji, YZ stands for Xixuan and DT stands for Dongtou. The circle and blue characters represent the wild population, the four-pointed star and red characters indicate the mixed population, and the five-pointed star represents the farmed population. The pie chart represents the haplotype of this group, and the different colors represent the different haplotypes.
Fishes 09 00161 g001
Figure 2. Directional relative migration networks of S. marmoratus populations constructed with online software divMigrate using Nm values above 0 (a), 0.35 (b) and 0.6 (c).
Fishes 09 00161 g002
Figure 3. A star-like topology of four S. marmoratus populations. Different colors stand for different populations and the size of the circle indicates the number of this haplotype.
Fishes 09 00161 g003
Figure 4. The neighbor-joining tree based on the haplotype of four S. marmoratus populations.
Fishes 09 00161 g004
Table 1. The sampling details for four populations of Sebastiscus marmoratus.
Sampling SiteAbbreviationCoordinateSampling Date
ShengsiSS30°42′ N 122°29′ EAugust 2023
DongjiDJ30°20′ N 122°36′ EMay 2023
XixuanYZ29°53′ N 122°18′ ENovember 2022
DongtouDT27°50′ N 121°14′ EAugust 2023
Table 2. Distribution of mitochondrial DNA control region haplotypes in four S. marmoratus populations.
HaplotypeSSDJDTYZAccession
Numbers
HaplotypeSSDJDTYZAccession Numbers
Hap_11 PP700307Hap_35 1 PP700341
Hap_21 PP700308Hap_36 1 1PP700342
Hap_31 PP700309Hap_37 1 PP700343
Hap_4413 PP700310Hap_38 1 PP700344
Hap_51 PP700311Hap_39 1 PP700345
Hap_65323PP700312Hap_40 1 PP700346
Hap_74435PP700313Hap_41 1 PP700347
Hap_81 PP700314Hap_42 11PP700348
Hap_91 PP700315Hap_43 1 PP700349
Hap_101 PP700316Hap_44 1 PP700350
Hap_111 PP700317Hap_45 1 PP700351
Hap_1212 1PP700318Hap_46 1 PP700352
Hap_131 PP700319Hap_47 1 PP700353
Hap_141 PP700320Hap_48 1 PP700354
Hap_1511 PP700321Hap_49 1 PP700355
Hap_161 PP700322Hap_50 1 PP700356
Hap_171 PP700323Hap_51 1 PP700357
Hap_181121PP700324Hap_52 1 PP700358
Hap_191 PP700325Hap_53 1 PP700359
Hap_201 PP700326Hap_54 1 PP700360
Hap_211 PP700327Hap_55 1 PP700361
Hap_221111PP700328Hap_56 1 PP700362
Hap_23 1 PP700329Hap_57 1 PP700363
Hap_24 1 PP700330Hap_58 1 PP700364
Hap_25 1 PP700331Hap_59 1 PP700365
Hap_26 1 PP700332Hap_60 1PP700366
Hap_27 1 PP700333Hap_61 2PP700367
Hap_28 1 PP700334Hap_62 1PP700368
Hap_29 1 PP700335Hap_63 1PP700369
Hap_30 1 PP700336Hap_64 4PP700370
Hap_31 1 PP700337Hap_65 3PP700371
Hap_32 1 PP700338Hap_66 2PP700372
Hap_33 1 PP700339Hap_67 2PP700373
Hap_34 1 PP700340Hap_68 1PP700374
Table 3. Genetic diversity analysis of four S. marmoratus populations.
PopulationSample SizeShHdKπPiJC
SS3044220.9619.2110.0200.020
DJ3244260.9809.6980.0210.022
YZ3145160.94411.6690.0250.026
DT3046230.97910.2300.0220.023
Total12373680.96610.2400.022
S, mutation sites; h, haplotypes numbers; Hd, haplotype diversity; K, average number of pairwise divergences; π, nucleotide diversity; PiJC, nucleotide diversity with JC.
Table 4. Genetic distance of four S. marmoratus populations.
PopulationSSDJDTYZ
SS0.021
DJ0.0210.022
DT0.0220.0220.023
YZ0.0240.0240.0250.026
Above the diagonal is the distance within the population, and below the diagonal is the distance between populations.
Table 5. AMOVA analysis of S. marmoratus populations.
Source
of Variation
d.f.Sum of SquaresVariance ComponentsPercentage
of Variation
One gene pool
(SS, DJ, DT, YZ)
Among populations317.3650.022 Va0.44
Within populations119607.2455.103 Vb99.56
Two gene pools
(SS, DT) (DJ, YZ)
Among groups17.2140.035 Va0.68
Among populations
Within groups
210.151−0.001 Vb−0.02
Within populations119607.2455.103 Vc99.34
Three gene pools
(SS, DT) (DJ) (YZ)
Among groups214.9480.133 Va2.58
Among populations
Within groups
12.417−0.090 Vb−1.74
Within populations119607.2455.103 Vc99.16
Table 6. FST and Nm analysis of four S. marmoratus populations.
PopulationSSDJDTYZ
SS infinf7.001
DJ−0.006 inf17.493
DT−0.017−0.018 21.527
YZ0.034 *0.0140.012
Taking the diagonal as an example, FST is below the diagonal and Nm is above the diagonal. “*” indicates the P is less than 0.05. and the “inf” stands for infinity.
Table 7. Neutral selection analysis of four S. marmoratus populations.
StatisticsSSDJDTYZMeans.d.
Tajima’s D testTajima’s D−0.632−0.412−0.4430.133−0.3380.329
p-value0.3080.3620.3510.6090.4080.136
Fu’s FS testFS−0.632−11.579−7.465−0.008−6.5054.799
p-value0.0130.0020.0070.5250.1370.259
Disclaimer/Publisher’s Note: The statements, opinions and data contained in all publications are solely those of the individual author(s) and contributor(s) and not of MDPI and/or the editor(s). MDPI and/or the editor(s) disclaim responsibility for any injury to people or property resulting from any ideas, methods, instructions or products referred to in the content.

